Example
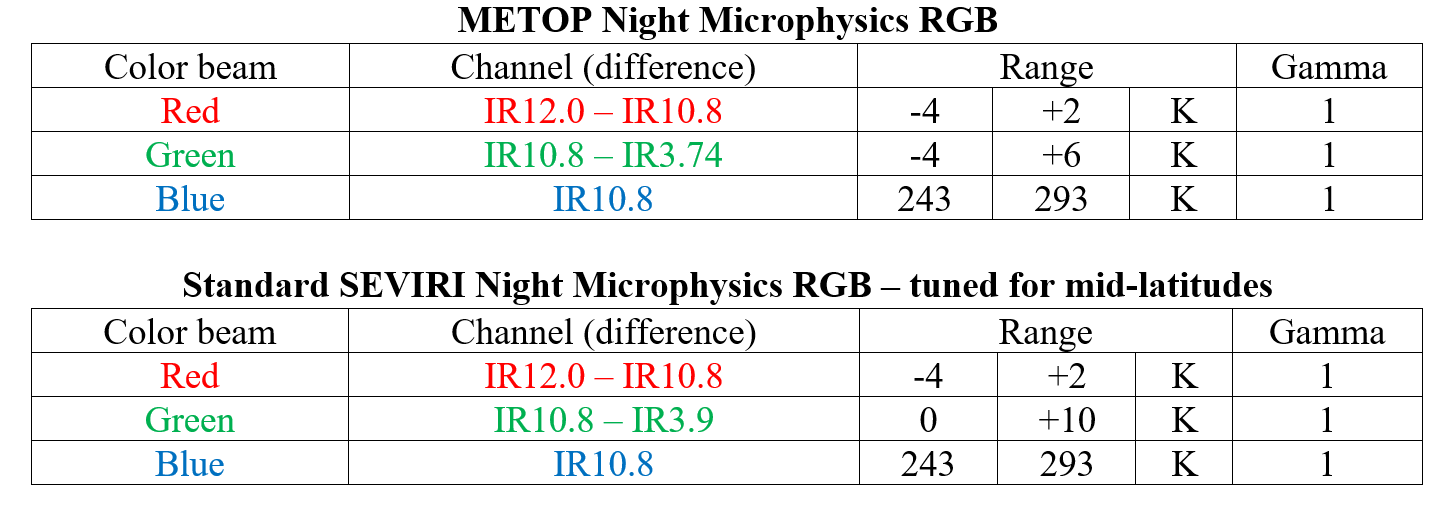
The process of building an RGB is illustrated here for a METOP AVHRR Night Microphysics RGB image, taken on 10 December 2015 at 03:18 UTC. The recipe (scheme) of the METOP AVHRR Night Microphysics RGB is shown below. This recipe was adapted from the standard SEVIRI Night Microphysics RGB.
In this chapter we will discuss how the SEVIRI RGB was created and how it was adapted to the METOP AVHRR imager. We will discuss the similarities and differences between the two recipes.
Step 1: Aim
To provide general cloud analyses during the night, focusing on detection of low-level cloud.
Step 2: Selection of the channels (and channel combinations)
Let us look first at the components of the SEVIRI Night Microphysics RGB one-by-one. Which channels were chosen to create the SEVIRI Night Microphysics RGB and why?
Channel IR10.8 provides information about the temperature of thick cloud tops and the surface. In this channel "sufficiently cold", thick clouds can easily be detected. However, detection of low water clouds and thin cirrus clouds may be problematic.
The (IR10.8 - IR3.9) channel difference helps to separate low water clouds from cloud-free surfaces. This value is rather different for low water clouds. It is large positive for low water clouds, around zero for cloud-free surfaces and large negative for thin cirrus clouds.
The (IR12.0 - IR10.8) channel difference helps to detect thin ice clouds. Very thin ice clouds are clearly visible using the (IR12.0 - IR10.8) brightness temperature difference, and almost not seen in channel IR10.8. This difference is much smaller for thin cirrus clouds than for the other phenomena.
Can we use the same channel and channel differences for the METOP AVHRR Night Microphysics RGB?
- The IR12.0 and IR10.8 channels of METOP AVHRR are similar to those of SEVIRI (same central wavelengths, different widths, different spectral response functions, similar properties, similar information content).
- There is a shift between the central wavelengths of the IR3.7 AVHRR and the IR3.9 SEVIRI channels, but the main characteristics are the same.
Step 3: Proper enhancement of the chosen channel and channel combinations
Enhancement of IR10.8
For weather forecasters the IR10.8 single image is usually visualized in inverted mode, whereas in the Night Microphysics RGB the image is not inverted. For SEVIRI the IR10.8 image is linearly stretched in the (-30, +20°C) brightness temperature range, which is the typical nighttime temperature range of cloud-free surfaces and water clouds at mid-latitudes. For METOP the same range is used.
Fig. 2 shows the pre-processed AVHRR IR10.8 image in inverted (left) and non-inverted (right) display modes. The left panel shows how it is displayed for forecasters, while the right panel shows the enhanced image used in the METOP AVHRR Night Microphysics RGB.
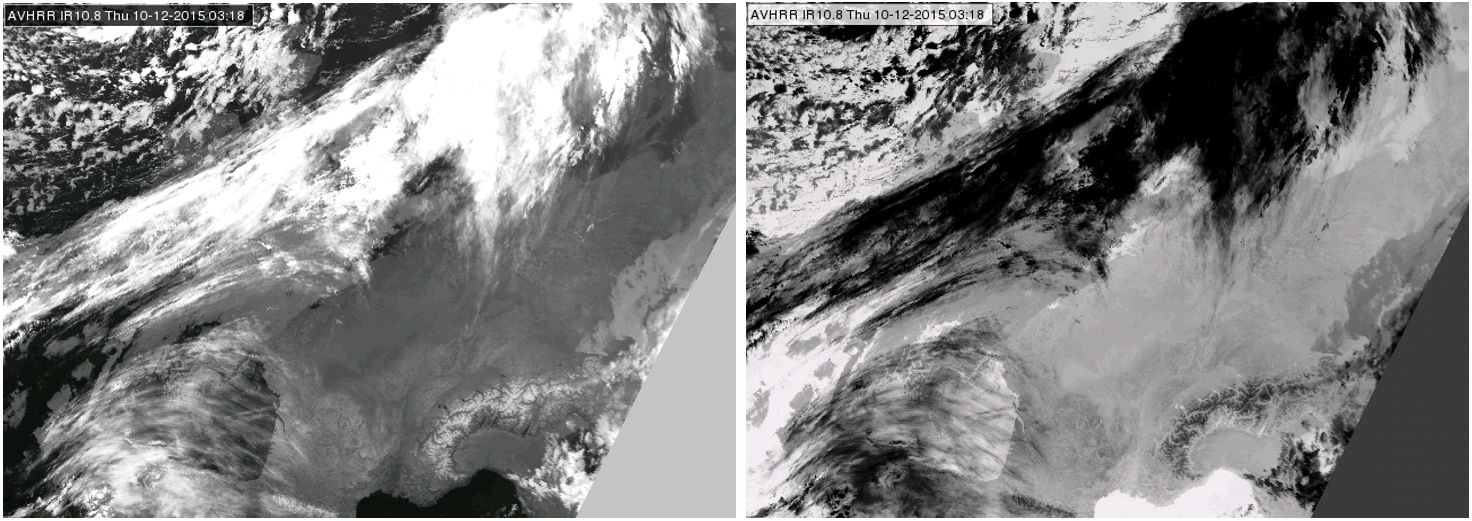
Fig. 2: Metop AVHRR IR10.8 image, 10 December 2015, 03:18 UTC, range: 243-293 K.
Enhancement of (IR10.8 - IR3.9) channel difference for SEVIRI and (IR10.8 - IR3.7) channel difference for METOP AVHRR
This is the key channel combination for separating low-level water clouds from cloud-free surfaces
The IR3.9 SEVIRI and the IR3.7 AVHRR channel responses are displaced from each other in wavelength but both work well for low cloud detection. These channels are close to a CO2 absorption band, situated around 4.3 µm. The absorption is stronger in the SEVIRI 3.9 µm channel than in the METOP AVHRR 3.7 µm channel, as illustrated in Fig. 3. The figure shows the spectral response function of SEVIRI IR3.9 (curve filled with grey color) and METOP AVHRR IR3.7 (violet curve) channels, together with the atmospheric transmittance (blue curve), bottom-of-atmosphere (BOA) thermal emittance for a 310K blackbody (green curve) and the top-of-atmosphere (TOA) equivalent after the emitted radiation has passed through the intervening atmosphere to space (red curve). The red and blue curves were simulated for a standard atmosphere (Wooster et al., 2015).
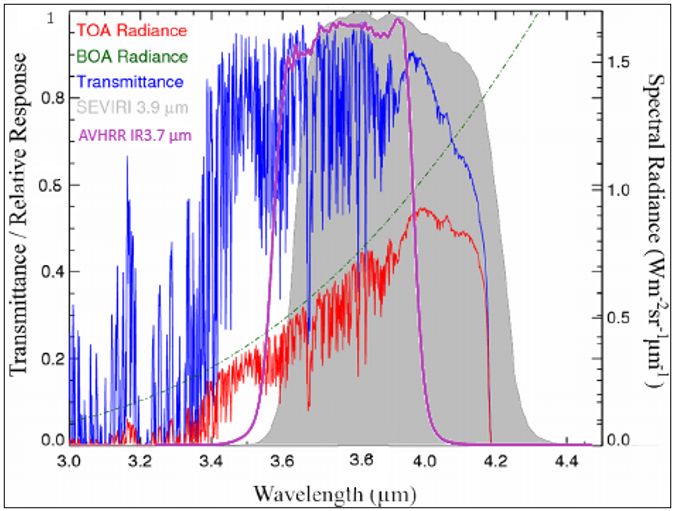
Fig. 3: Spectral response functions of SEVIRI IR3.9 and AVHRR IR3.7 channels (curve filled with grey color and violet curve, respectively), atmospheric transmittance (blue curve), bottom-of-atmosphere (BOA) thermal emittance for a 310K blackbody (green curve) and the top-of-atmosphere (TOA) equivalent after the emitted radiation has passed through the intervening atmosphere to space (red curve). The red and blue curves were simulated for a standard atmosphere. (Credit to Wooster et al., 2015)
Because of the different absorption characteristics in the SEVIRI and AVHRR channels, the range of interest of the channel difference is not the same for AVHRR and SEVIRI (an RTM calculation helps to find the range of interest).
Fig. 4 shows the IR10.8 and IR3.7 METOP AVHRR channels separately and their difference (enhanced according to the AVHRR recipe). The low clouds are seen much better in the difference image.
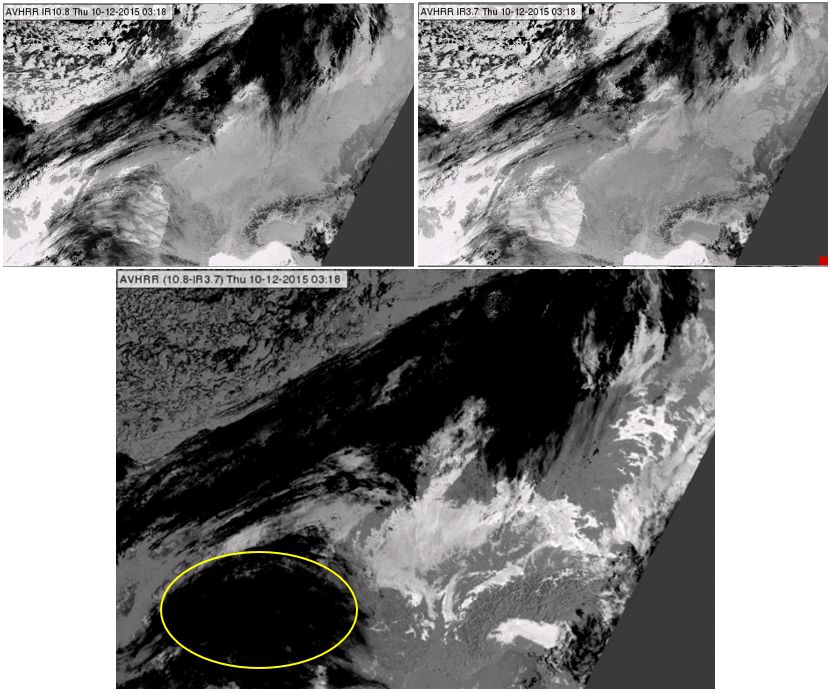
Fig. 4: METOP AVHRR IR10.8 and IR3.7 channels (upper left and right, respectively) and (IR10.8-IR3.7) channel difference image (bottom), range: -4, +6 K. Images were taken on 10 December 2015 at 03:18 UTC. The encircled area contains thin ice clouds seen in the IR12.0, IR10.8 and IR3.7 images but not seen in the difference image.
The (IR10.8-IR3.9) channel difference could be highlighted in a way that both low water clouds and thin ice clouds are clearly separable from other phenomena. However, the creator of the Night Microphysics RGB used a narrower range. This narrower range provides better color contrast between low clouds and cloud-free surface, but thin and thick ice clouds are not separable from each other (appearing both black). However, the (IR12.0-IR10.8) channel difference helps to identify the thin ice clouds: compare the encircled area in Fig. 4 with the same area in Figs. 5 and 6.
Enhancement of the (IR12.0 - IR10.8) channel difference
This is the key channel difference for identifying thin cirrus clouds and low-level moisture; thin ice clouds are clearly visible using the (IR12.0 - IR10.8) difference image. Stretching the contrast to the -4 to +2 K range provides a sharp depiction of the thin cirrus clouds. This difference is typically negative for thin cirrus clouds (and around zero for thick clouds).
This range is good for METOP AVHRR data as well. Fig. 5 shows the METOP AVHRR (IR12.0 - IR10.8) channel difference image taken on 10 December 2015 at 03:18 UTC.
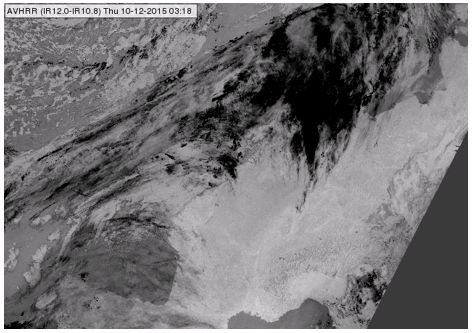
Fig. 5: METOP AVHRR (IR12-10.8) difference image, range: -4, +2 K. 10 December 2015 at 03:18 UTC.
In the Night Microphysics RGB no gamma or other non-linear stretching is applied. However, in several other RGBs non-linear stretching is used. A summary of how to perform a gamma correction is described in the appendix.
Step 4: Color assignment
The creator (Daniel Rosenfeld) of the SEVIRI Night Microphysics RGB assigned the information on low water clouds (IR10.8-IR3.9) to the green color beam because the human eye is most sensitive in this spectral region. Additionally, in this case the color of the low clouds more closely resembles their natural color. IR10.8 was assigned to the blue color beam so that the ocean surface appears mostly in natural bluish colors.
For the Metop AVHRR Night Microphysics RGB the same color assignment as for the SEVIRI Night Microphysics RGB is applied.
Fig. 6 shows which channels and channel combinations are assigned to the red, green and blue primary colors and the resulting Night Microphysics RGB image. The components are visualized on a black and white color scale (upper row) and on red-black, green-black and blue-black color scales (middle row).
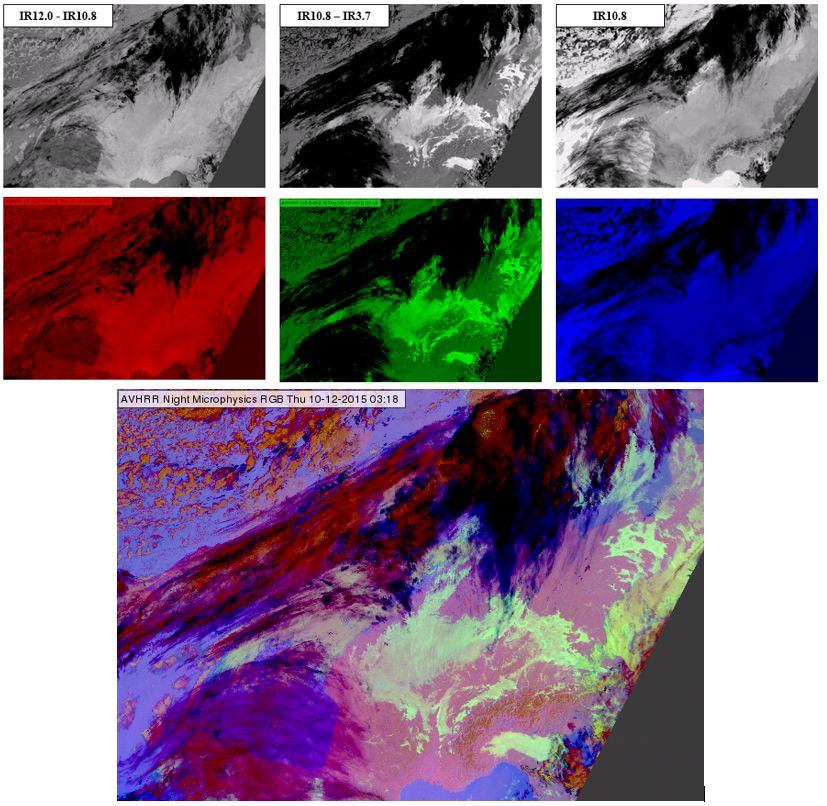
Fig. 6: METOP AVHRR (IR12.0-IR10.8) and (IR10.8-IR3.7) difference images and IR10.8 image visualized on a black and white color scale (upper row), on red-black, green-black and blue-black color scales (middle row) and the Night Microphysics RGB (bottom). 10 December 2015 at 03:18 UTC.