Typical colours
This chapter presents the typical colours in Cloud Type RGBs with examples. Fig. 4.1 summarizes the main typical colours that appear in the Cloud Type RGB.
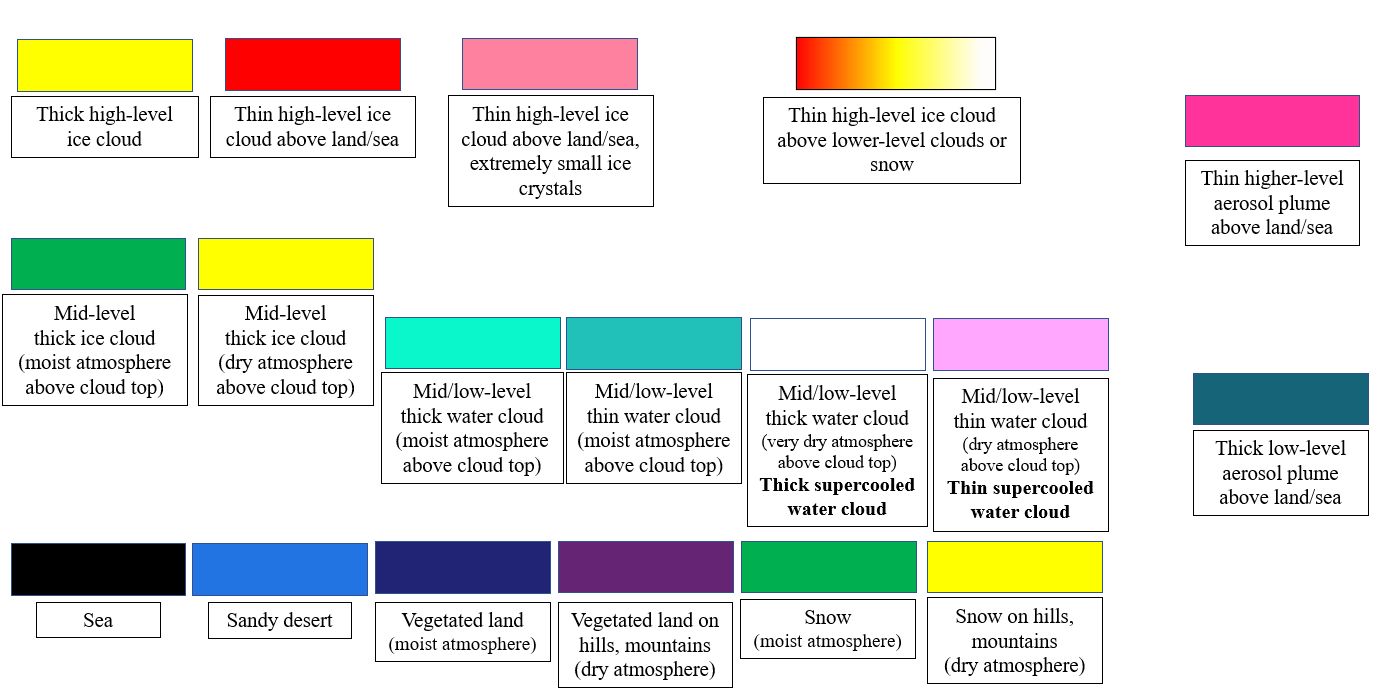
Fig. 4.1: Typical Cloud Type RGB colours
The typical colours depend not only on the physical properties of the reflecting object (cloud/surface/aerosol plume) and on the satellite and solar zenith angles, but also on the vertically integrated water vapour amount above the cloud top.
- For high-level clouds, there is usually a significant contribution from NIR1.3.
- For mid/low-level clouds and surface, there is usually a small or no contribution from NIR1.3.
However, sometimes the WV amount above the (mid- or low-level) reflecting object is not sufficient to absorb all the radiation at 1.3 µm. In that case the red component might be strong enough (compared to the other two components) to noticeably modify the colour. (Due to the strong enhancement a 2-5% NIR1.3 reflectivity value may already be strong enough to modify the RGB colour.)
Note that the colour shade of thin phenomena also depends on their transparency and the colour of the underlying surface or cloud. For example, the colours of thin clouds above sandy desert often appear in different shades (stronger blue signal) than in Fig. 4.1.
Thick high-level ice clouds
Thick high-level ice clouds appear yellow in the Cloud Type RGB.
Explanation of the colour:
- The red signal is strong (because the water vapour amount is small above the top of a high cloud) and it is usually oversaturated as the cloud is thick.
- The green signal is strong as the cloud is thick.
- The blue signal is weak, as the cloud is covered by ice crystals that absorb radiation in the NIR1.6 region.
Fig. 4.2 shows convective and frontal clouds. The yellow colour indicates thick high-level ice clouds.
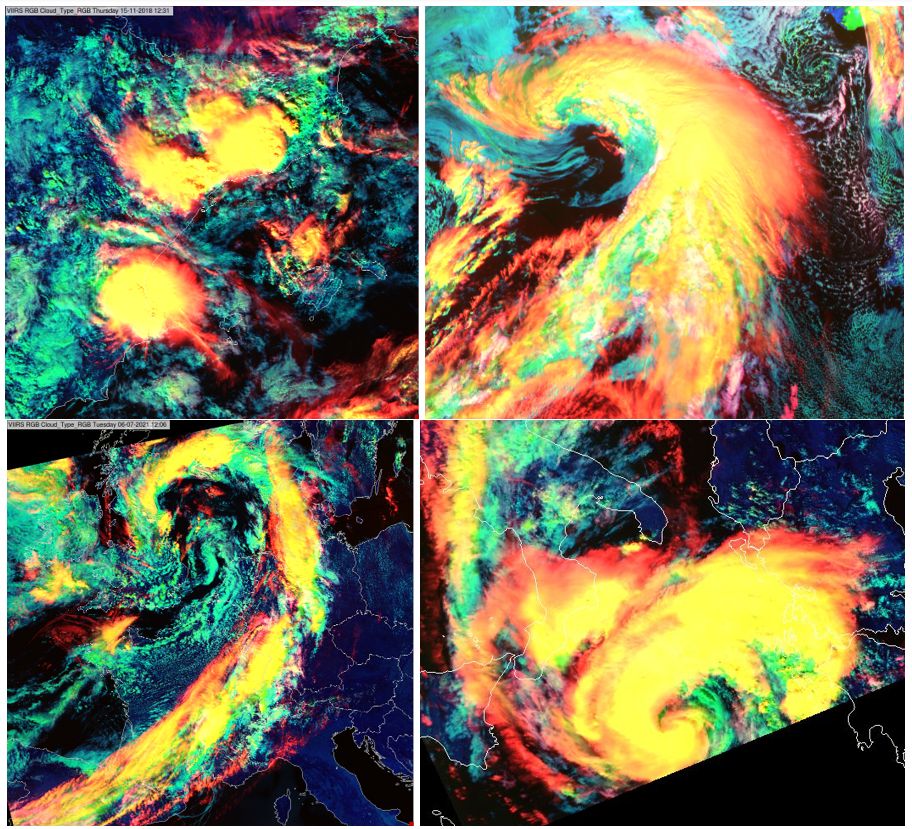
Fig. 4.2: Upper left: thick high-level ice clouds in a VIIRS Cloud Type RGB taken on 15 November 2018, at 12:31 UTC. Upper right: front above Atlantic Ocean, FCI Cloud Type RGB, 18 March 2023, 11:50 UTC (preliminary commissioning data). Bottom left: front above Europe, VIIRS Cloud Type RGB, 06 July 2021, 12:06 UTC, Bottom right: Medicane, VIIRS Cloud Type RGB, 17 September 2020, 10:50 UTC. (Credit to NOAA and EUMETSAT)
Thin high-level ice cloud above snow/ice-free land and sea
Thin high-level ice clouds above sea or land appear in reddish tones in the Cloud Type RGB, if the land is not desert and the surface is not covered by snow or ice.
Explanation of the colour:
- The red signal varies from weak to strong. It is a high-level cloud with a small water vapour amount above it, so NIR1.3 can see it. The cloud is thin, so the reflected radiation is not strong, but the image is strongly enhanced.
- The green signal is relatively weak: open water and vegetated land do not reflect much radiation and the cirrus is thin.
- The blue signal is also relatively weak, but over land it is somewhat stronger than the green signal.
Figs. 4.3 and 4.4 show examples of thin cirrus clouds, the thin parts of the anvils of convective clouds and high-level lee clouds. They appear red.
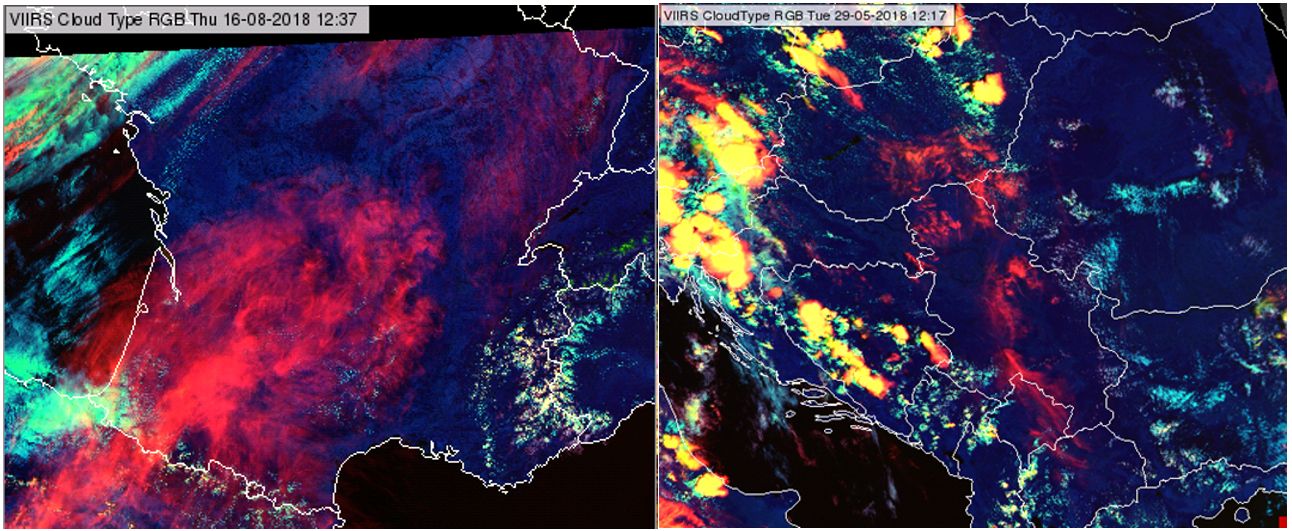
Fig. 4.3: VIIRS Cloud Type RGB images taken on 16 August 2018 at 12:37 UTC (left) and 29 May 2018 at 12:17 UTC (right). (Credit to NOAA)
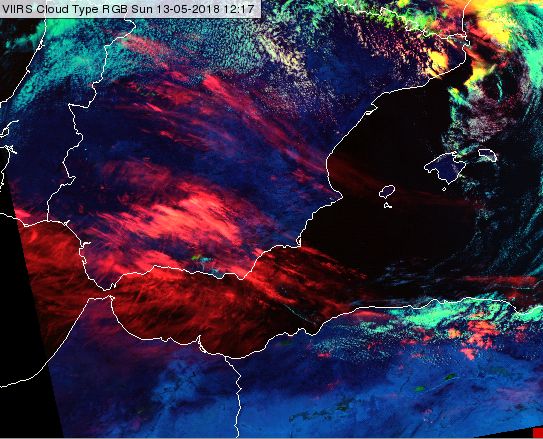
Fig. 4.4: VIIRS Cloud Type RGB taken on 13 May 2018 at 12:17 UTC. (Credit to NOAA)
Note that high-level lee clouds may appear reddish or pinkish (see the clouds indicated by yellow arrows in Fig. 4.21). This is because high-level lee clouds often consist of extremely small ice crystals, which strengthens the blue signal.
Thin high-level ice cloud above lower-level clouds or snow
Thin cirrus clouds above lower-level clouds may appear in reddish, yellowish or whitish tones, depending on the optical properties of the cirrus and the lower clouds, the viewing angles, etc. Fig. 4.5 shows such examples. The white lines in the right panel are contrails above stratus. (The darker lines with the same shapes are their shadows cast on the stratus top).
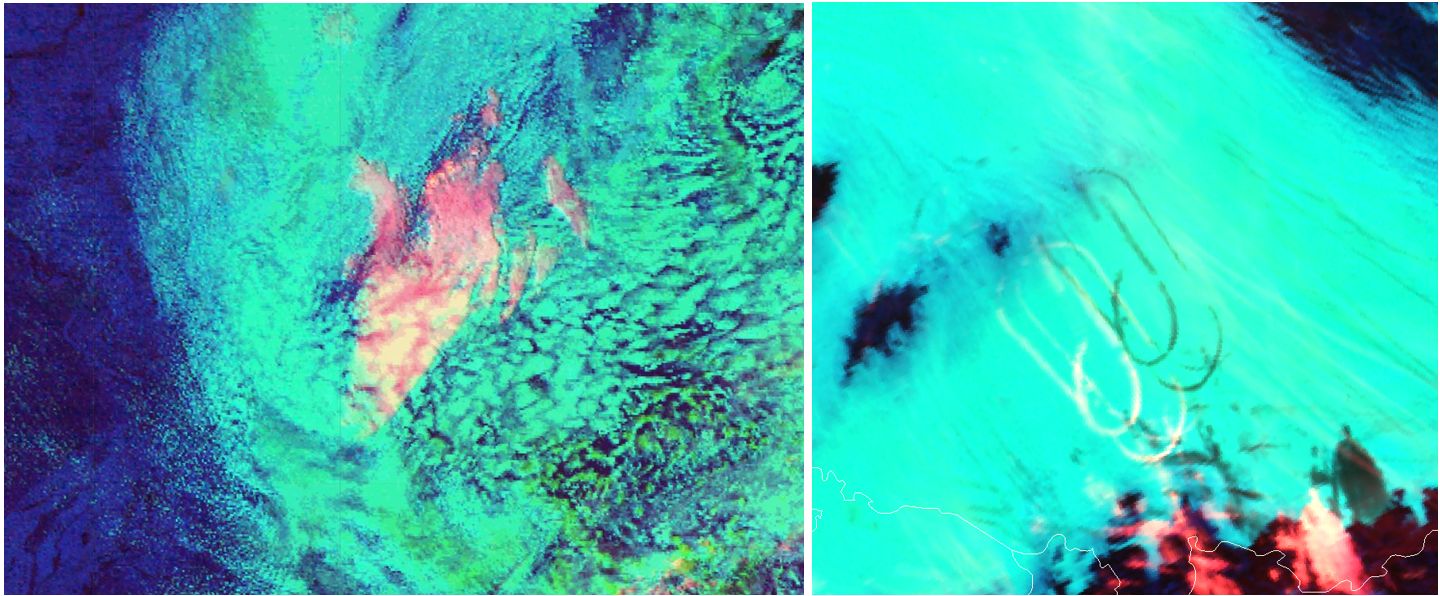
Fig. 4.5: GOES East ABI Cloud Type RGB, 16 October 2023, 18:00 UTC (left), and VIIRS Cloud Type RGB, 15 November 2018, 10:51 UTC (right). (Credit to NOAA)
Thin cirrus clouds above snow appear in reddish or yellowish tones, see an example in Fig. 4.6 (snow appears green).
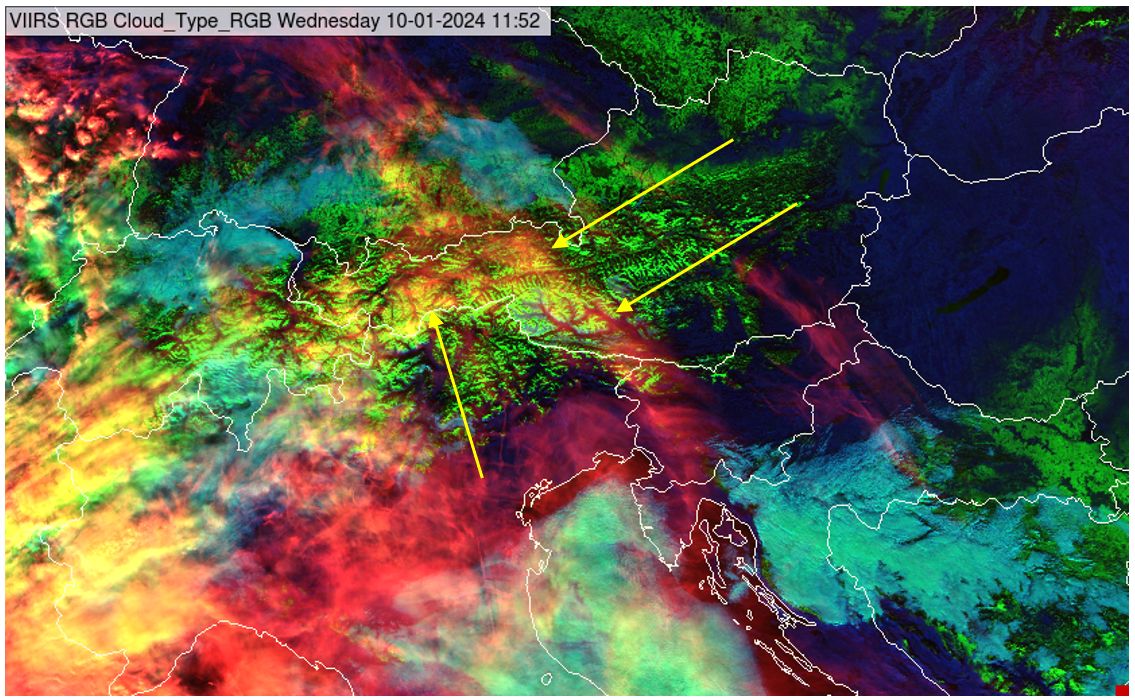
Fig. 4.6: VIIRS Cloud Type RGB taken on 10 January 2024 at 11:52 UTC. (Credit to NOAA)
Thick mid-level ice clouds
Thick mid-level ice clouds usually appear green. However, in some cases (if the water vapour amount aloft is small) they may appear yellow.
Exlanation of the colour:
- The red signal can be weak to strong: weak if the water vapour amount above the cloud top is large; strong if there is not much moisture above the cloud top.
- The green signal is strong as the cloud is thick.
- The blue signal is usually weak because it is a thick ice cloud.
Figs. 4.7 and 4.8 present Cloud Type RGB images along with Cloud Phase RGB images. The Cloud Phase RGB is visualized to help to identify thick ice clouds. (The Cloud Phase RGB is the most reliable RGB to distinguish thick ice clouds from thick water clouds.) In the Cloud Phase RGB the blue colour indicates thick ice clouds, while yellowish, pink and magenta colours indicate thick water clouds.
Fig. 4.7 shows convective clouds above the Bay of Biscay. According to the Cloud Top Height product (not shown) these are mid-level clouds. In the Cloud Type RGB the same clouds that are blue in Cloud Phase RGB appear green or yellow.
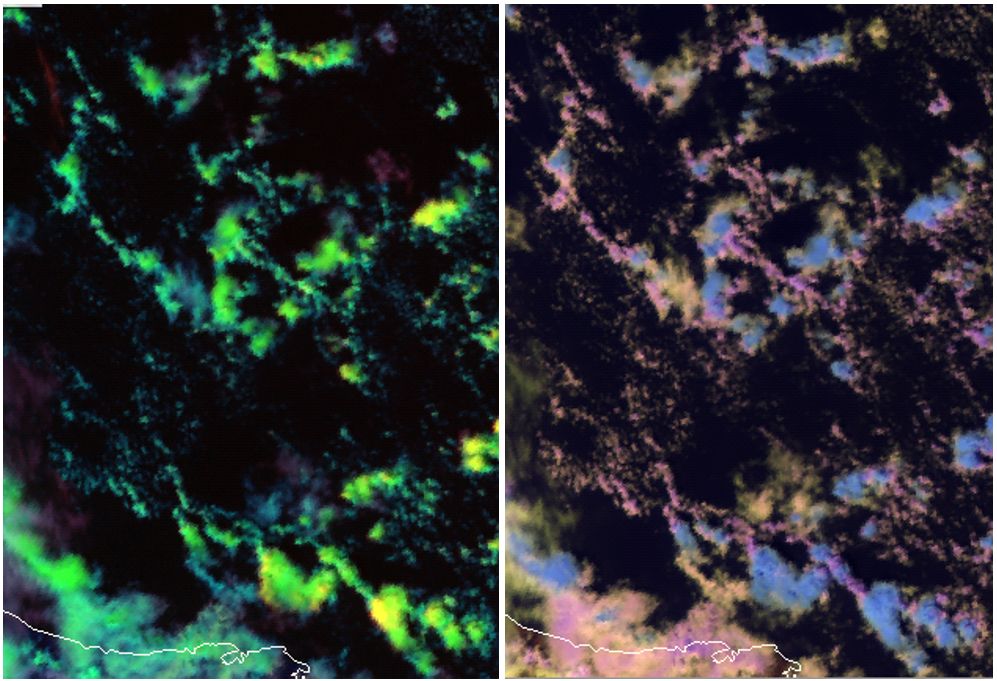
Fig. 4.7: VIIRS Cloud Type RGB (left) and Cloud Phase RGB (right), 13 May 2018, 12:17 UTC. (Credit to NOAA)
Fig. 4.8 shows FCI images (created from preliminary commissioning data) over the coast of Portugal. We focus on the encircled area. The blue clouds in the Cloud Phase RGB are thick ice clouds, they appear green or yellow in Cloud Type RGB. The Airmass RGB confirms that the encircled clouds are mid-level clouds.
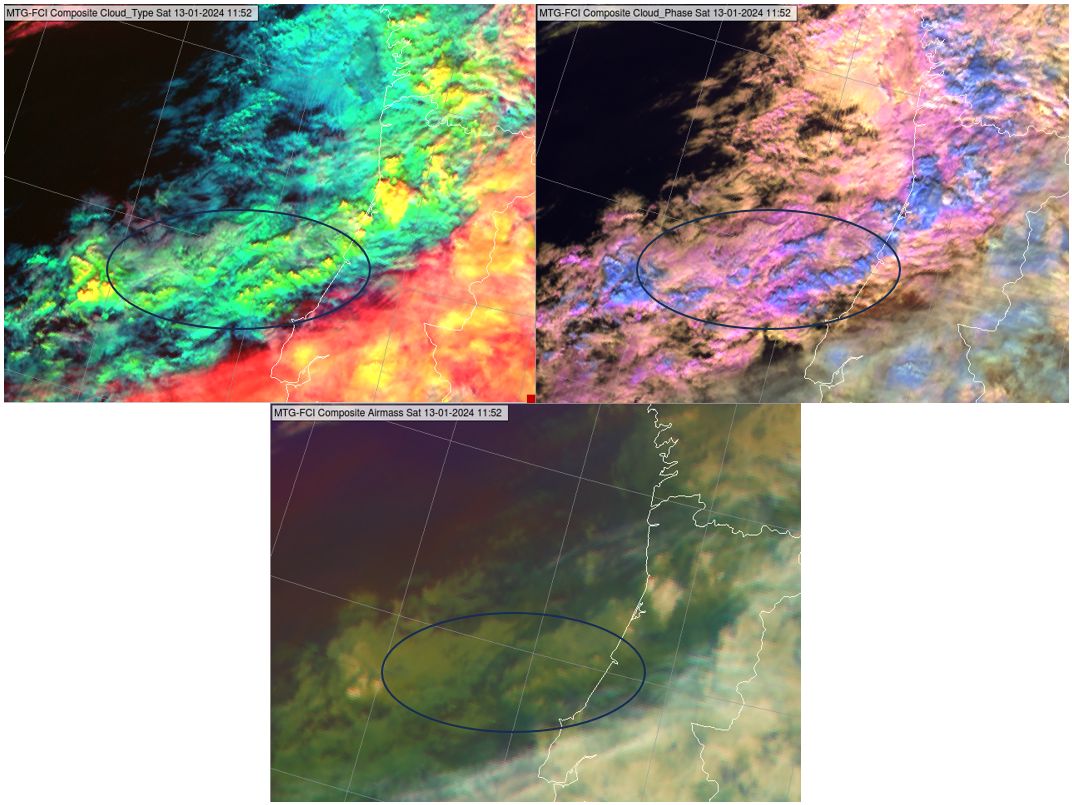
Fig. 4.8: MTG FCI Cloud Type RGB (upper left), Cloud Phase RGB (upper right) and Airmass RGB (bottom), 13 January 2024, 11:50 UTC. Images created from preliminary commissioning data. (Credit to EUMETSAT)
Note that in both the VIIRS and the FCI Cloud Type RGB images, the thick water clouds (appearing greenish cyan in Cloud Type RGB and pink and yellowish in Cloud Phase RGB) have little (or almost no) colour contrast against those mid-level ice clouds that appear green in the Cloud Type RGB. While the Cloud Phase RGB discriminates between thick clouds according to cloud top phase, the Cloud Type RGB rather distinguishes thick mid-level clouds between those with “large” and those with “small” water vapour amount aloft. In other words, it separates thick clouds primarily according to height.
In contrast to green mid-level ice clouds (with large water vapour amount aloft), thick water clouds (with large water vapour amount aloft) appear cyan in the Cloud Type RGB.
Thick low- or mid-level water cloud
Thick low- or mid-level water clouds appear cyan or whitish, depending on the water vapour amount above the cloud tops.
Explanation of the colour:
- The red signal may be weak to strong. It is weak if the water vapour amount above the cloud top is large, and strong if there is not much moisture above the cloud top.
- The green signal is strong as these are thick clouds.
- The blue signal is strong as these are thick water clouds that reflect a lot of radiation in the NIR1.6 region. It is usually somewhat weaker than the reflection in visible range (green signal), except in the case of small cloud top droplets.
Fig. 4.9 shows low water clouds northwest of the Alps appearing bluish/greenish cyan in the FCI Cloud Type RGB.
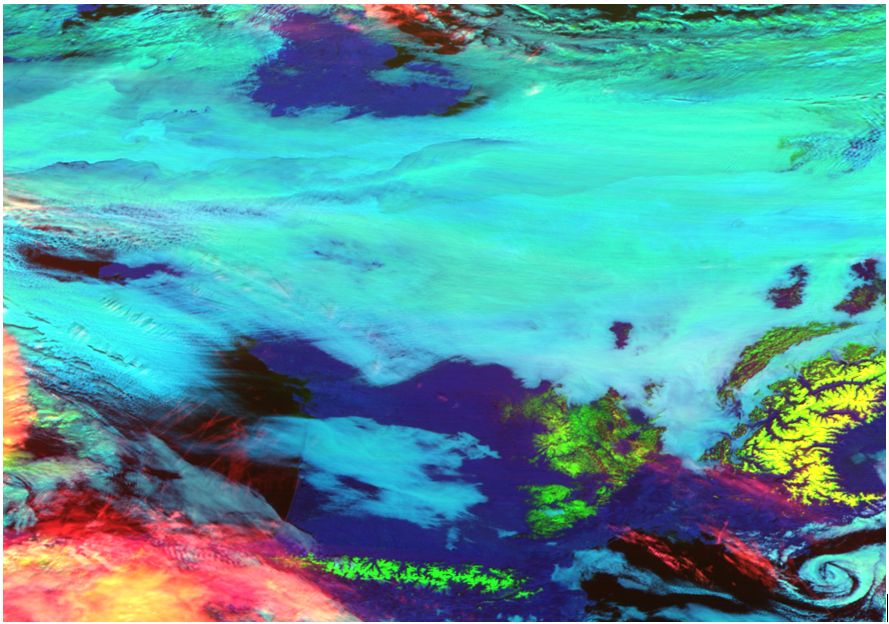
Fig. 4.9: MTG FCI Cloud Type RGB (created from preliminary commissioning data) taken on 13 January 2024 at 11:50 UTC. (Credit to EUMETSAT)
Fig. 4.10 shows that the shade of the cyan colour slightly depends on the cloud top droplet size. The figure shows snowy land and water clouds in Cloud Type and Cloud Phase RGBs. The Cloud Phase RGB is included to identify water clouds with smaller/larger droplets (water clouds with small droplets appear yellowish, while water clouds with large droplets appear pink or magenta in the Cloud Phase RGB.) Water clouds covered by smaller/larger droplets appear bluish/greenish cyan in Cloud Type RGB, see the black/white arrows pointing to the thick parts of the clouds. Note that thin, semi-transparent water clouds may also appear bluish cyan.
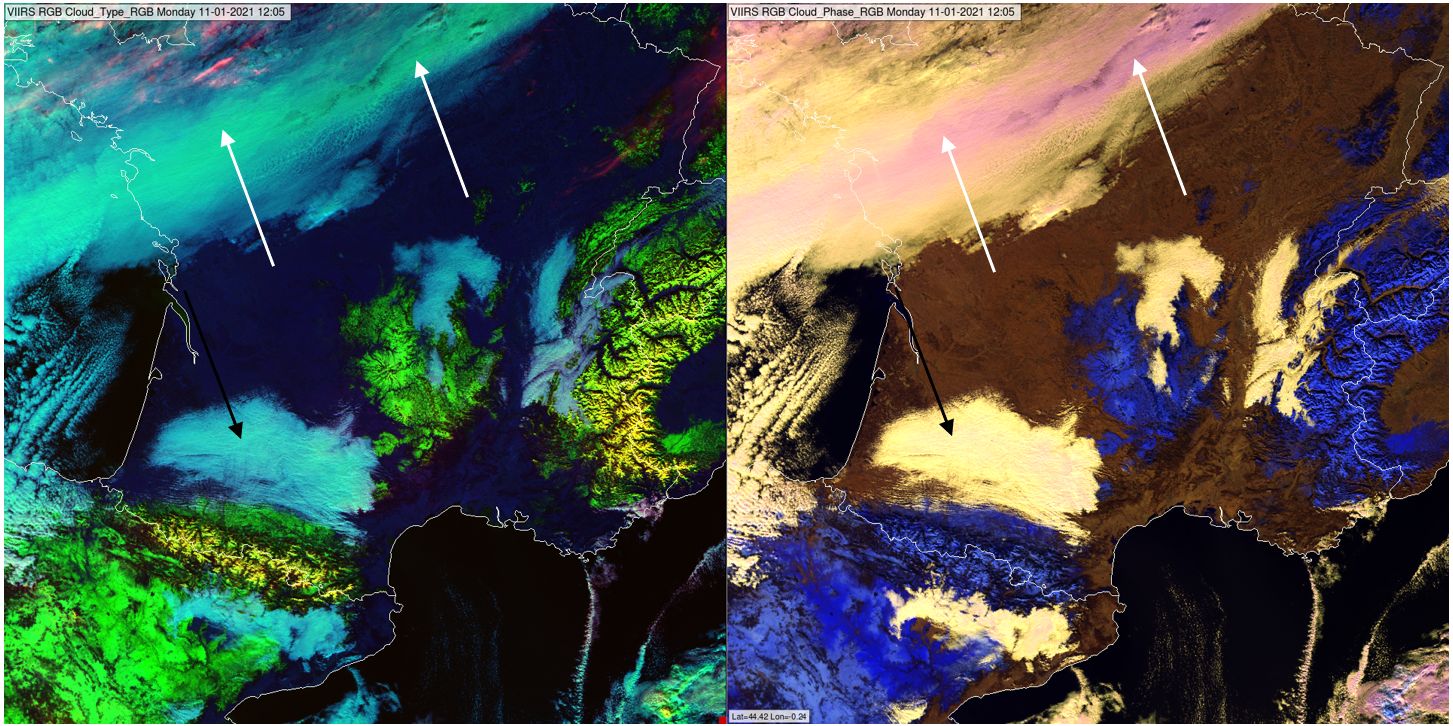
Fig. 4.10: VIIRS Cloud Type RGB (left) and Cloud Phase RGB (right) taken over France and Spain on 11 January 2021 at 12:05 UTC. (Credit to NOAA)
In certain circumstances it happens that not all water clouds appear cyan in the Cloud Type RGB. In some areas, they may appear whitish (thick water clouds) or pinkish (thin water clouds). The water cloud appears cyan if the water vapour amount above the cloud top is large enough and whitish/pinkish if the water vapour amount above the cloud top is small.
Fig. 4.11 shows an example illustrating this; it presents stratocumulus clouds. The inner thick parts of the stratocumulus clouds appear whitish, while the edges of the clouds, the thin parts, appear pinkish in the Cloud Type RGB. The Cloud Phase RGB is also presented to help distinguish the water clouds from ice clouds. The bottom panel shows a radiosonde profile from an area where thick water clouds appear whitish, and one from where they appear cyan. It can be seen that at the former of these the mid-layer was dry.
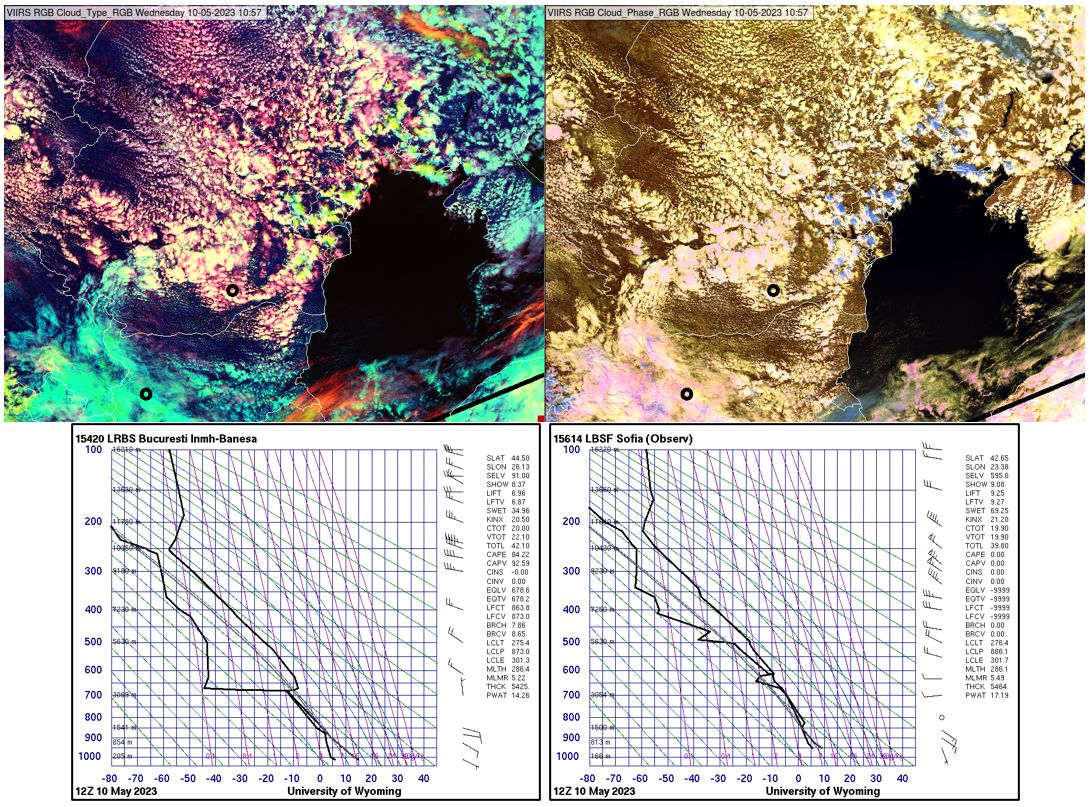
Fig. 4.11: VIIRS Cloud Type and Cloud Phase RGBs, 10 May 2023, 11:57 UTC (top). Radiosonde profiles from Bucharest and Sofia (bottom). The locations of Bucharest and Sofia radiosonde stations are indicated by black rings. (Credit to NOAA and University of Wyoming)
Fig. 4.12 shows an FCI Cloud Type RGB image (created from commissioning data). Over the Balkan Peninsula, some mid/low clouds appear whitish or pinkish instead of cyan (encircled area). These are mid/low clouds according to the NWCSAF Cloud Type product (not shown). The accompanying radiosonde profile from Nis (Serbia) indicates a very dry mid-layer.
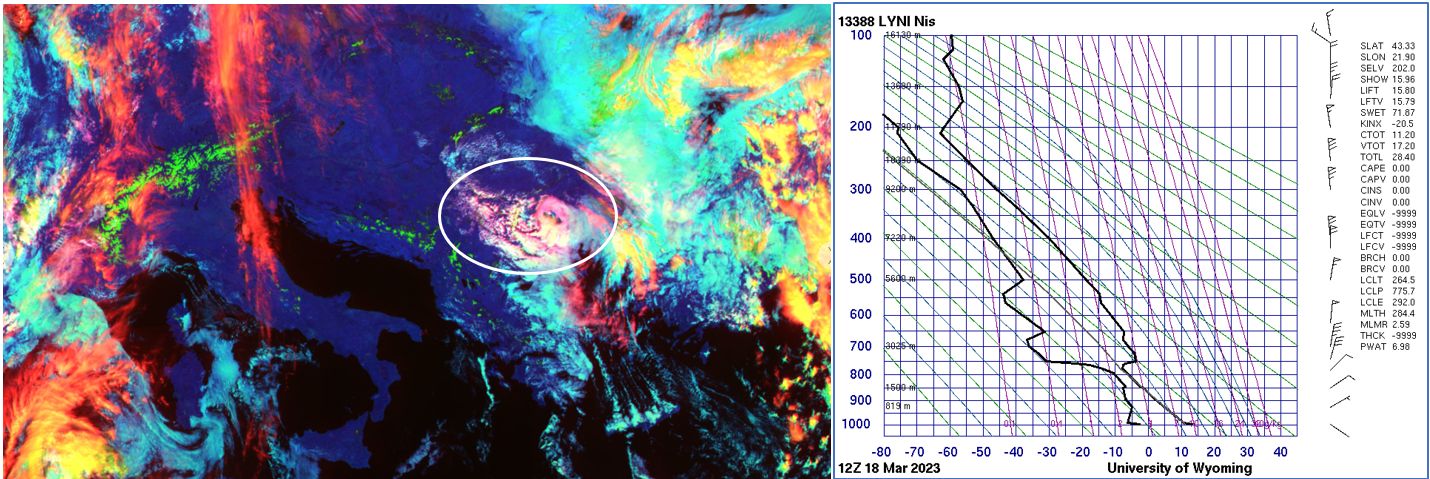
Fig. 4.12: MTG FCI Cloud Type RGB (created from preliminary commissioning data), 18 March 2023 11:50 UTC and 12:00 UTC radiosonde measurement from Nis (Serbia). (Credit to EUMETSAT and University of Wyoming)
Fig. 4.12b shows a case with supercooled water clouds. A vast, mainly thick supercooled water cloud is seen above western Czech Republic (and nearby areas) in whitish, slightly pinkish colours in Cloud Type RGB.
- The Cloud Phase RGB confirms that it is a water cloud.
- The brightness temperature of this cloud is around 246 K (-27 °C) so the cloud is a supercooled water cloud.
- The radiosonde measurement shows that the cloud top pressure is around 450 hPa, and the water vapor amount above the cloud top is low. Consequently, the red component of Cloud Type RGB is strong, resulting in a whitish (slightly pinkish) cloud instead of cyan.
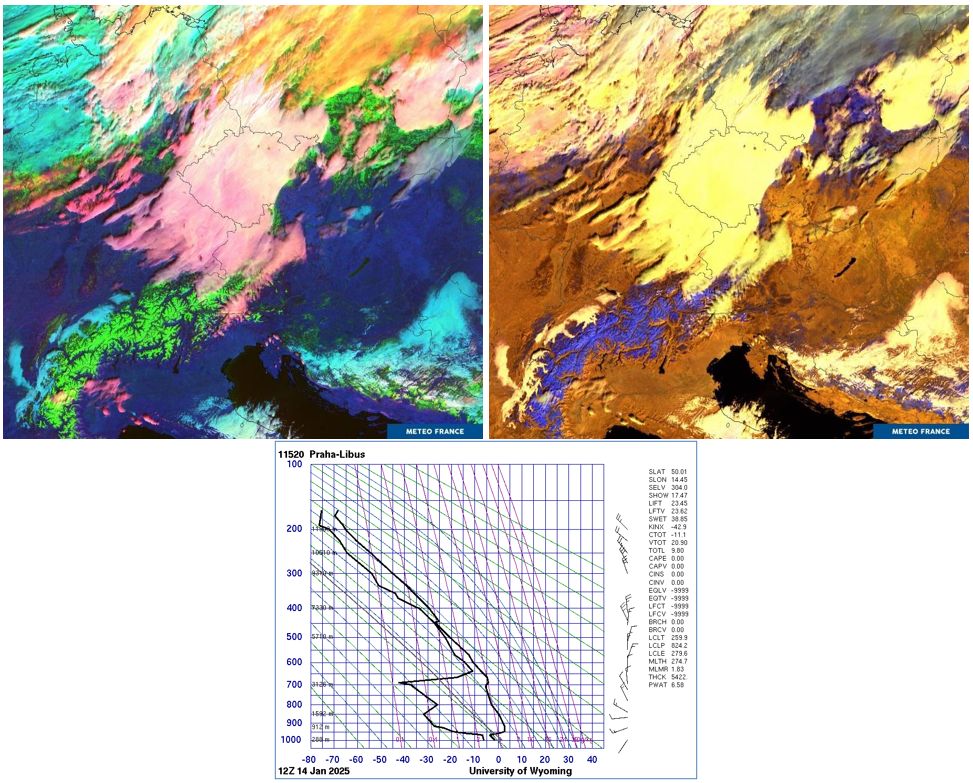
Fig. 4.12b: MTG FCI Cloud Type RGB (upper left), Cloud Phase RGB (upper right), 14 January 2025, 10:20 UTC and 12:00 UTC radiosonde measurements from Praha, Czech Republic (bottom). (Credit to Roxane Désiré, Meteo-France, EUMETSAT and University of Wyoming)
Thin low- or mid-level water cloud
Thin low- or mid-level water clouds may appear cyan or pinkish. They appear pinkish if the water vapour amount above the cloud tops is small. As thin clouds are semi-transparent, their colour shades also depend on the background.
Explanation of the colour:
- The red signal may be weak to strong. Weak if the water vapour amount above the cloud top is large.
- The green signal is weak to medium as these are thin clouds.
- The blue signal is medium to strong as these are thin water clouds
Fig. 4.13 shows thin low-level clouds above ocean and land appearing cyan. The colour shade depends on the cloud characteristics and on the background.
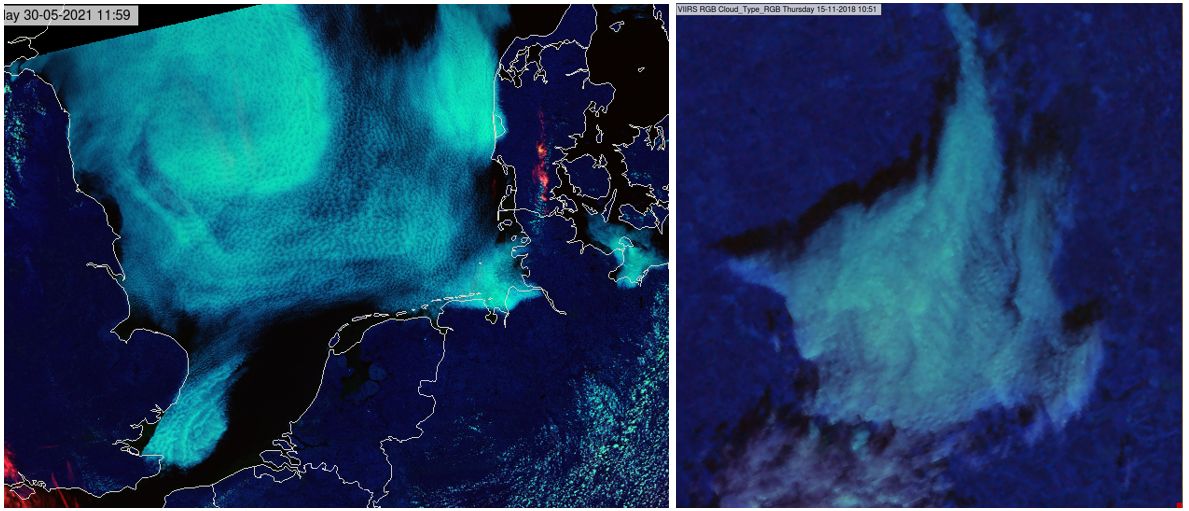
Fig. 4.13: VIIRS Cloud Type RGBs, 30 May 2021, 11:59 UTC (left), 15 November 2018, 10:51 UTC (right). (Credit to NOAA)
A thin low/mid-level water cloud may appear pink if the water vapour amount above its top is small. It can happen that, in the same image, similar clouds appear cyan in some areas and whitish/pinkish in other areas, depending on the atmospheric moisture content above them.
Fig. 4.14 shows an MTG FCI example (created from preliminary commissioning data) where thin water clouds appear pink. Cloud Type, Cloud Phase and Airmass RGBs are presented. The Airmass RGB suggests that the pink clouds indicated by the white arrows in the Cloud Type RGB are mid-level clouds. The WV images (not shown) also confirm that these are mid-level clouds. They are seen in the WV7.3 image, but not seen in the WV6.3 image. The Cloud Phase RGB indicates that they are water clouds. The Natural Colours RGB (not shown) confirms that they are thin clouds. The radiosonde profiles measured in Stuttgart (Germany) and Novara Cameri (Italy) show a dry middle layer. These radiosonde station locations are indicated by black rings.
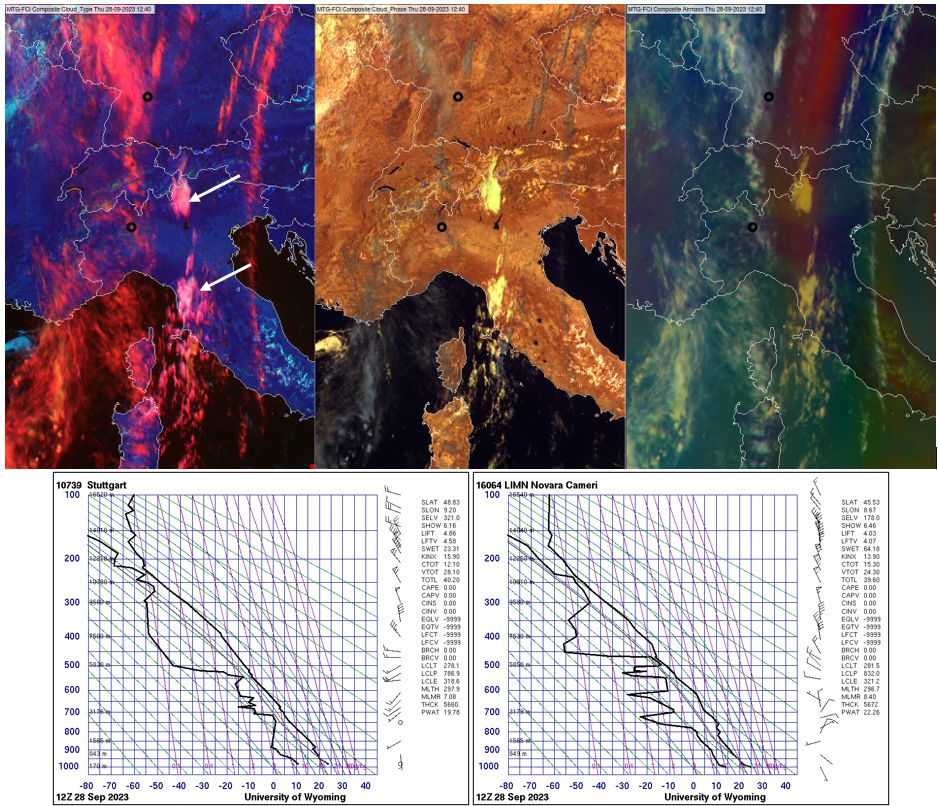
Fig. 4.14: MTG FCI Cloud Type RGB (upper left), Cloud Phase RGB (upper middle panel) and Airmass RGB (upper right) taken on 28 September 2023 at 12:40 UTC. 12:00 UTC radiosonde measurements from Stuttgart (Germany) and Novara Cameri (Italy) (bottom left and right). The locations of the radiosonde stations are indicated by black rings. The FCI images are created from preliminary commissioning data. (Credit to EUMETSAT and University of Wyoming)
Cloud-free areas: snow- and ice-free land, ocean and desert
Vegetated land usually appears dark blue in the Cloud Type RGB. The shade of dark blue depends on the vegetation type, the green vegetation fraction and the soil type. In some cases, the land may have some reddish tones.
Explanation of the colour:
- The red signal is usually very weak as in most cases there is sufficient moisture above the lowlands to absorb most of the radiation in the NIR1.3 region. However, for elevated terrain in a very dry environment there may be an appreciable red signal.
- The green signal is weak as surface albedo is generally low for the VIS0.6 region.
- The blue signal is also weak, but somewhat stronger than the green signal due to the much higher sensitivity of the NIR1.6 channel to vegetation.
Fig. 4.15 shows a typical image of vegetated land.
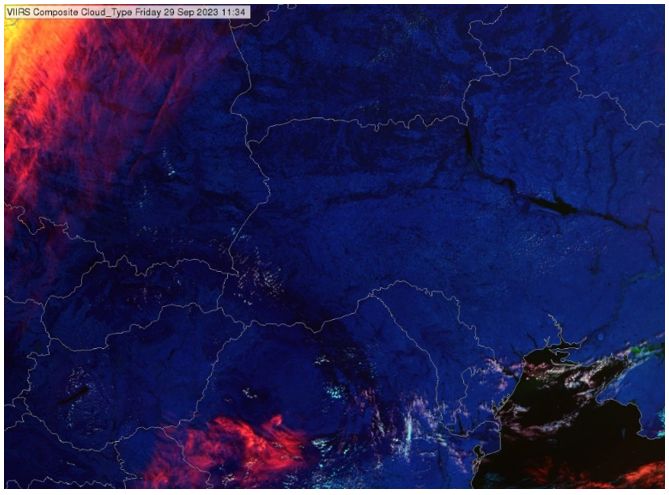
Fig. 4.15: VIIRS Cloud Type RGB, 29 September 2023, 11:34 UTC. (Credit to NOAA)
Above higher terrain, the vertically integrated water vapour amount is usually smaller. For example, the Andes often appear red in the Cloud Type RGB, as they are very high, see Fig. 7.1.
Fig. 4.16 shows a cloud-free case with an extremely dry environment, as shown in the ECMWF Total Column Water Vapour map. The hills around the High Tatra (Slovakia, Poland) appear in dark blue with reddish tones.
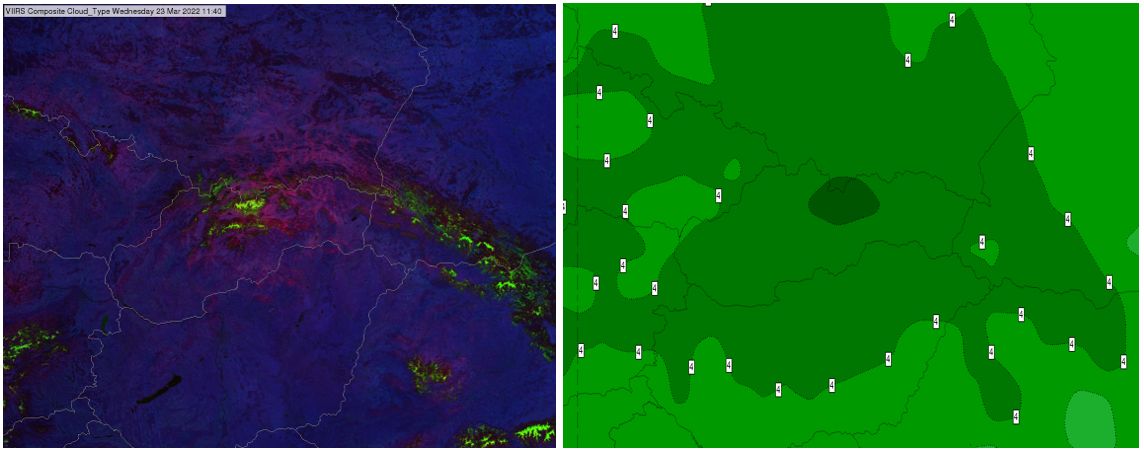
Fig. 4.16: VIIRS Cloud Type RGB, 23 March 2022, 11:34 UTC. ECMWF 12:00 UTC Total Column Water Vapour analysis. (Credit to NOAA and ECMWF)
Open water bodies, such as oceans, seas and large lakes (outside the sunglint region) usually appear black in Cloud Type RGBs, see for example Fig. 4.17.
Sandy desert usually appears medium blue in the Cloud Type RGB, see Fig. 4.17.
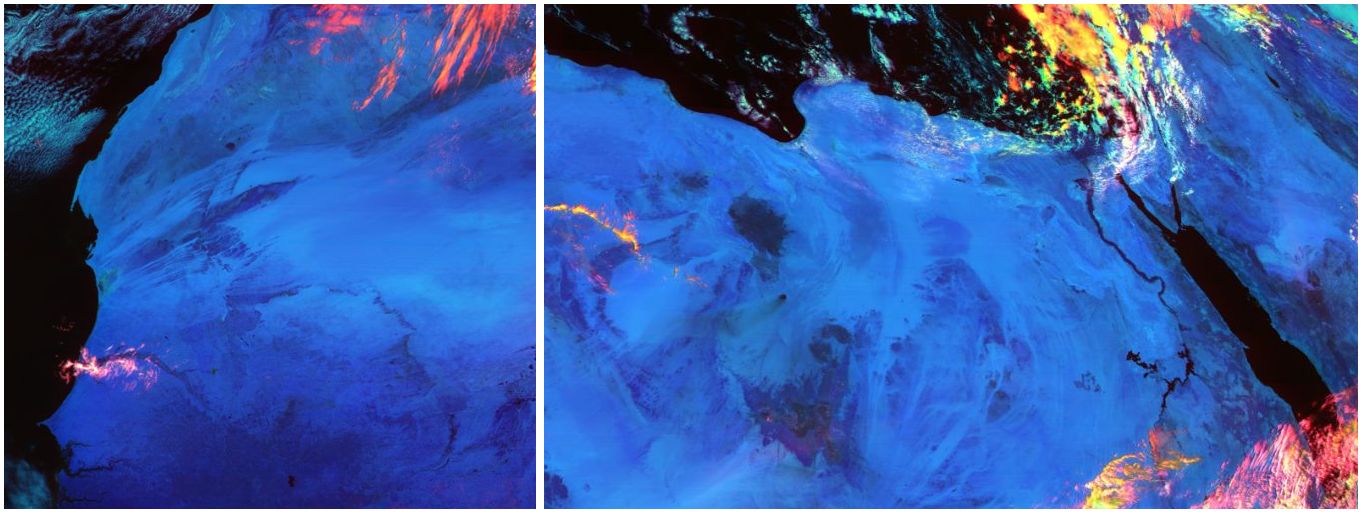
Fig. 4.17: MTG FCI Cloud Type RGBs (created from preliminary commission data), 18 March 2023, 11:50 UTC. (Credit to EUMETSAT)
Cloud-free areas: snow and sea ice
Snow-covered areas usually appear green. However, in elevated terrain they sometimes appear yellow. Sea ice appears green.
Explanation of the colour:
- The red signal is usually weak as in most cases there is sufficient moisture above the surface to absorb the NIR1.3 radiation. However, for elevated terrain in a very dry environment there may be an appreciable red signal.
- The green signal is strong.
- The blue signal is weak.
The left panel of Fig. 4.18 shows sea ice in the Gulf of Finland. The nearby lakes are also frozen (Lake Ladoga, Peipus). The surrounding forests are snowy. The right panel shows snow-covered Alps.
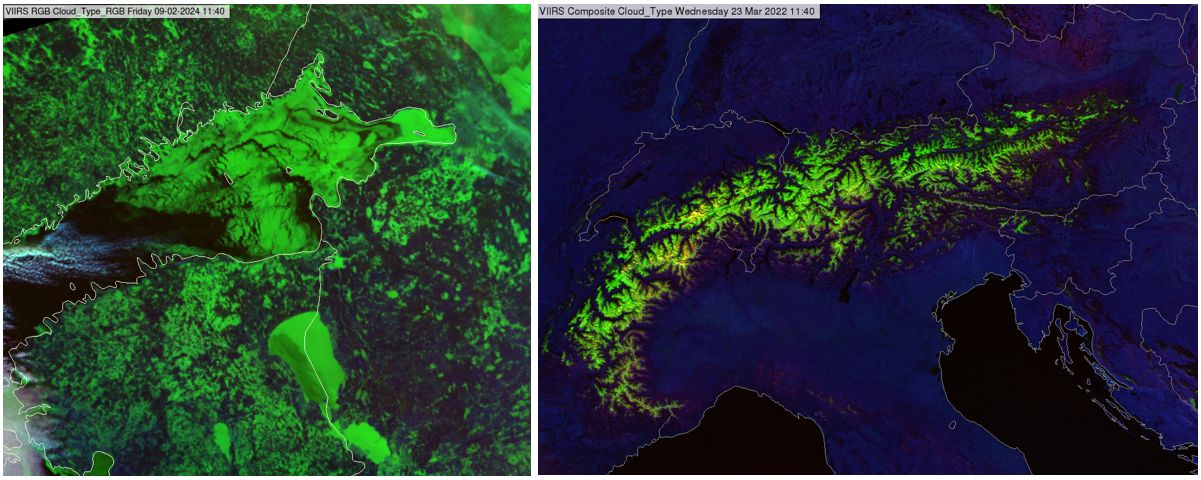
Fig. 4.18: Sea ice in VIIRS Cloud Type RGB, 09 February 2024, 11:40 UTC (left) and snow-covered Alps VIIRS Cloud Type RGB, 23 March 2022, 11:40 UTC (right). (Credit to NOAA)
The left panel of Fig. 4.19 shows an example where the snow does not only appear green. Snow over the western Alps appears mostly yellow, while over the eastern Alps it appears green. The vertically integrated water vapour amount was small. It was even smaller in the western Alps than in the eastern Alps: see the 12:00 UTC ECMWF Total Column Water Vapour map in the right panel.
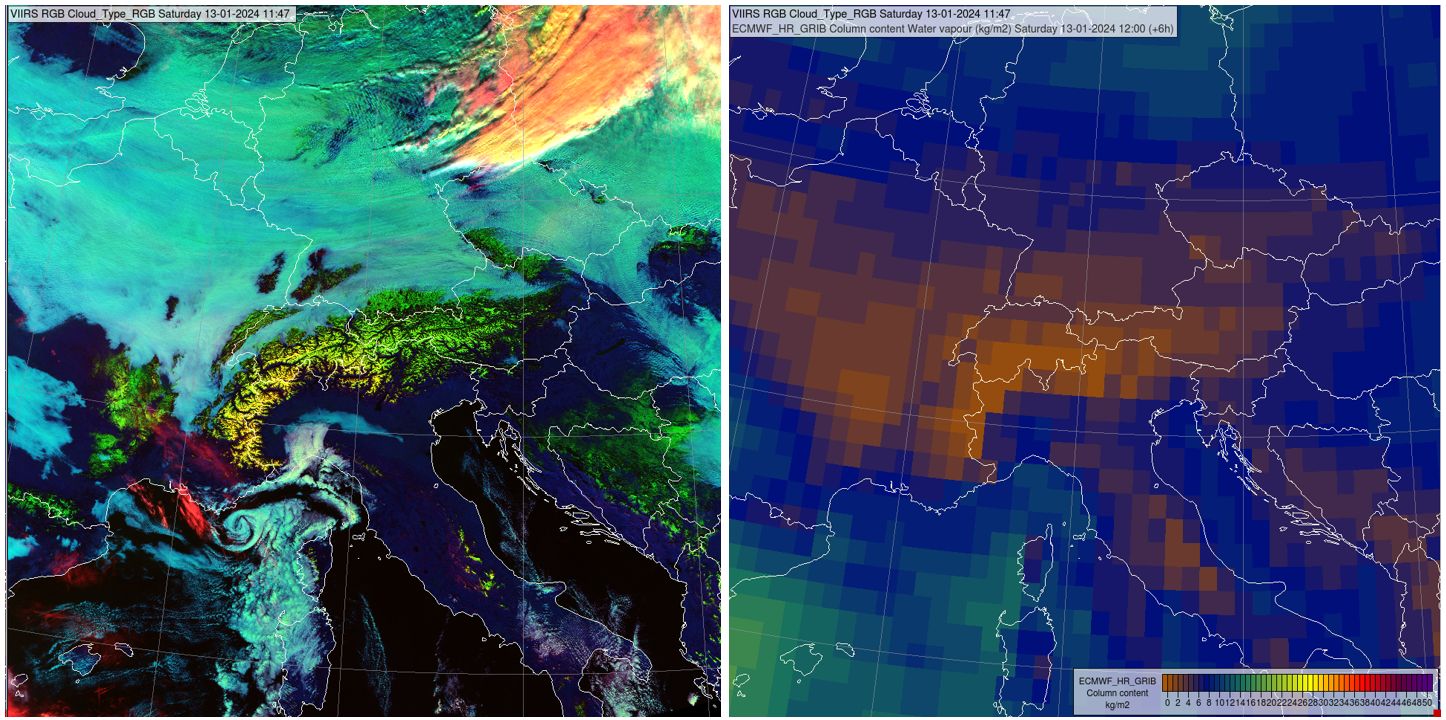
Fig. 4.19: VIIRS Cloud Type RGB, 13 January 2024, 12:37 UTC (left) and ECMWF Total Column Water Vapour (right). (Credit to NOAA and ECMWF)
Aerosol plumes
With the Cloud Type RGB, high-level aerosol plumes can be detected; they are usually rather thin. Low-level aerosol plumes can be detected only if they are sufficiently dense and mainly above dark backgrounds. Low and higher-level aerosol plumes appear in different colours: sufficiently dense low-level aerosol plumes usually appear greyish cyan, while higher-level aerosol plumes appear reddish/pinkish, if they are recognizable.
Aerosol plumes appear with different structures from those of ice and water clouds. They are smooth, blurred and have washed out colours.
An example of a dense low-level dust plume is seen in the left panel of Fig. 4.20 in dark greyish cyan shades. Enough thick low-level dust can be seen in the VIS0.6 and NIR1.6 channels above the dark background due to the increased scattering, but not in NIR1.3 as there is too much moisture aloft. It therefore appears in cyan shades. For comparison, the Dust RGB is shown (right panel): this is the primary RGB for dust detection. Dust appears pink in the Dust RGB.
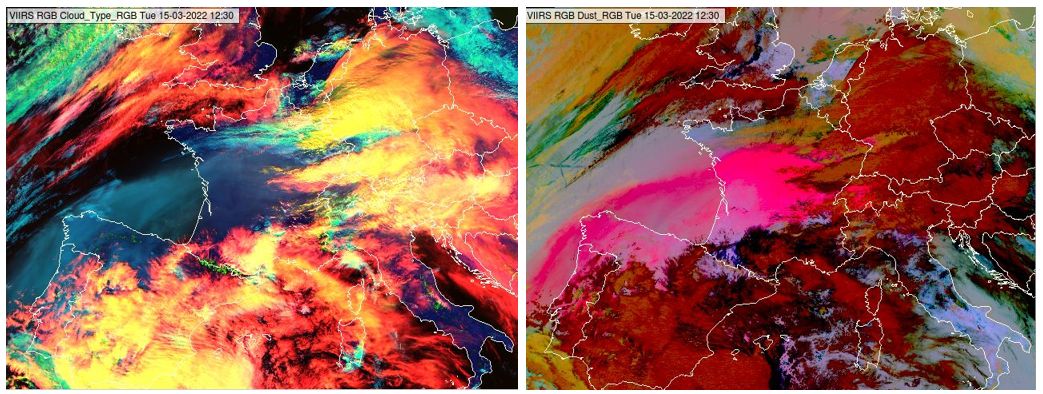
Fig. 4.20: VIIRS Cloud Type RGB (left) and Dust RGB (right) taken on 15 March 2022 at 12:30 UTC. (Credit to NOAA)
Fig. 4.21 shows a dust event above central USA. The strong wind of a cyclone picked up dense dust clouds from the ground. The upper right panel shows the Dust RGB, indicating dust clouds in pink and strong magenta colours. The upper left panel shows the Cloud Type RGB. Some “arms” of the dust cloud appear pink (indicated by white arrows), while other “arms” (indicated by black arrows) are only slightly recognizable, and they appear in faint greyish blue shades. The dust cloud is also shown in the Airmass RGB (bottom). This suggests that some of the dust cloud reached the middle layers. From this it can be inferred that low-level dust appears greyish blue and mid-level dust appears pink in this Cloud Type RGB image. Note that some thin clouds also appear pink in the Cloud Type RGB. Not every pink object indicates dust (e.g., the wave clouds west of the dust outbreak marked by yellow arrows).
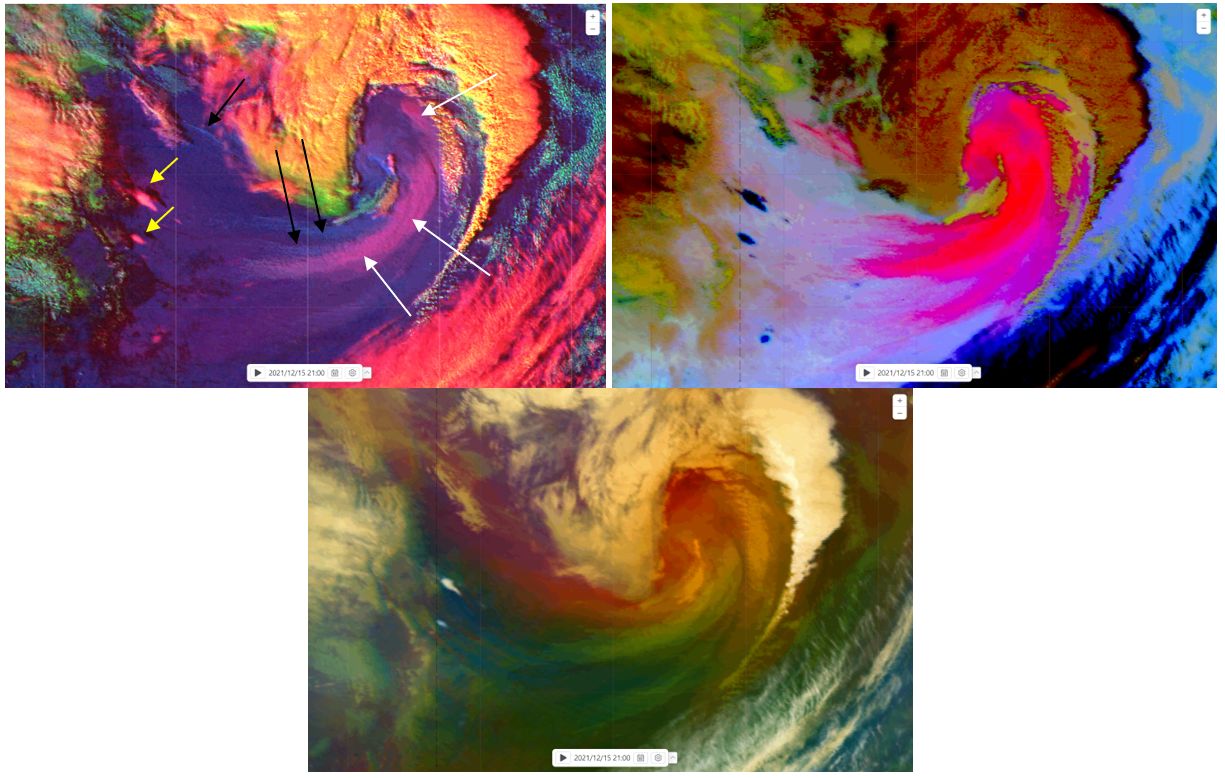
Fig. 4.21: GOES East ABI Cloud Type RGB (upper left), Dust RGB (upper right) and Airmass RGB (bottom) taken on 15 December 2021 at 21:00 UTC. White arrows indicate mid-level dust plumes, while black arrows indicate low-level dust plumes. Yellow arrows indicate high-level lee clouds. (Credit to NOAA)
You can read a study about this case here.
Image interpretation example
To provide an overview of the typical colours for different phenomena, two cases are shown with annotations to demonstrate the interpretation of different surface and cloud types in Cloud Type RGB images (Figs. 4.22 and 4.23).
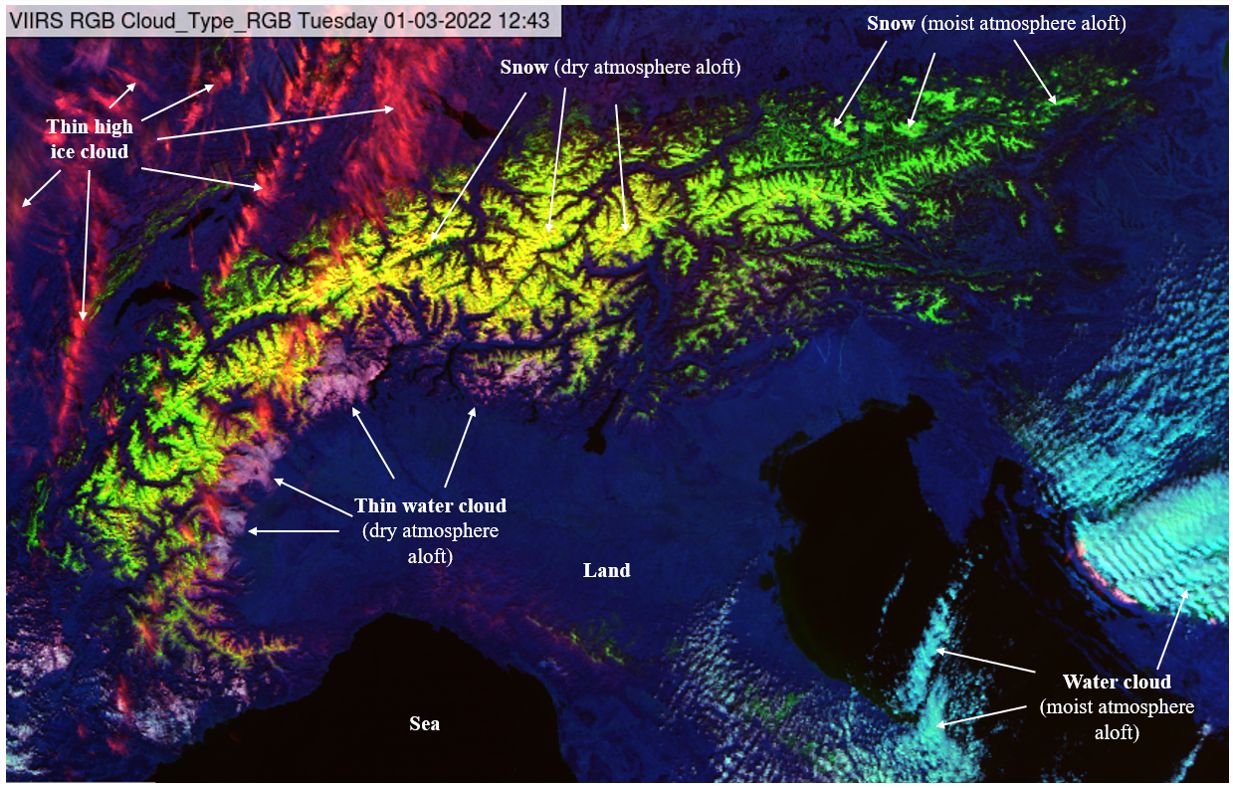
Fig. 4.22: VIIRS Cloud Type RGB with interpretation, 01 March 2022, 12:43 UTC. (Credit to NOAA)
In the case shown in Fig. 4.23, the vertically integrated atmospheric water vapour amount above the surface and the mid/low cloud tops was large.
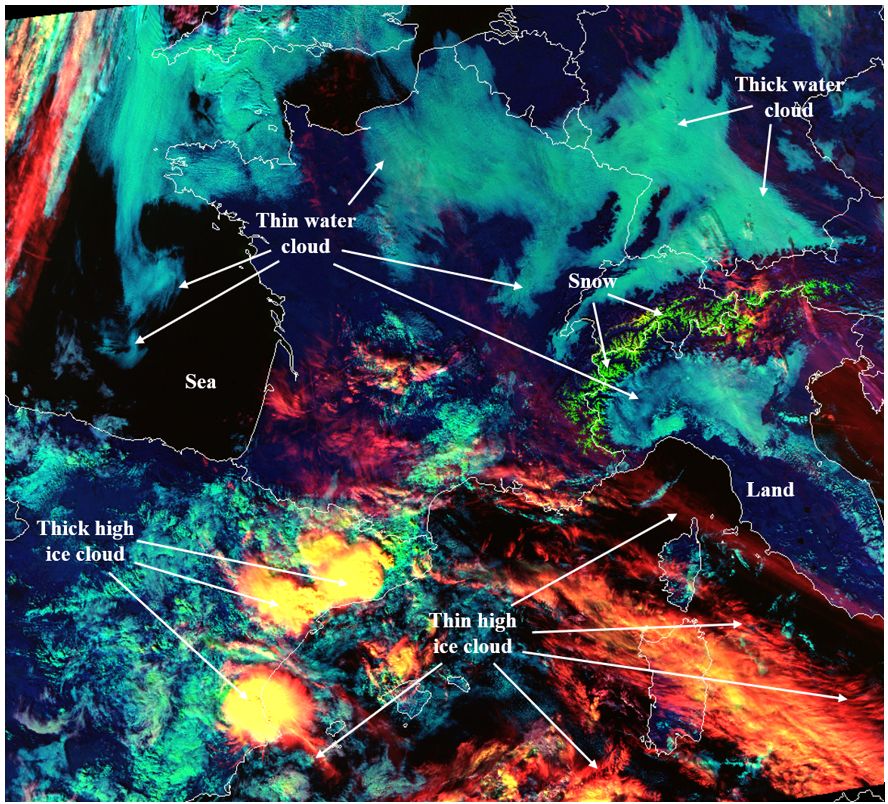
Fig. 4.23: VIIRS Cloud Type RGB with interpretation, 15 November 2018, 12:31 UTC. (Credit to NOAA)