Physical background
The physical characteristics of the channels used in the Cloud Type RGB (see Table 2.1) are discussed in this chapter.
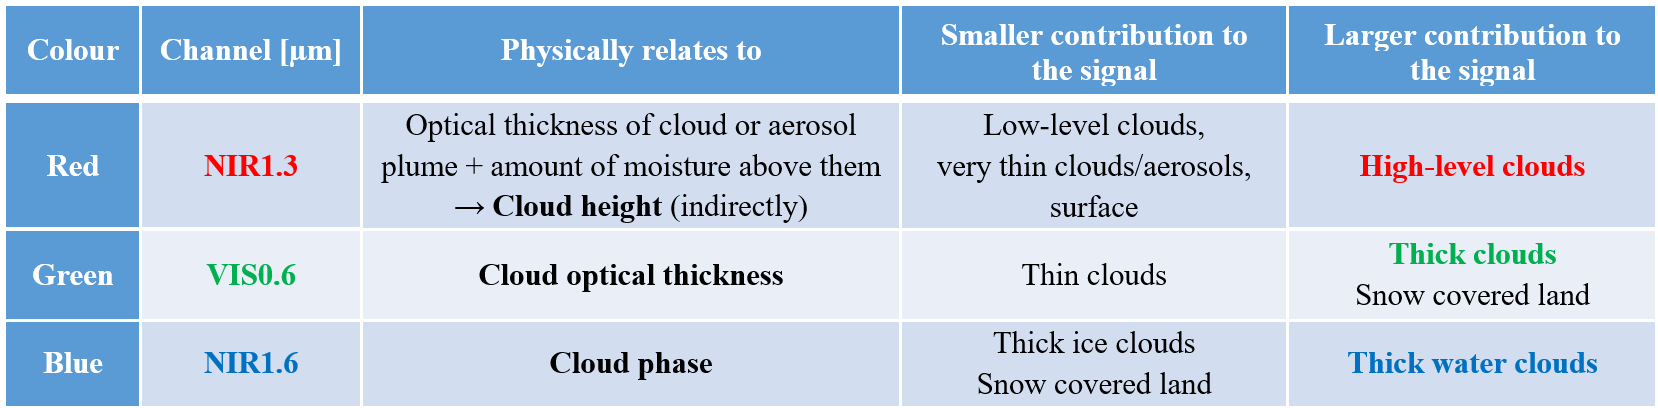
Table 2.1: Channels used in the Cloud Type RGB
Characteristics of the NIR1.3 channel
NIR1.3 is a solar channel that is new with FCI. In this channel the water vapour absorption is strong, see Fig.2.1. This is the first time that a European geostationary meteorological satellite is measuring within a strong water vapour absorption band in the solar spectrum.
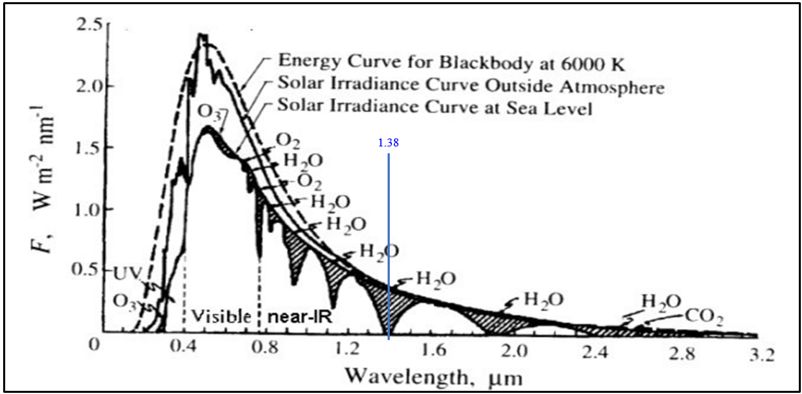
Fig. 2.1: Solar spectral irradiance at the top of atmosphere and at the surface
Motivation
The main reason this channel is included in FCI is to improve the detection efficiency of very thin cirrus clouds. (Undetected thin cirrus clouds cause several problems, e.g., incorrect surface parameter retrievals due to the incorrect cloud mask.)
Detection of very thin cirrus clouds is difficult as they usually produce weak signals. Their detection with SEVIRI data is mainly based on infrared data. For visual detection, Dust, 24h Microphysics and Night Microphysics RGBs provide useful information. The FCI NIR1.3 channel measurement was implemented to complement the infrared-based detection method with a different technique based on measurements in the solar spectrum.
The NIR1.3 channel also helps to detect higher-level thin aerosol plumes.
How can the NIR1.3 measurements help to detect very thin cirrus clouds?
In this channel the background is often dark (see the reason below). The very thin cirrus clouds produce only weak signals at solar wavelengths, and usually it is difficult to identify and separate them from underlying clouds or surface. However, above dark backgrounds we can visualize them simply by applying a strong enhancement.
Description of the NIR1.3 radiation processes
The satellite measures reflected solar radiation in the NIR1.3 channel. The radiation is scattered and absorbed along its path. In this spectral range absorption is the dominant effect. For simplicity we will neglect scattering by atmospheric gases. Fig. 2.2 illustrates the path of NIR1.3 radiation from the Sun to the satellite (for an opaque reflecting object and a dark background):
- The incoming radiation is attenuated by water vapour (WV) molecules in the atmosphere along the (slant) path from the Sun to the reflecting object (cloud/aerosol plume/surface). Attenuation depends on the WV amount above the object and the solar zenith angle.
- The part of the incoming solar radiation that has not been absorbed is reflected by the object.
- The reflected radiation is again attenuated due to the WV absorption along the (slant) path from the object to the satellite. This absorption depends on the WV amount above the object and the satellite viewing zenith angle.
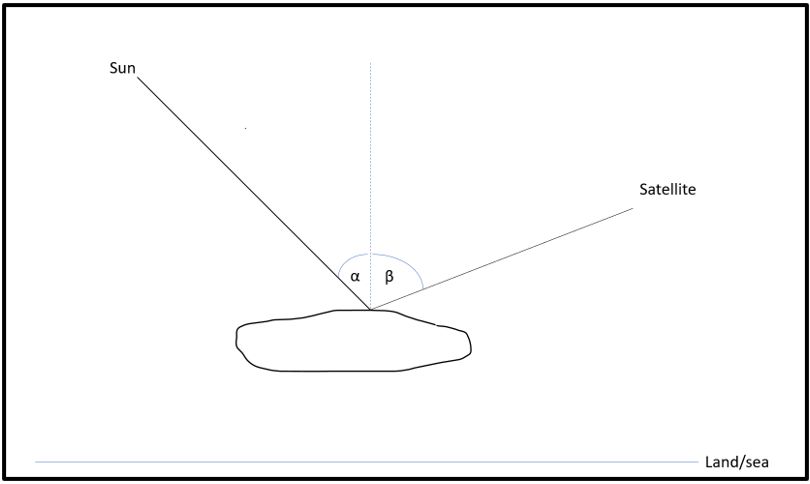
Fig. 2.2: Path of the NIR1.3 radiation originating from the Sun, reflected by an object and reaching the satellite
Fig. 2.3 explains how strong the 1.3 µm radiation measured by a satellite will be for a hypothetical moisture profile. The figure shows the water vapour profile the left. Most of the moisture is in the lowest layers (as in a standard troposphere). The moisture amount is somewhat smaller in the middle layers, and very small in the highest layers.
Panel A: There is a cloud within the lowest layer. The water vapour amount is large above its top. Because of the strong absorption, this cloud is not seen in the resulting NIR1.3 image. All the 1.3 µm radiation is absorbed before it reaches the satellite and this region of image will appear dark.
Panel B: The towering cumulus has grown into the middle layers. The moisture amount above its top is neither large nor small. This cloud will be seen in the NIR1.3 image, but the signal will be weak.
Panel C: The cloud has grown into the highest layers. The moisture amount above its top is small. It will be clearly seen in the NIR1.3 image.
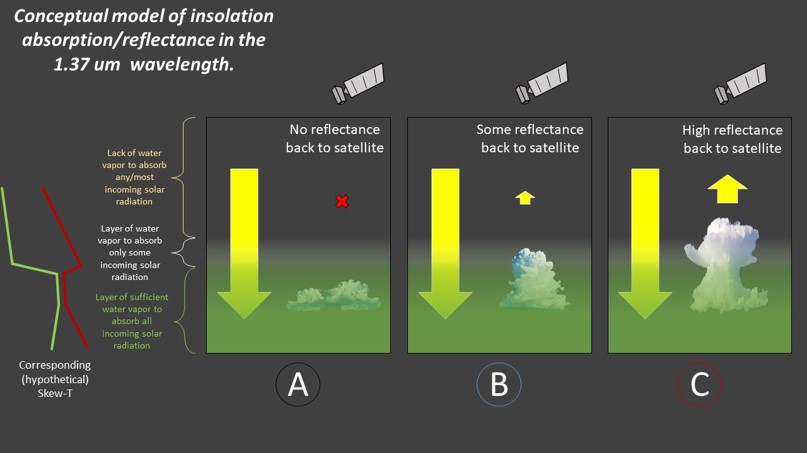
Fig. 2.3: Conceptual model illustrating the strength of the satellite-measured 1.3 µm radiation for a hypothetical moisture profile.
Note that the amount and vertical distribution of the moisture can be different in reality, leading to different NIR1.3 signals (for the same cloud and viewing geometry).
Summarizing:
- Due to the strong WV absorption, the satellite sensor does not usually detect the low altitude surface and lower-level clouds, if the atmosphere is sufficiently moist.
- As the signal depends on the amount of moisture above the cloud top, the measured radiation depends on the cloud top height indirectly.
- The height below which a potential cloud top is NOT seen by this channel depends on (among others) the water vapour amount and distribution. Therefore, this “dark background height limit” varies spatially and temporally.
Going back to the detection of the very thin cirrus clouds: low clouds and low altitude surfaces are usually not seen in the IR1.3 image due to the strong absorption at that wavelength. These areas are black in the NIR1.3 image (panel A case). Very thin cirrus clouds above such an area, though having weak signals, can be seen with a strong image enhancement.
Note that the strongly enhanced NIR1.3 image can also be used for monitoring high-level aerosol plumes.
Fig. 2.4 shows an example: a VIIRS NIR1.38 image together with the “traditional” visible and infrared images, VIS0.6 and IR10.8. NIR1.38 is enhanced in the 0-30% reflectivity range, VIS0.67 is displayed in the 0-100% reflectivity range and IR10.8 is displayed in the -50 to +15 °C brightness temperature range. Low clouds and surface features seen in the IR10.8 and VIS0.6 images are not present in the NIR1.38 image.
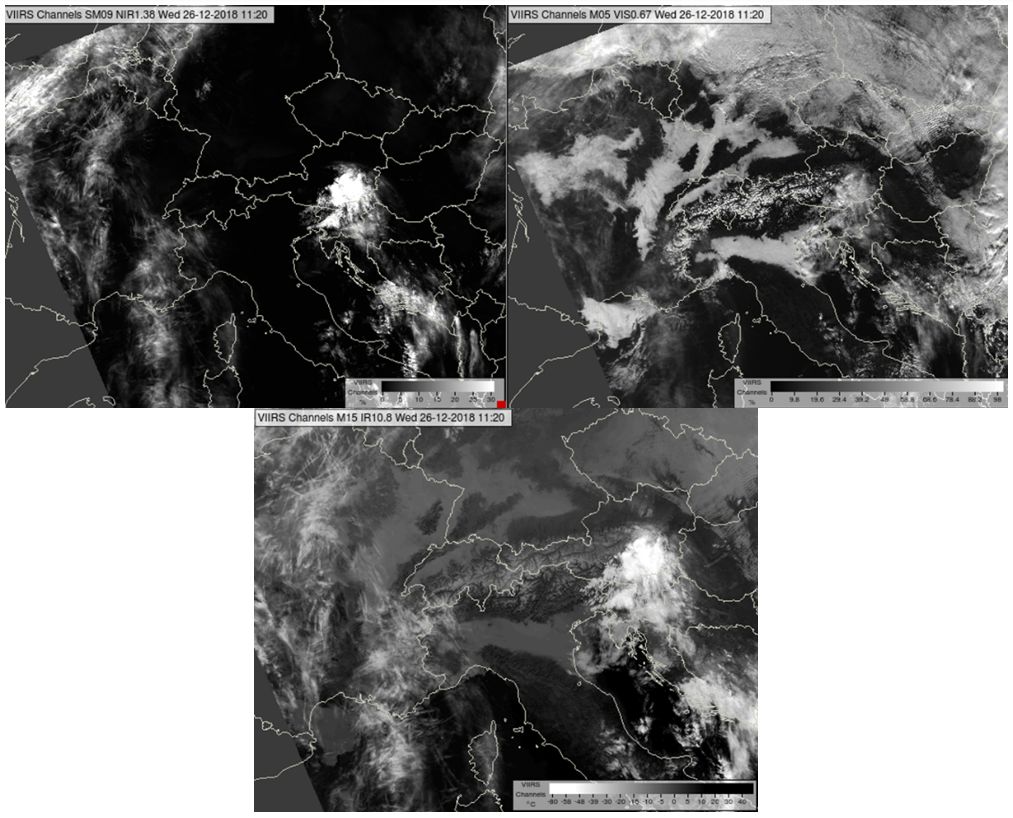
Fig. 2.4: VIIRS images taken on 26 December 2018, at 11:20 UTC: NIR1.38 (upper left), VIS0.67 (upper right) and IR10.8 (bottom). The images are enhanced in the (0-30%), (0-100%) and (-50 to +15 °C) ranges, respectively. (Credit to NOAA)
As the aim is to see even the weakest signals, the NIR1.3 image is often strongly enhanced. With increasing enhancement, we see more and more of these weak signals, e.g., from high-level very thin cirrus clouds or high-level aerosol plumes, and sometimes lower-level features as well. Due to the strong enhancement, thicker high clouds usually oversaturate. Fig. 2.5 shows an example.
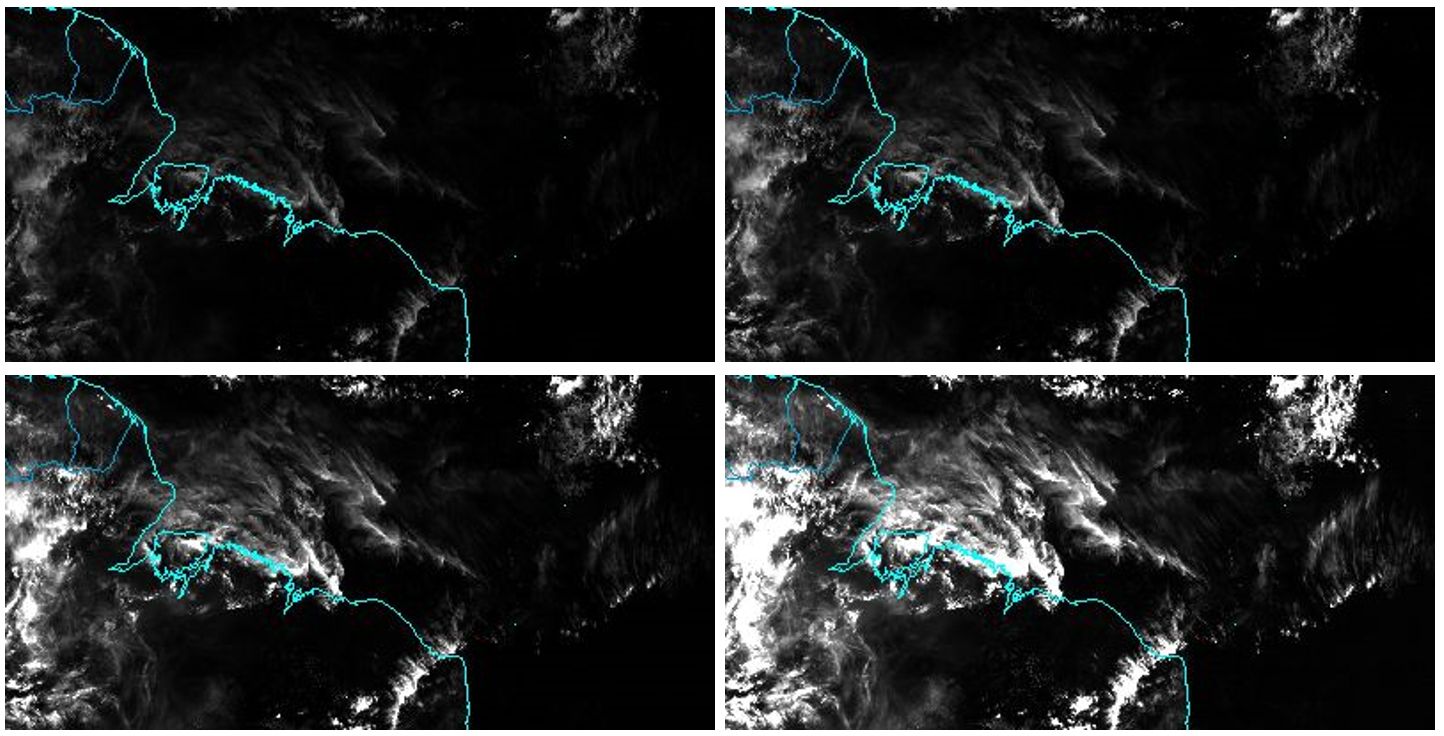
Fig. 2.5: ABI NIR1.37 image enhanced linearly in the 0-60% (upper left), 0-40% (upper right), 0-20% (bottom left) and 0-10% (bottom right) reflectivity ranges. (Credit to NOAA)
In the case of a dry atmosphere, it happens that NIR1.3 sees not only high-level phenomena, but also mid-level clouds, high mountains and sometimes even low clouds and hills. Fig. 2.6 shows an example, where in the strongly enhanced NIR1.3 image one can see maritime stratocumulus clouds in a band extending west from South America.
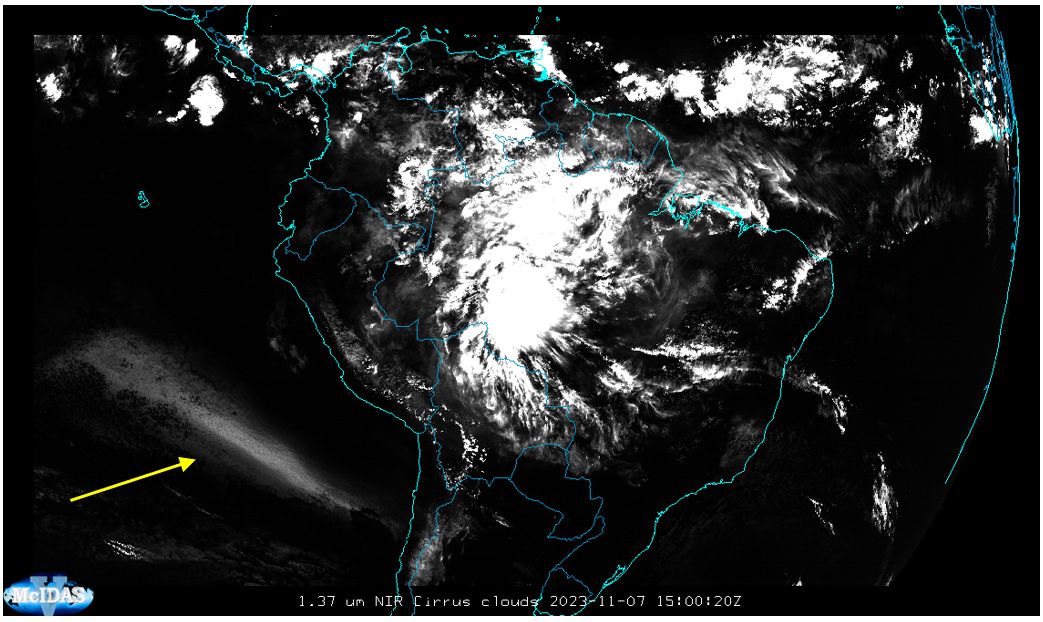
Fig. 2.6: ABI NIR1.37 image enhanced linearly in the 0-10% reflectivity range with a gamma correction (Gamma = 1.5). (Credit to NOAA)
Characteristics of the VIS0.6 channel
This channel is used to determine the optical thickness of clouds. Thick clouds (regardless of their phase) have high reflectivity and appear bright. Thin clouds have lower reflectivity and appear greyish. VIS0.6 also provides information about surface snow and sea ice. Snow and ice are usually bright in a VIS0.6 image.
Characteristics of the NIR1.6 channel
The NIR1.6 channel is sensitive to the cloud top phase: usually it distinguishes ice and water clouds well. At 1.6 µm, snow and ice clouds usually have low reflectivity, while water clouds strongly reflect the incoming shortwave radiation. Additionally, this channel has a weak dependence on cloud top particle size. Cloud reflectivity slightly increases if the clouds are covered by smaller particles. Ice clouds with very small ice crystals may therefore be confused with water clouds with very large droplets.