2.2 The Airmass RGB
Figure 14: Meteosat-10 Airmass RGB, Calbuco eruption between 23 April 00:00 UTC and 27 April 06:00 UTC. © EUMETSAT
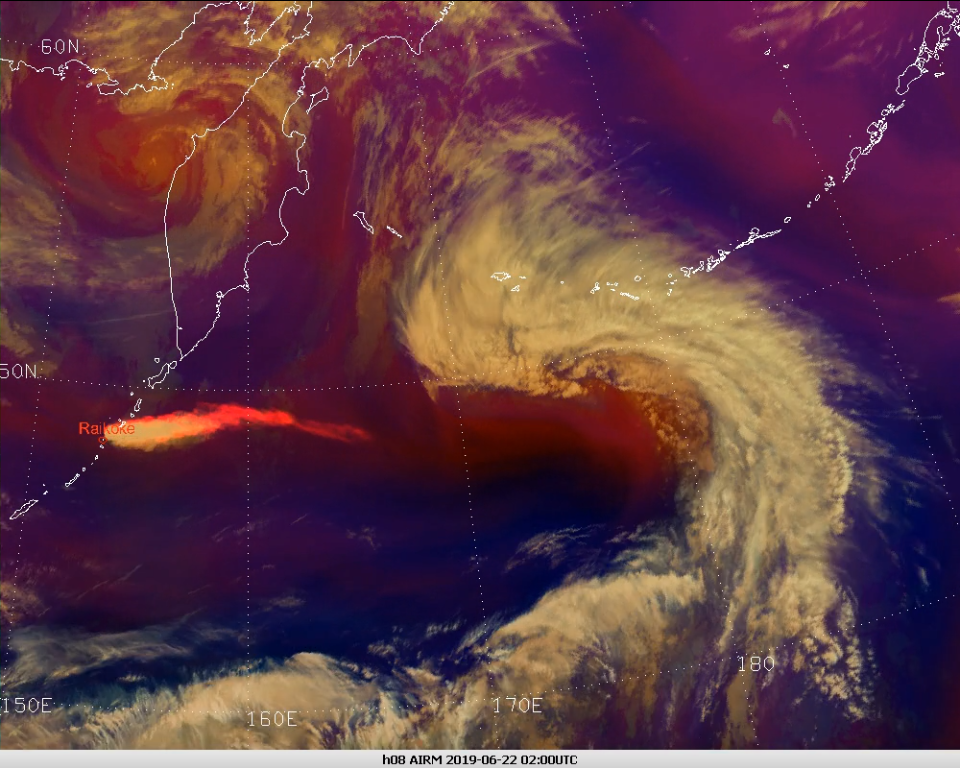
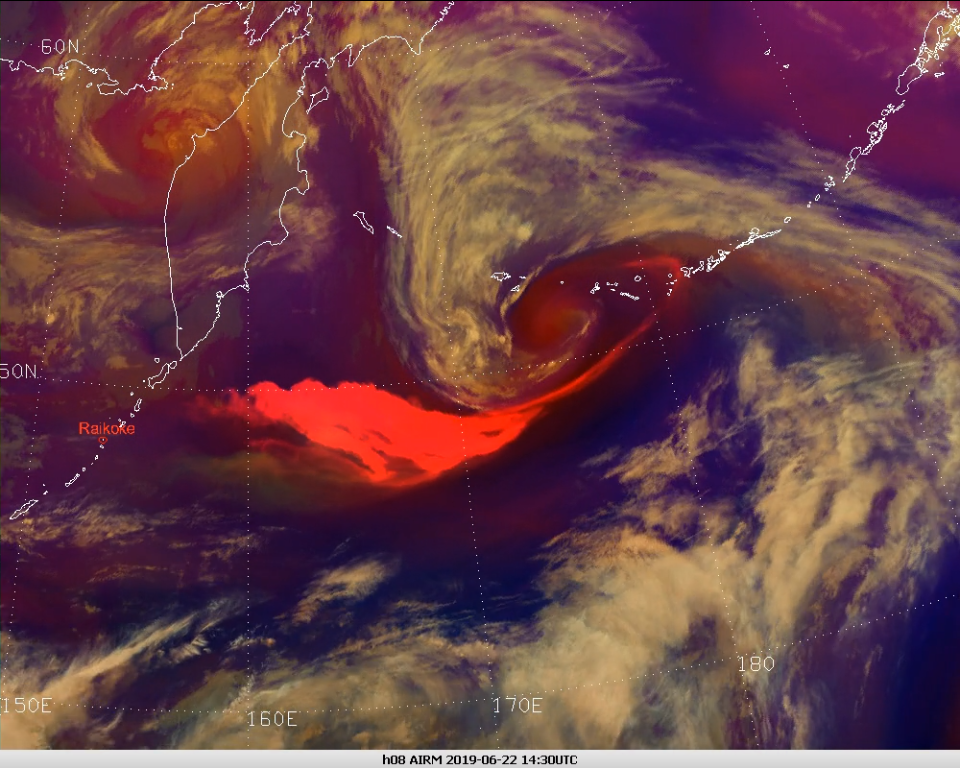
Although not designed for SO2 monitoring, the Airmass RGB can exploit the strong SO2 absorption band at around 7.3 µm (SEVIRI WV7.3 channel), and as long as the SO2 plume is higher than 3 km it detects high SO2 concentrations fairly well. The cooling effect of the SO2 cloud on the WV7.3 channel (Table 3) leads to small a BTD between the WV6.2 and WV7.3 channels, which is seen in the red component of the Airmass RGB. Thus, mid/high-level SO2 clouds from volcanic eruptions appear red to orange in this RGB composite.
Volcanic ash particles on the other side tend to reduce the BTD [IR9.7 - IR10.8] as it cools the IR10.8 window channel down to values similar to the Ozone absorbing channel IR9.7. Pure ash clouds usually appear pale green in the Airmass RGB. However, in a warm air mass, pure ash clouds are difficult to see in the Airmass RGB because the background has the same color tone. Note that the red and the green color have the opposite meaning in the Airmass RGB when compared to the Volcanic Ash RGB.
Table 3: Temperature thresholds used for the SEVIRI channels of the Airmass RGB
In case SO2 and ash are mixed in the same cloud, colors can vary from magenta (less ash) to yellow (more ash), depending on the ratio. Usually, the mixed form of ash and sulphur clouds is found close to the volcano. As the ash particles tend to deposit over time, the mixed cloud becomes a SO2 cloud, which is often seen travelling long distances. This means that mixed clouds undergo a color transformation from yellow (higher ash concentration) to magenta and red (all ash has deposited). Additionally, the SO2 signal becomes stronger in the Airmass RGB with increasing viewing angle (i.e., at the limb of the image).
|
|
Figure 15: Himawari- 8 Airmass RGBs, 22 June 2019 at 02:00 and 14:30 UTC, eruption of Mount Raikoke. Use the slider to compare both images.
Figure 16: Himawari- 8 Airmass RGBs, 22 June 2019 at 06:00 UTC, eruption of Mount Raikoke
More about the Airmass RGB:
- Quick Guide
- CAL module on the Volcanic Ash RGB
Quiz
Mount Nyamuragira erupted in November 2006. On 29 November, a large ash/SO2 plume could be observed in the Airmass RGB.
Which constituent of the volcanic plume is visible in this Airmass RGB image?


