Theoretical background
The reflectivity of a snow-covered area, as measured by satellites, depends on:
- the wavelength of the radiation,
- the physical properties of the snow (mean grain size, fresh or old, clean or dirty, melting or not, whether it melted earlier and after that refroze, etc.),
- whether the snow is continuous within the pixel or not (reasons for discontinuities in the snow include the clearing of snow from roads, unfrozen lakes and rivers, branches over snow, shadows, partly melted snow and snow patches),
- the solar and satellite zenith angles and the relative azimuth angle,
- the surface topography (in mountain/hill areas the reflectivity also depends on the slope angle and orientation).
Cloud Phase RGB
The Cloud Phase RGB was developed by Jochen Kerkmann (EUMETSAT). Table 1 summarizes how to create the Cloud Phase RGB (Kerkmann, 2018; Putsay, 2021). The table lists the channels used in the red, green and blue primary colour beams and how these channels are enhanced: linear stretching in the indicated ranges without gamma correction.
| Colour beam | Channel | Range | Gamma |
|---|---|---|---|
| Red | NIR 1.61 | 0 - 50 % | 1 |
| Green | NIR 2.25 | 0 - 50 % | 1 |
| Blue | VIS 0.67 | 0 - 100 % | 1 |
Table 1: Cloud Phase RGB recipe.
We first briefly summarize how the radiation is reflected by snowy areas at these wavelengths.
Absorption of ice at 0.67, 1.6 and 2.25 μm
Snow consists of ice crystals. Figure 2 shows the absorption of ice and water: the imaginary part of the refractive index is proportional to the absorption of a material. Note that the refractive index is visualized on a logarithmic scale.
- At 0.67 μm the absorption by ice is negligible, so snow appears bright in VIS0.67 images.
- At 1.61 and 2.25 μm the absorption is considerable, and it is stronger at 1.61 μm than at 2.25 μm, so snow is expected to be darker in NIR1.61 images than in NIR2.25 images.

Figure 2: Absorption of ice (red curve) and water (blue curve). The vertical lines indicate the central wavelengths of the VIIRS channels used in the Cloud Phase RGB. The horizontal line helps to compare the ice absorption at 1.61 and 2.25 μm.
Reflectivity of snow, vegetation and soil
Figure 3 depicts the reflectivity of soil, vegetation and snow of three different grain sizes.
- For smaller snow grain size, the reflectivity is higher, both at 1.61 μm and at 2.25 μm. At 2.25 μm the reflectivity is higher and there is a bigger difference between the curves of the different grain sizes, so NIR2.25 is expected to be more sensitive to the snow grain size than NIR1.61.
- In VIS0.67 imagery the snow is much brighter than snow-free land, as the reflectivity of snow at 0.67 μm is much higher than that of vegetation and bare soil.
- In NIR1.61 imagery the snow is darker than snow-free land, as it is darker than both vegetation and bare soil.
- In NIR2.25 imagery the snow may be darker or brighter than the snow-free land.
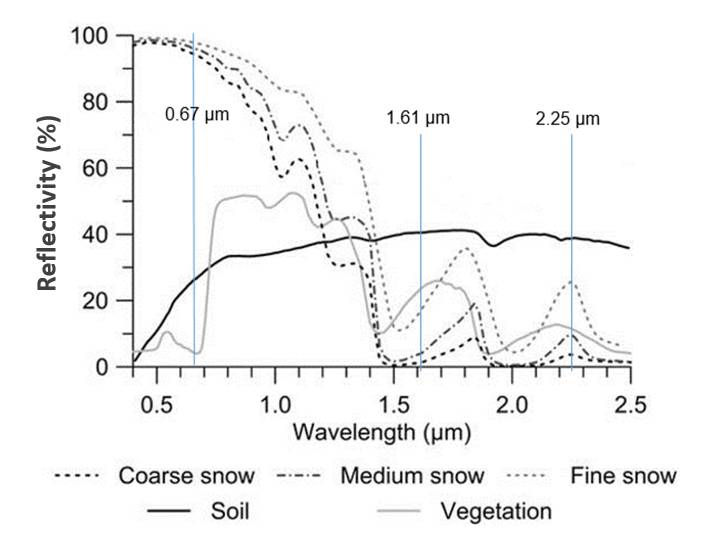
Figure 3: Snow, vegetation and soil reflectivity values at different wavelengths.