SST applications
El Niño
El Niño is characterized by unusually warm ocean temperatures in the Equatorial Pacific, as opposed to La Niña, which is characterized by unusually cold ocean temperatures in the Equatorial Pacific. El Niño has important consequences for weather conditions around the globe, among which are increased rainfall across the southern tier of the U.S. and in Peru, which has in the past caused destructive flooding, as well as drought in the West Pacific, sometimes associated with devastating brush fires in Australia (https://www.pmel.noaa.gov/elnino/what-is-el-nino).
Comparing a "normal" winter to an El Niño winter with remote sensing
Figure 23 shows a comparison of SST for:
- December 2014 to January 2015 - considered a "normal" year;
- December 2015 to January 2016 - where the higher SST values, depicted in red colors, are clearly seen and correspond to El Niño conditions;
The higher (about 2 °C higher than for the "normal" period) SST observed off of the Pacific Coast of Central America and Mexico influenced this oceanic region: Higher SSTs during El Niño winter are caused by the increased depth of the thermocline, which reduces wind mixing to bring subsurface water to the surface. This reduces phytoplankton productivity, due to decreased nutrient availability from the subsurface waters.
|
|
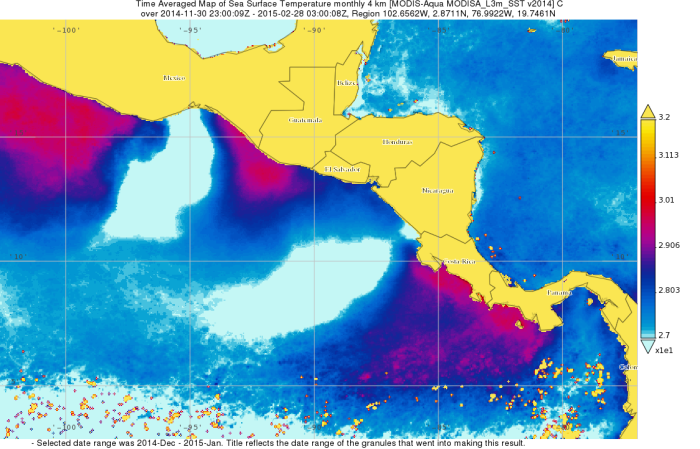
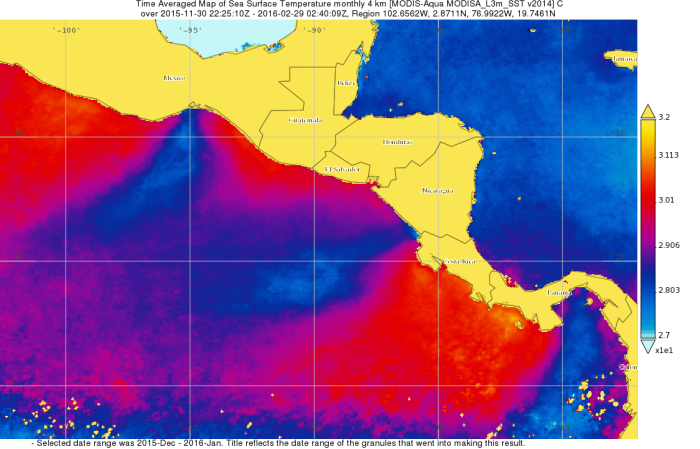
Fig. 23: MODIS SST averaged over December 2014 to January 2015 in comparison with MODIS SST averaged over December 2015 to January 2016. In the used color scale light blue indicates the lowest temperatures.
Source: Sparse Times in the Gulf of Tehuantepec-Evaluating the effects of the 2015-2016 El Niño on the wind-mixed productivity in the Eastern Tropical Pacific Ocean by Jim Acker, NASA Goddard Space Flight Center (ADNET) (https://wiki.esipfed.org/w/images/8/89/Pacific_Wind_Jets_2015-2016_edited_final_BT_060216_1823_BP_060616_changes_accepted_060716_1304.pdf)
La Niña
A La Niña event is identified by colder than normal sea surface temperatures.
The following animation shows the evolution of SST as observed by the TRMM Microwave Imager (TMI) in the Equatorial Pacific. South America is shown in grey on the right hand side and black indicates missing data. The animation starts on 1 January 1998 and continues, every 10 days, until 30 August 1998. The colors emphasize the edge of the Equatorial Current.
The onset of the cold tongue, typical of late summer circulation patterns, is seen on 1 June 1998. It is stronger than normal due to the La Niña conditions. Only 10 days later, on 6 June, tropical instability waves are already apparent. Individual waves can be identified and followed.
Many of the images clearly contain eddy-like structures in the wave troughs on both the northern and southern edges. Colder (yellow) water is curling back to the east from the tips of the waves. On 31 July 1998, a complete ring of cold water curls off the top of a wave on the northern edge.
Source: http://www.remss.com/blog/sst-reveals-pacific-equatorial-current-during-1998-la-ni%C3%B1a
Low-level coastal jets
Low-level coastal jets (LLCJs) are a particular type of low-level jet which occurs in coastal regions, with an important impact on vertical wind speed shear and low-level cloudiness. They can be typically indentified in scatterometer wind products by a near-surface high wind speed region with small scale speed inhomogeneities anchored in the topography (Figure 24).
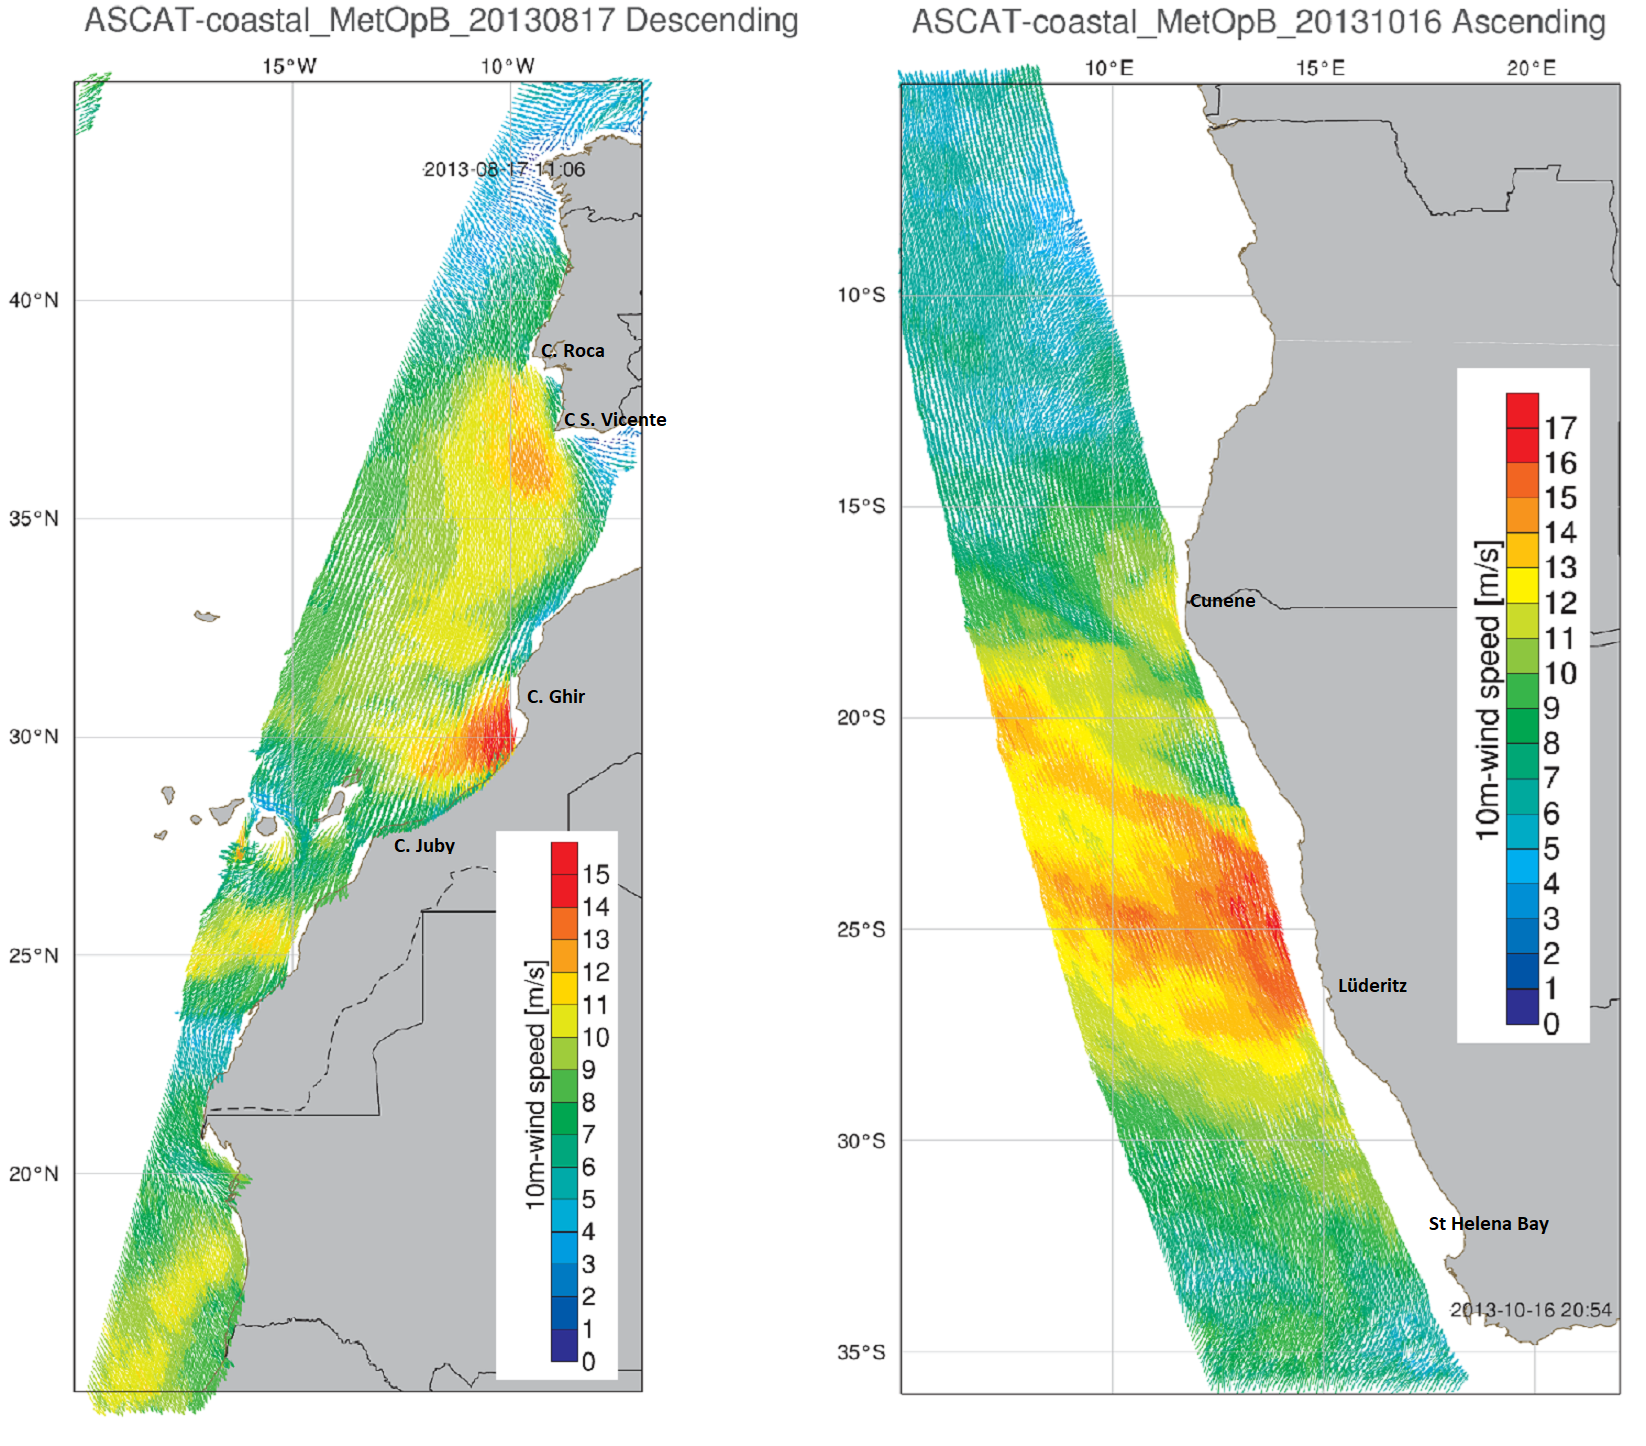
Fig. 24: 10-metre neutral wind speed (m s-1) from ASCAT-coastal, MetOp-B (a) for 17 August 2013 at the 11:00 UTC descending pass over the north-east Atlantic and (b) 16 October 2013 at the 21:00 UTC ascending pass over the south-east Atlantic.
LLCJs generally occur in regions where coastal upwelling (the process by which deep, colder waters, rise to the surface) is present, and SST products are commonly used to identify these features. The upwelling of colder subsurface waters due to the along-coast wind can be identified using SST imagery. Figure 25 shows a tongue of cold coastal water (blue hues) along the north-east and south-east Atlantic.
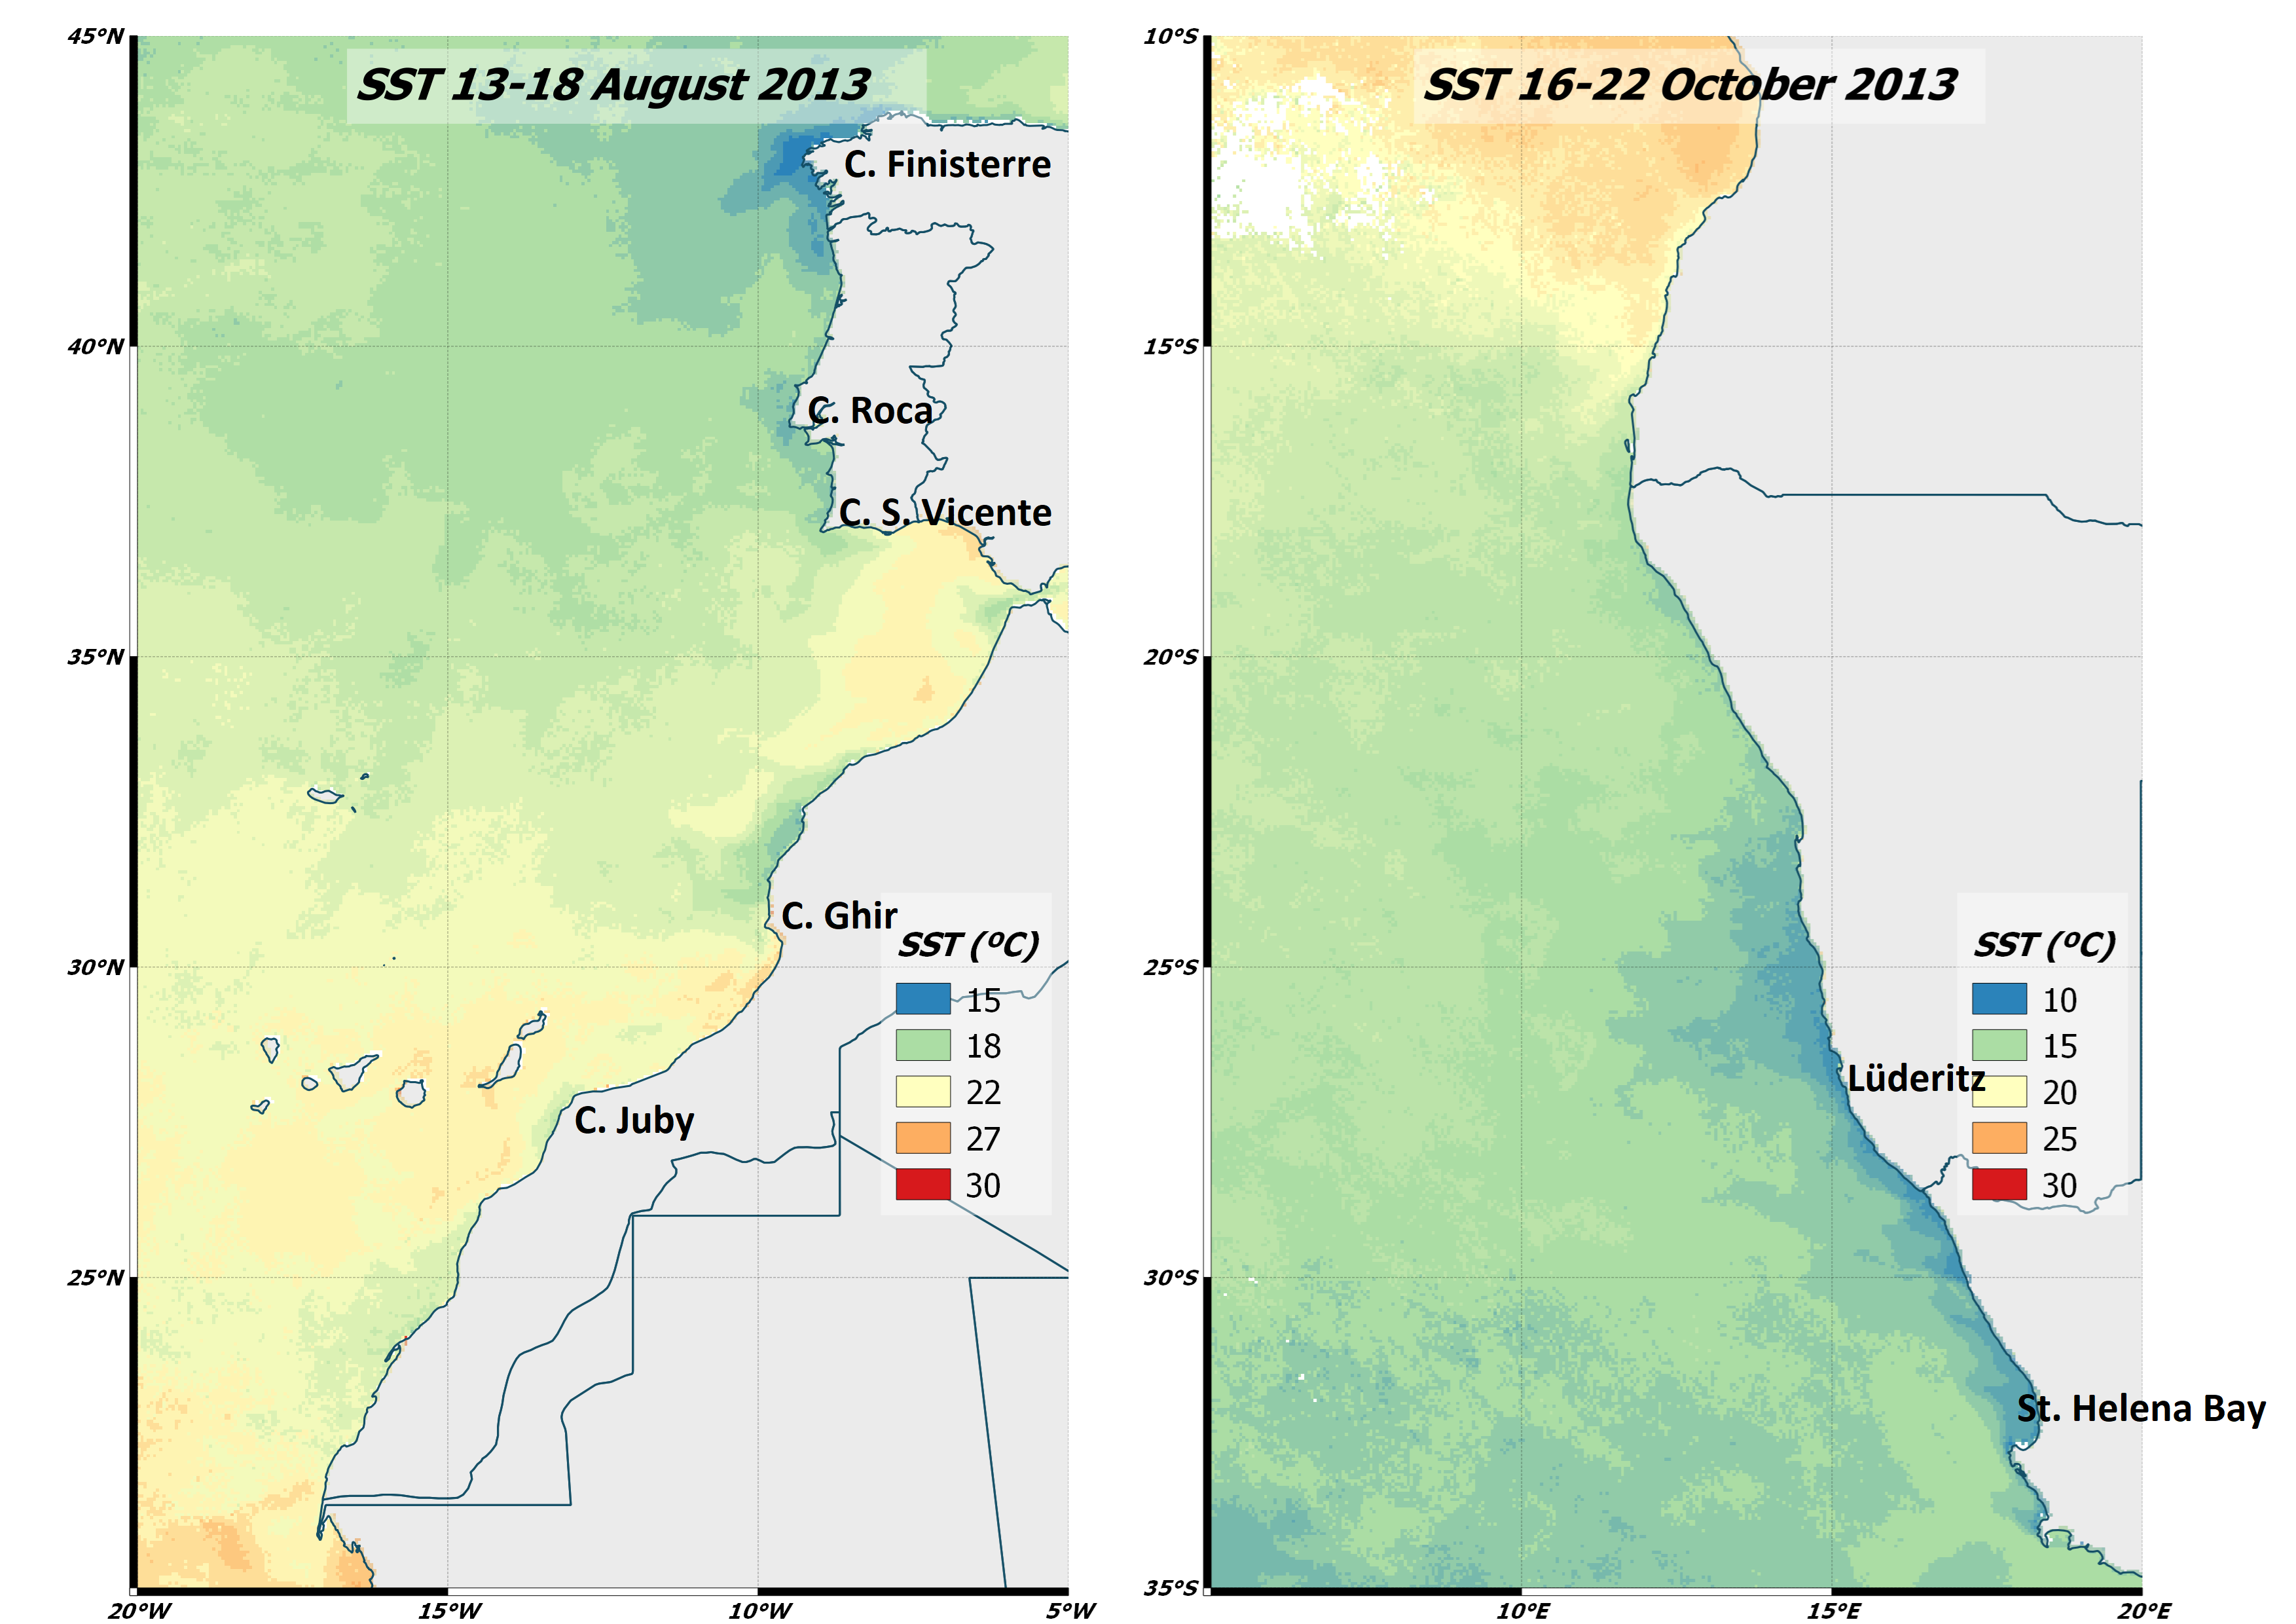
Fig. 25:EUMETSAT OSI SAF SST (Meteosat) averages taken during LLCJ conditions. Left panel: north-east Atlantic and right panel: south-east Atlantic.
Instabilities in ocean currents identified by SST maps from Copernicus Sentinel-3 satellites
In the southern part of the Mediterranean Sea, the Algerian current runs along the coast of Northern Africa. This current frequently becomes unstable, forming meaders and eddies, as illustrated by the series sea surface temperature as measured by the Sentinel-3 SLSTR instrument, between 28 November and 2 December 2019 (next animation)
Follow the link to read the full story.
SST fronts
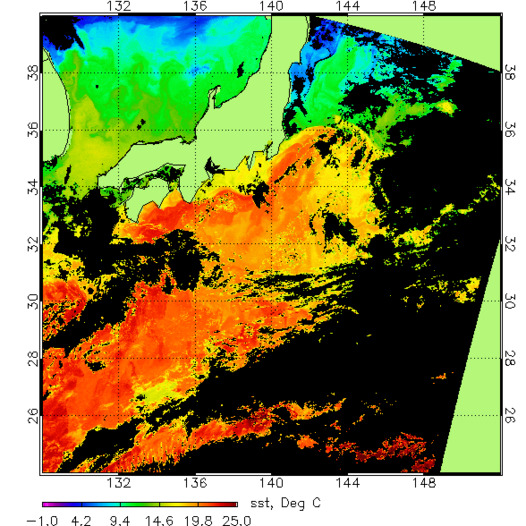
Fig. 26: SST derived from MODIS, 11 April 2004. Source: http://disc.sci.gsfc.nasa.gov
In Figure 26 the warm SST fronts south of Japan indicate the Kuroshio fronts (The Kuroshio is a warm current about 100 kilometres). North of Japan, in the Sea of Japan, the SST fronts of the Tsushima Current are visible (https://en.wikipedia.org/wiki/Kuroshio_Current)
Mediterranean intense rain events
The Mediterranean intense rain events, is a recurrent meteorological process that takes place in the Mediterranean area, corresponding to concentrated and intense rains lasting several days and affecting areas as Southern France and Eastern Spain in the autumn season.
As this process is highly correlated with the Mediterranean sea surface temperature, monitoring this variable is important to establish its relationship with heavy precipitation events.
Source: https://marine.copernicus.eu/usecases/monitoring-intense-rain-events-mediterranean-sea-area/
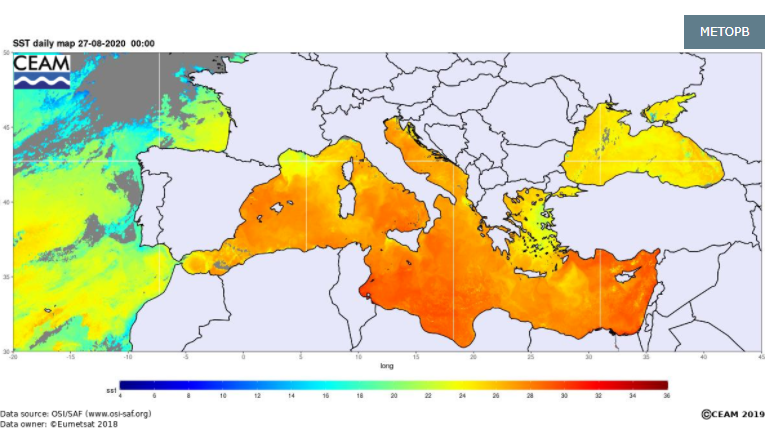
Fig. 27: SST available from the Mediterranean Center for Environmental Studies (CEAM: http://www.ceam.es/ceamet/SST/)
The Mediterranean Center for Environmental Studies (CEAM) is using satellite sea surface temperature data from the Copernicus Marine Service and other sources in order to monitor the sea surface temperature in the Mediterranean Sea on a daily basis, and has also built a climatology of SST. Daily map updates from different sources and information on sea surface temperature climatology and trends are available from a website developed by CEAM (http://www.ceam.es/ceamet/SST/).
Climate monitoring
The following map in Figure 28 shows global temperature anomalies in 2019, produced by the National Oceanic and Atmospheric Administration (NOAA). The SST data used here comes from both in-situ and satellite-based data from November 1981 to 2019 (https://doi.org/10.1175/1520-0442(2002)015%3C1609:AIISAS%3E2.0.CO;2).
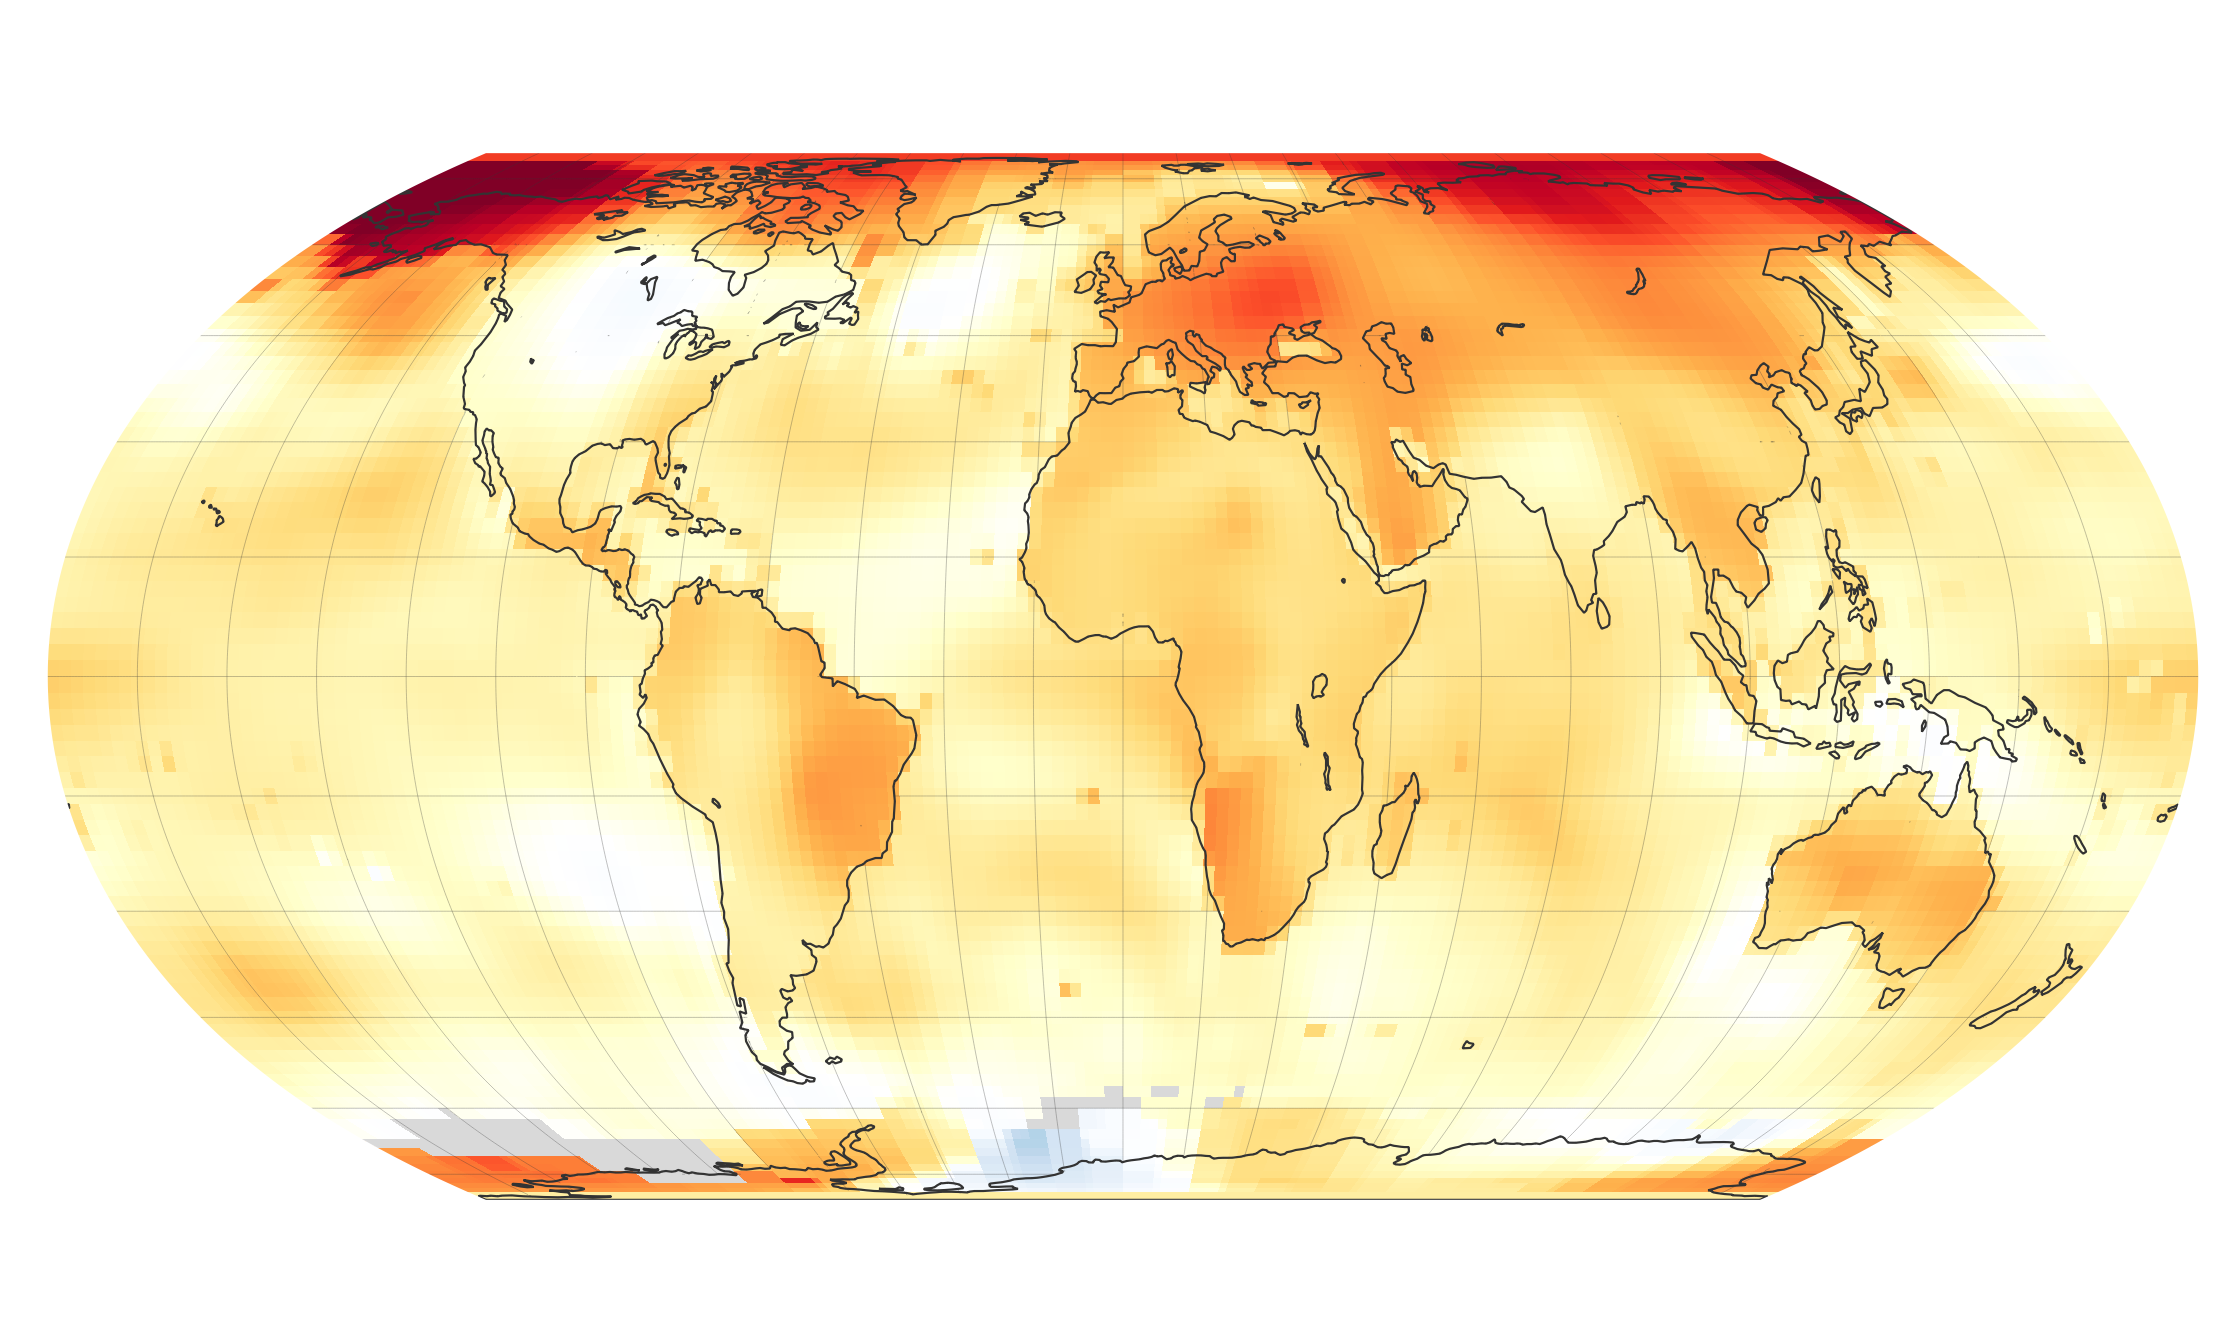
Fig. 28: temperature anomalies in 2019, produced by NOAA.
According to independent analyses by NASA and the National Oceanic and Atmospheric Administration (NOAA), Earth's surface temperatures in 2019 were the second warmest since modern record-keeping began in 1880 (0.98 °C warmer than the 1951 to 1980 mean, according to scientists at NASA's Goddard Institute for Space Studies).
Globally, 2019 temperatures were second only to those in 2016 and continued the planet's long-term warming trend. The past five years have been the warmest of the past 140 years.
Source: https://earthobservatory.nasa.gov/images/146154/2019-was-the-second-warmest-year-on-record
Figure 29 highlights some significant anomalies and weather events during 2019:
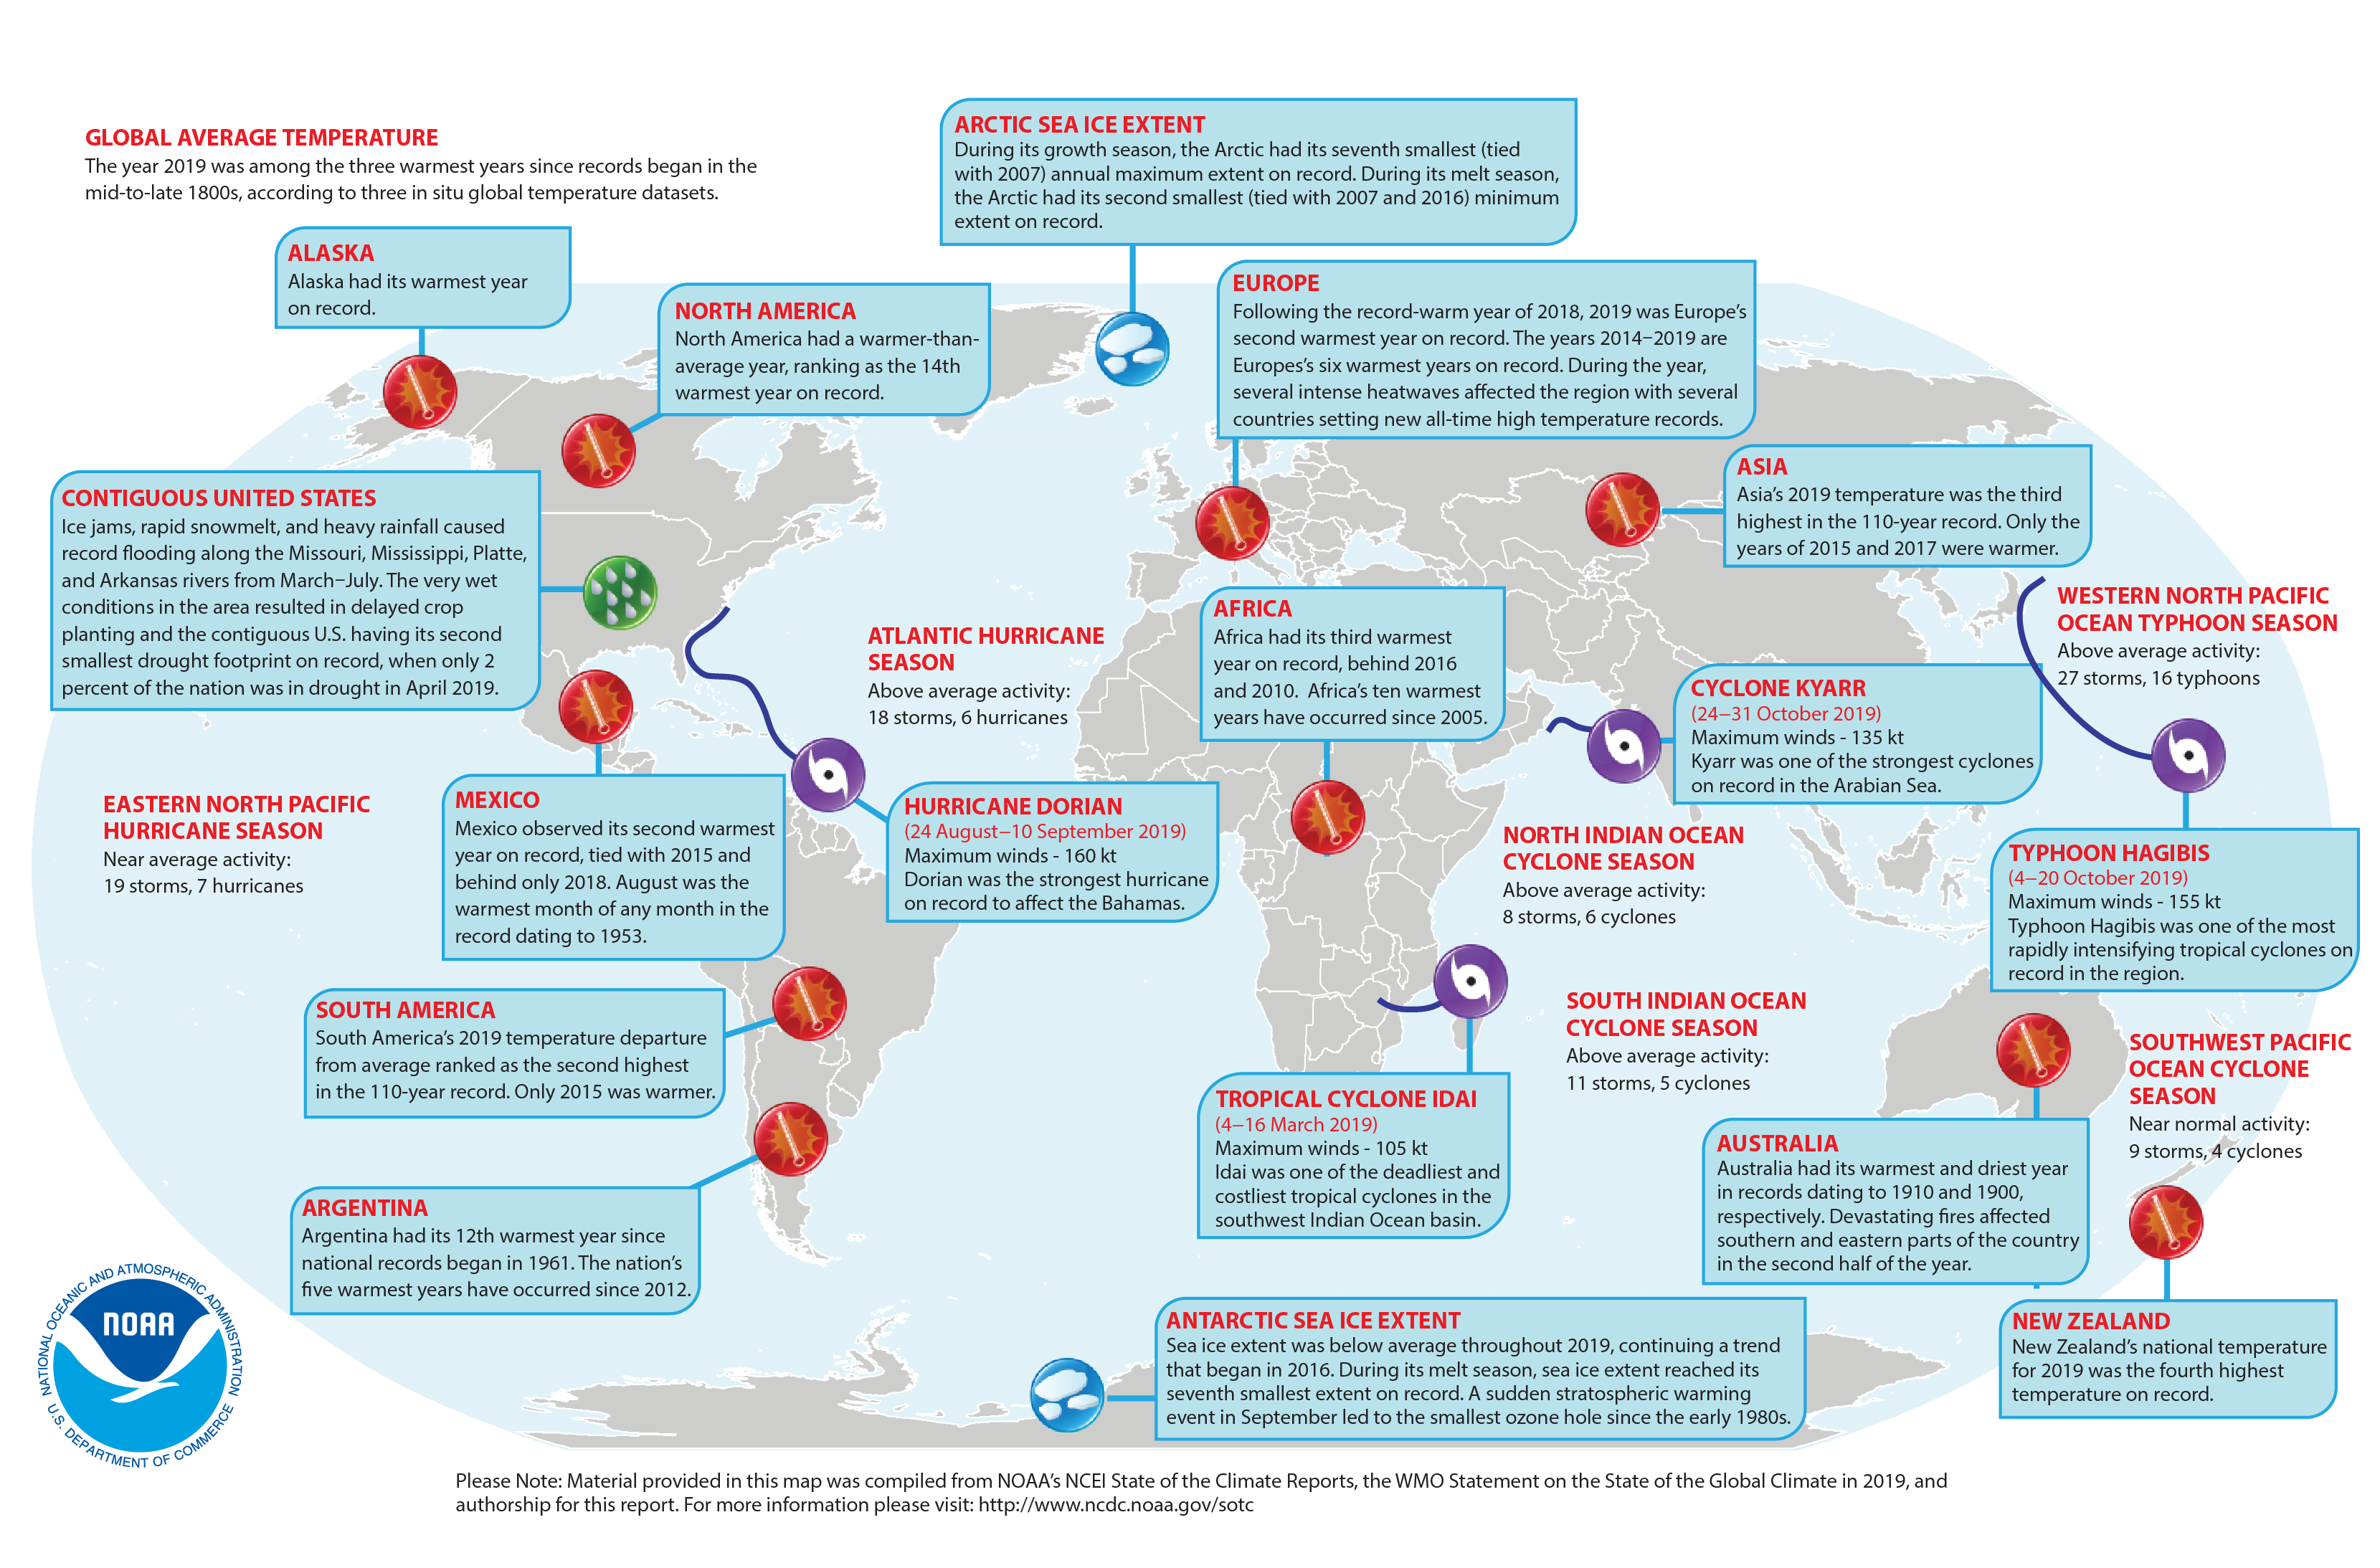
Fig. 29: Source: https://www.ncei.noaa.gov/sites/default/files/Significant%20Events%20Map.png
Monitoring heatwaves
Heatwaves can be detected by abnormal SST values. The next figure shows, on the right hand side, SST from the OSI SAF processing of Metop AVHRR, between 21-25 June 2020, highlighting a rapid increase in SST, of more than 5 °C, that occurred over the Baltic sea. By comparing this with the climatology maps of SST that can be observed in the left hand side of the figure, it is clear that this warming is much greater than usual. This rapid warming is in correlation with the heat peak linked to a powerful high pressure which was positioned around Belgium on 23 June.
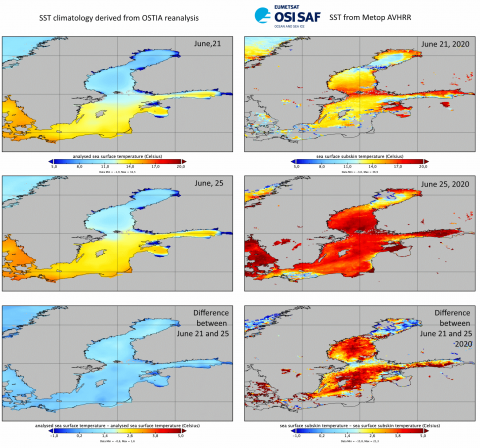
Fig. 30: Comparison of OSI SAF SST (Metop AVHRR) with SST climatology derived from OSTIA reanalysis. Source: http://www.osi-saf.org/?q=content/stories