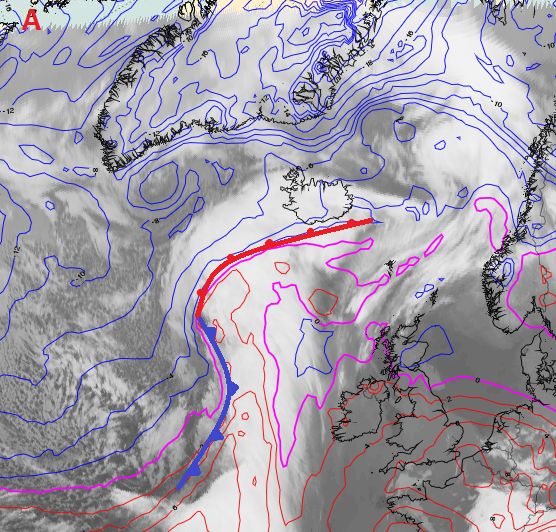
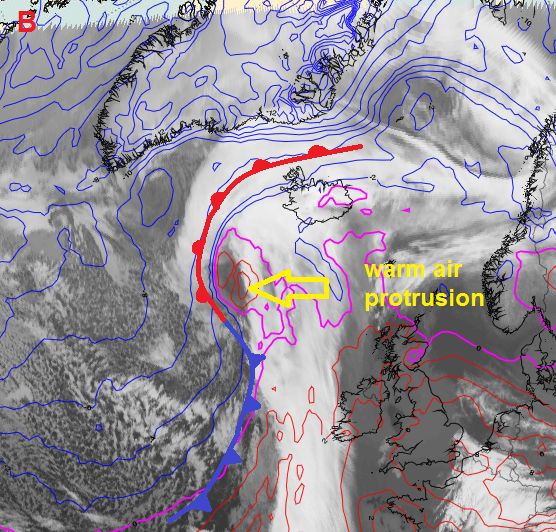
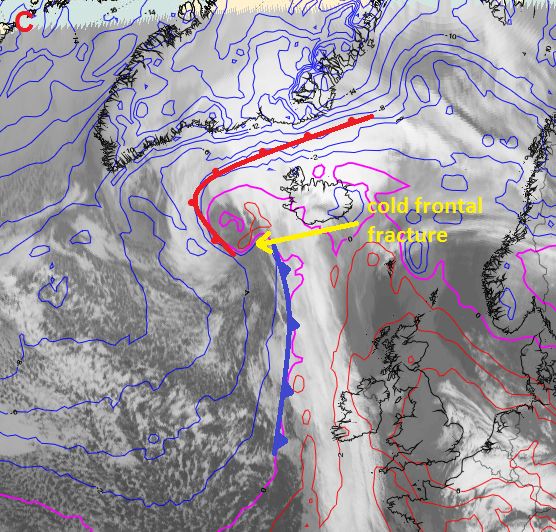
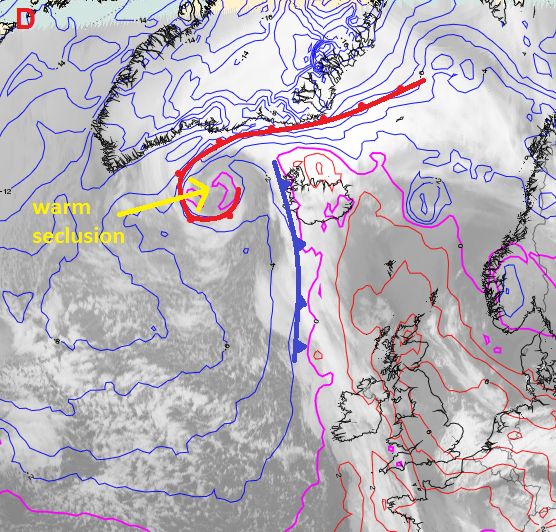
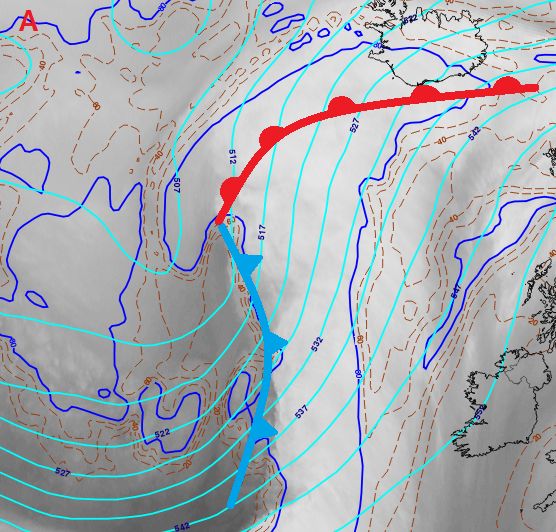
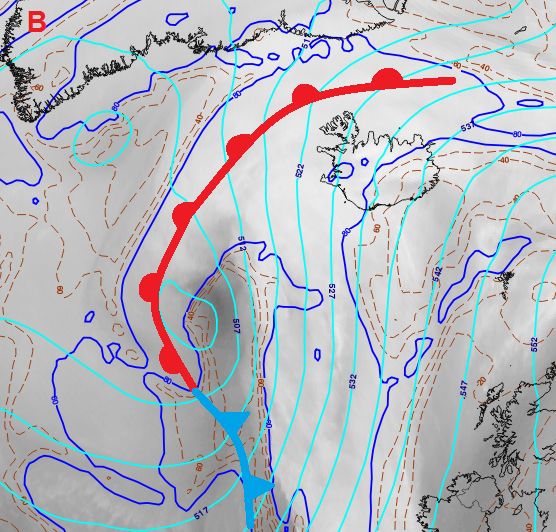
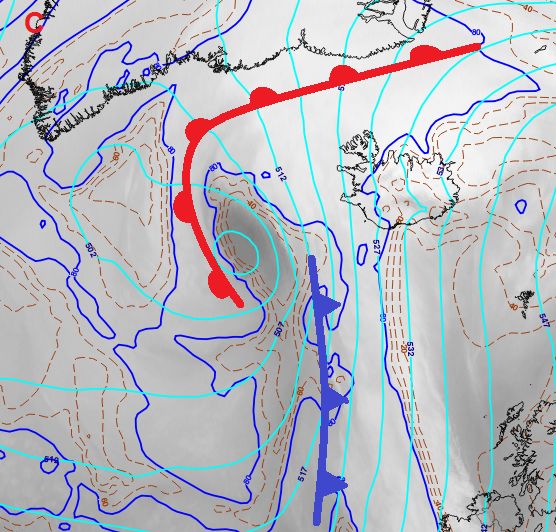
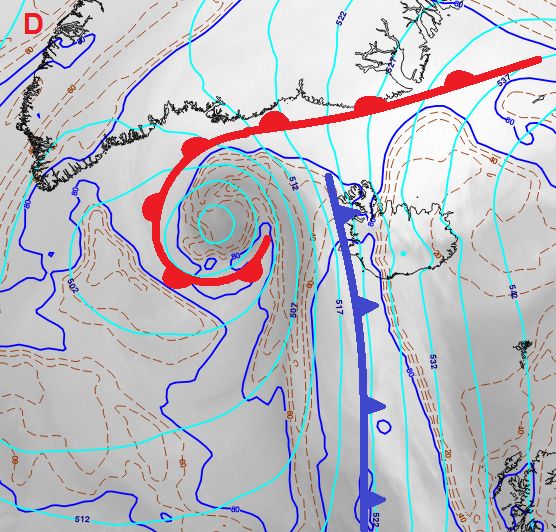
Example of a Warm Core seclusion
(8 January 2018, 18:00 UTC to 9 January, 12:00 UTC)
The warm core seclusion process takes place at lower tropospheric levels. It is the main characteristic of the Shapiro-Keyser cyclone and, together with the cold frontal fracture, distinguishes it from the Norwegian cyclone model. The two processes are tightly connected and occur when the cyclone reaches the maturity stage.
As warm air is encapsulated, the thermal gradient, which is an important characteristic of a cold front, becomes weaker at the northern tip of the cold front. Due to the progression of warm air from the warm sector (B), the warm front extends southward. This bent-back warm front, which delimits the warm core of the cyclone from surrounding colder air, is visible in IR imagery as a cyclonic cloud band similar to the occlusion cloud band in Norwegian cyclones (C). In fact, the occlusion process, which occurs for Norwegian cyclone types, does not occur here. In the final step (D), cold air from behind the cold front starts to seclude the warm core from the warm sector.
Figure 1: SEVIRI IR10.8 μm images from 8 and 9 January 2018 (18, 00, 06 and 12 UTC from top left to bottom right). Isolines of the temperature at 850 hPa and the position of the cold and warm front in a Shapiro-Keyser cyclone.
Note:
As can be seen in Figure 1 (lower left), during the cold frontal fracture process the cold and warm front are still attached to each other at lower levels, with an inactive baroclinic boundary. This low-level boundary is eroded from above by cold air during the seclusion process.
Development at higher levels
During the developing stage (A), dark areas in SEVIRI 6.2 μm water vapor imagery indicate subsiding air masses behind the cold front. The vertical axis of the cyclone is still inclined westward (B). On the eastern side of the 500 hPa trough, dry air masses are advected on top of the warm core at higher levels. This advection (i.e., the dry intrusion conveyor belt) progressively affects lower atmospheric levels (C and D) and erodes the cold front from above down to lower levels (cold frontal fracture).
Figure 2: SEVIRI WV6.2 μm images from 8 and 9 January 2018 (18, 00, 06 and 12 UTC from top left to bottom right). Isolines of relative humidity at 500 hPa (blue/brown) and geopotential height at the same level (cyan).
