The correlation coefficient measures the degree of linear association between forecasts and observations.
In other words, do higher (lower) forecast values tend to be associated with higher (lower) observed values?
If that is true then the correlation coefficient will be positive. Correlation can also be negative,
in which case higher (lower) forecast values tend to be associated with lower (higher) observed values.
The correlation has a range of -1 to +1. A value of 0 indicates no linear correlation at all in which case
the forecasts are said to be independent of the observations.
It is important to know that the correlation coefficient is unaffected by linear bias. Forecast and observation
can be perfectly correlated (correlation coefficient = 1), but could still be biased.
Graphically, the more "scatter" there is, the closer to 0 the correlation will be. As long as the eye can "line up"
the data points as a straight line at an angle, then there is at least some correlation. Correlation is perfect if
the data points all lie along any straight line with non-zero slope. Correlation is independent of bias,
so the line of perfect correlation need not pass through the origin.
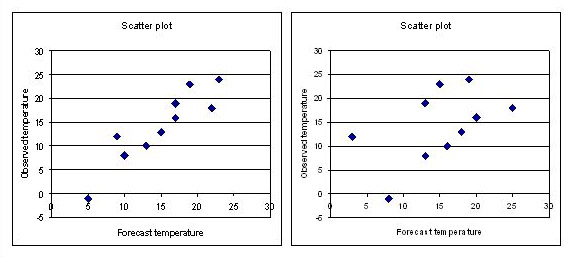
Below are two scatter plots representing two different sets of forecasts. The observations are the same
in both cases. Answer the following questions about the two plots:
Loading Questions
...
Which of these two sets of forecasts is positively correlated with the observations?
Correct. In both cases, lower (higher) forecast temperature values tend to be associated
with lower (higher) observed temperatures.
For which set of forecasts is the correlation higher?
Correct. Correlation is 0.914 for the left hand set of forecasts and 0.506 for the right hand set of forecasts.