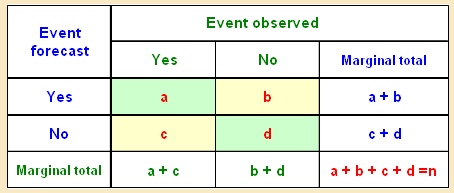
Critical Success Index (CSI) or Threat Score (TS), and Equitable Threat Score (ETS)
|
|
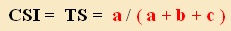
The Critical Success Index, also called the Threat Score, is given by:
CSI = (hits) / (hits + false alarms + misses)
Its range is 0 to 1, with a value of 1 indicating a perfect forecast.
The CSI is relatively frequently used, with good reason.
Unlike the POD and the FAR, it takes into account both false alarms and missed events,
and is therefore a more balanced score.
The CSI is somewhat sensitive to the climatology of the event,
tending to give poorer scores for rare events.
A related score, the Equitable Threat Score is designed to help offset this tendency.
The ETS is given by:
ETS = (hits - hits expected by chance) / (hits + false alarms + misses – hits expected by chance)
a
r
= (total forecasts of the event) * (total observations of the event) / (sample size)
The number of forecasts of the event correct by chance, a
r
, is determined by assuming that the forecasts
are totally independent of the observations, and forecast will match the observation only by chance.
This is one form of an unskilled forecast, which can be generated by just guessing what will happen.
The ETS has a range of -1/3 to 1, but the minimum value depends on the verification sample climatology.
For rare events, the minimum ETS value is near 0, while the absolute minimum is obtained if the event
has a climatological frequency of 0.5, and there are no hits.
If the score goes below 0 then the chance forecast is preferred to the actual forecast,
and the forecast is said to be unskilled.
The CSI does not use the correct non-events value ("d") of the table, which can be seen as a practical advantage.
In forecasting, especially of rare events, scores which use the correct non-events may be less sensitive
to performance of the important forecasts of the rare event, and are overwhelmed by many correct forecasts
of the non-event.
The ETS involves correct non-events via the number correct by chance
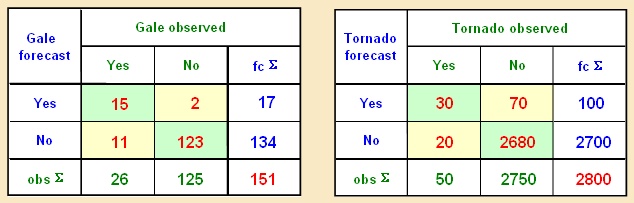
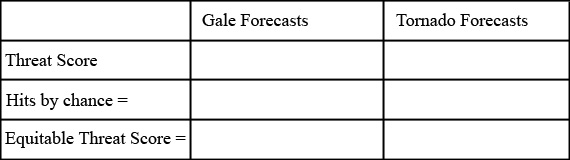
The following exercise, again using the gale and tornado forecasts,
should help your understanding of the relationship between the TS and the ETS.
The first part of the exercise asks you to calculate the two scores for the two sets of forecasts,
then the second part leads you through an interpretation of the results.
Determine the CSI, the number of hits by chance (a
r
) and the ETS for the two
contingency tables shown above by dragging the correct answer to the
appropriate boxes in the table.
Please put the labels on one of the existing boxes.
You have completed the exercise