Frequency Bias (B or FBI)
|
|
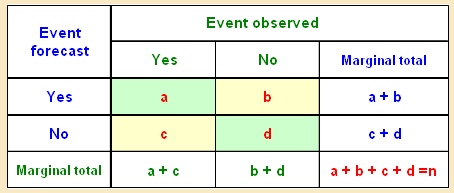
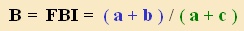
The frequency bias, or just "bias" is computed from the contingency table shown above by:
B = (total forecast yes) / (total observed yes)
The bias has a range of possible values of 0 to ∞.
When the number of observed occurrences of the event is small,
the denominator becomes small and the bias correspondingly large and unstable.
The desirable value for bias is 1, indicating an unbiased forecast where the event
is forecast exactly as often as it is observed.
The bias is often called "frequency bias" to distinguish it from the linear bias or
mean error which is a verification measure for continuous variables.
When B is greater than 1, the event is overforecast
When B is less than 1, the event is underforecast
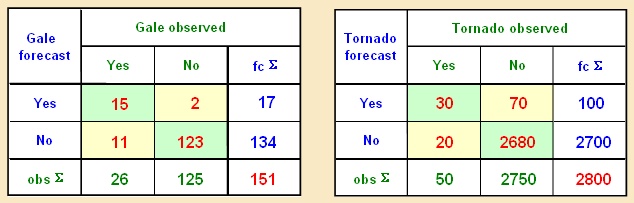
Below are two contingency tables representing two completely different sets of forecasts.
The left hand table is for 151 Gale forecasts, and the right hand table is for 2800 forecasts
of the occurrence of tornados in the US. Test your understanding of frequency bias using
the question below the tables:
Loading Questions
...
Which of the following statements correctly describes the bias of the two sets of forecasts?
Yes, correct: For gales, B=17/26 which is less than 1
while for tornados, B= 100/50 which is greater than 1.