Creating Ash RGB images
The 'recipe' of the Ash RGB is summarized in Table 1. It shows which channels or channel differences are visualised in red, green and blue. The measured values should be first calibrated to brightness temperatures. The channels or channel differences should be then enhanced - linearly stretched - within the brightness temperature ranges shown in the table.
Table 1: 'Recipe' of Ash RGB
| Colour beam | Channel | Range [K] | |
|---|---|---|---|
| Red | IR12.0 - IR10.8 | -4 | +2 |
| Green | IR10.8 - IR8.7 | -4 | +5 |
| Blue | IR10.8 | 243 | 303 |
This RGB type is usable throughout the day. Note that the channel combinations are the same as for Dust RGB (and for 24 hour Microphysics RGB), but the enhancement is different. The green range is different mainly to better detect SO2 plumes (+5 K gives full green), but also to make thick ice clouds brownish (instead of dark red) to better separate thick ice clouds from thin ash clouds. The blue range is different because ash clouds tend to be higher in the atmosphere (and colder) than dust clouds.
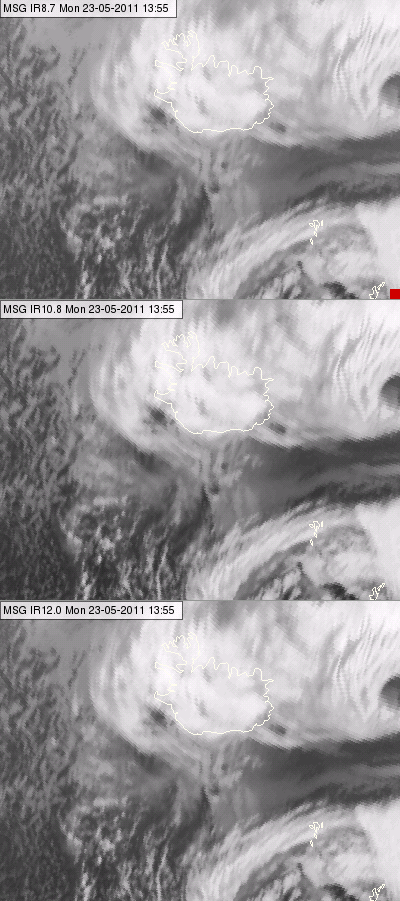
The following example shows how the Ash RGB is combined from the three infrared channels. Fig. 3a shows the three channels separately, all enhanced in the same brightness temperature range (visualising lower brightness temperatures in brighter tones). All three are atmospheric window channels, showing the thick clouds in different shades of gray according to their cloud top temperatures. These single channels do not suggest the presence of volcanic ash over the area.
| Figure 3a: Volcanic eruption in Iceland: IR8.7 (upper panel), IR10.8 (middle panel) and IR12.0 (bottom panel) images for 23 May 2011 at 13:55 UTC |
|
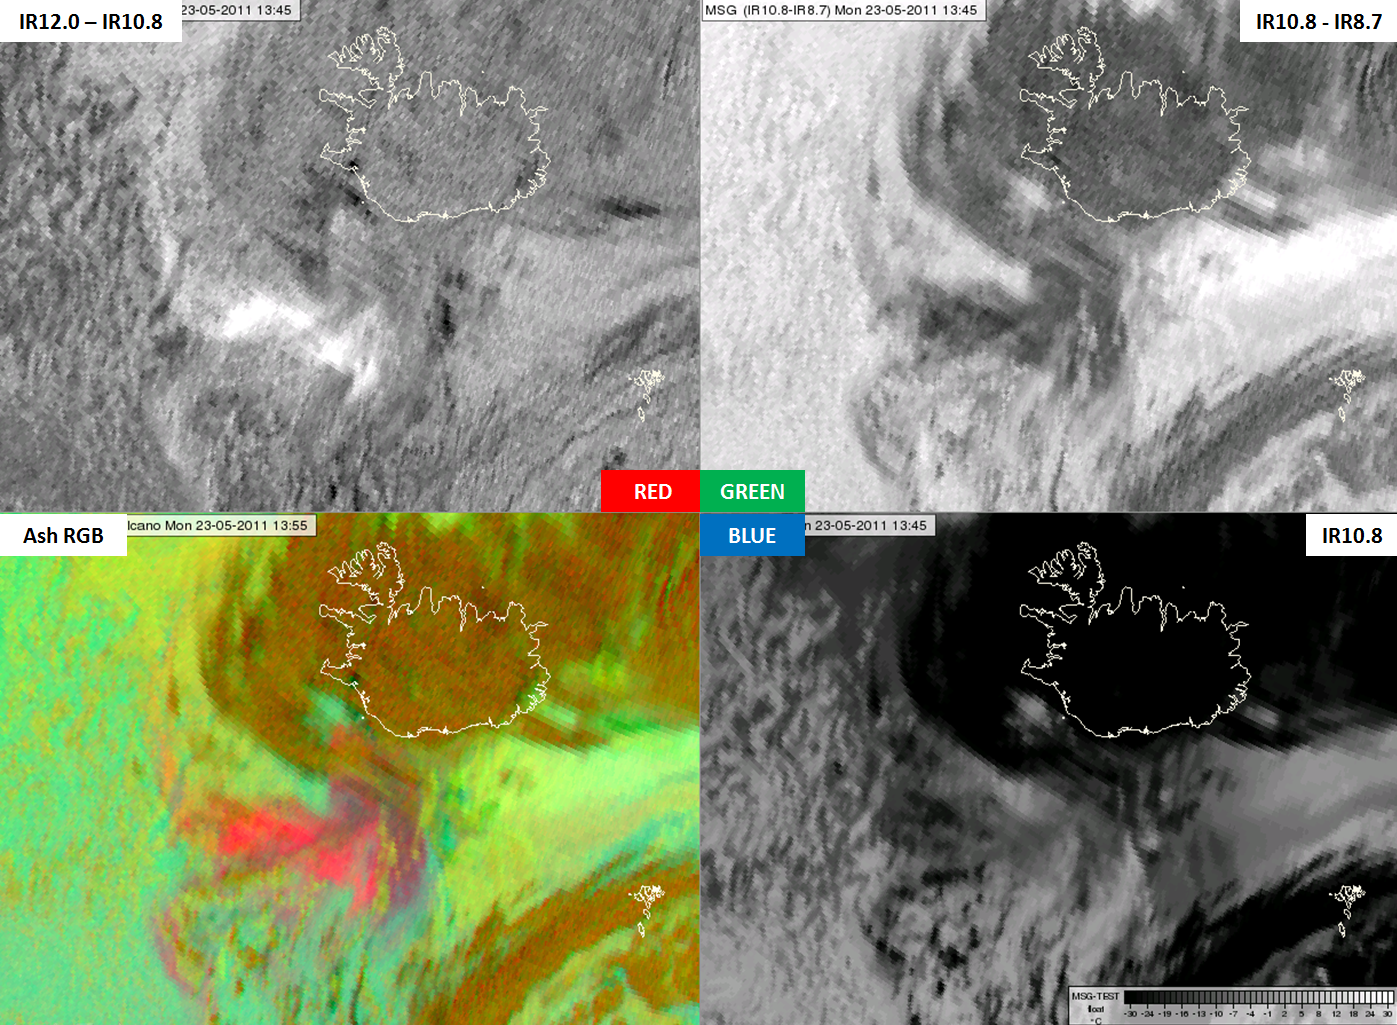
Fig. 3b shows the colour components of the Ash RGB images: the channel (differences) with their corresponding enhancements. The lower left panel shows the Ash RGB.
- The bright shades in the (IR12-IR10.8) difference image hint at volcanic ash. Dark shades indicate semitransparent clouds or sub-pixel water clouds while medium grey shades indicate thick clouds or a cloud-free surface
- The (IR10.8-IR8.7) difference image reveals the phase of the clouds: water clouds are bright, ice clouds are dark, and thin clouds are even darker. A thin ash cloud is similar to thin ice clouds.
- The IR10.8 image is enhanced according to the range in Table 1. (Cold clouds are black, warm clouds and surface features are brighter.) The semitransparent ash cloud has a medium strong signal.
In Ash RGB images volcanic ash plumes appear red or magenta; the red component is strong while the green and blue components are weaker. The volcanic ash plume has a good colour contrast against the surrounding water and ice clouds and the sea.
| Figure 3b: Volcanic eruption in Iceland: IR12.0-IR10.8 (top left), IR10.8-IR8.7 (top right), IR10.8 (bottom right) and Ash RGB (bottom left) images for 23 May 2011 at 13:55 UTC |
|
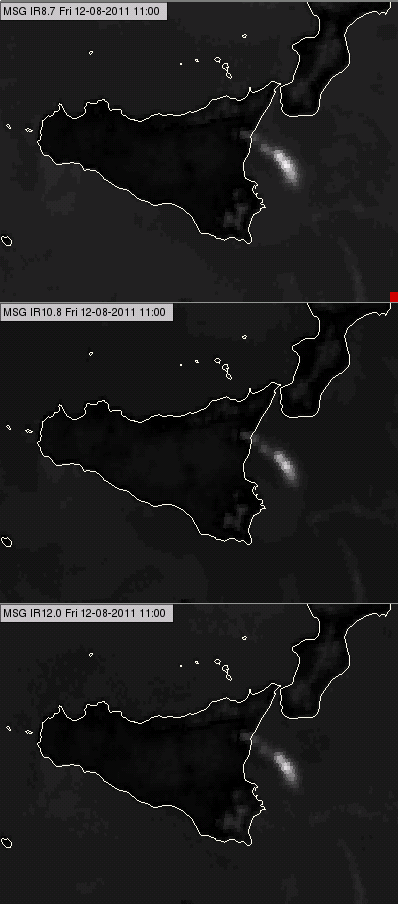
Figs. 4a and 4b show an example when SO2 gas was released by Mount Etna in Sicily. The eruption happened in cloud-free conditions. Etna first spewed out an SO2 gas plume, followed by an ash cloud. Fig. 4a shows the three infrared channels separately, all enhanced in the same brightness temperature range (lower brightness temperatures are visualised in brighter tones). All three channels show an elongated colder band downwind of the mountain, which gets colder further out.
| Figure 4a: Volcanic eruption of Mount Etna, Sicily: IR8.7 (top), IR10.8 (middle) and IR12.0 (bottom) images for 12 August 2011 at 11:10 UTC |
|
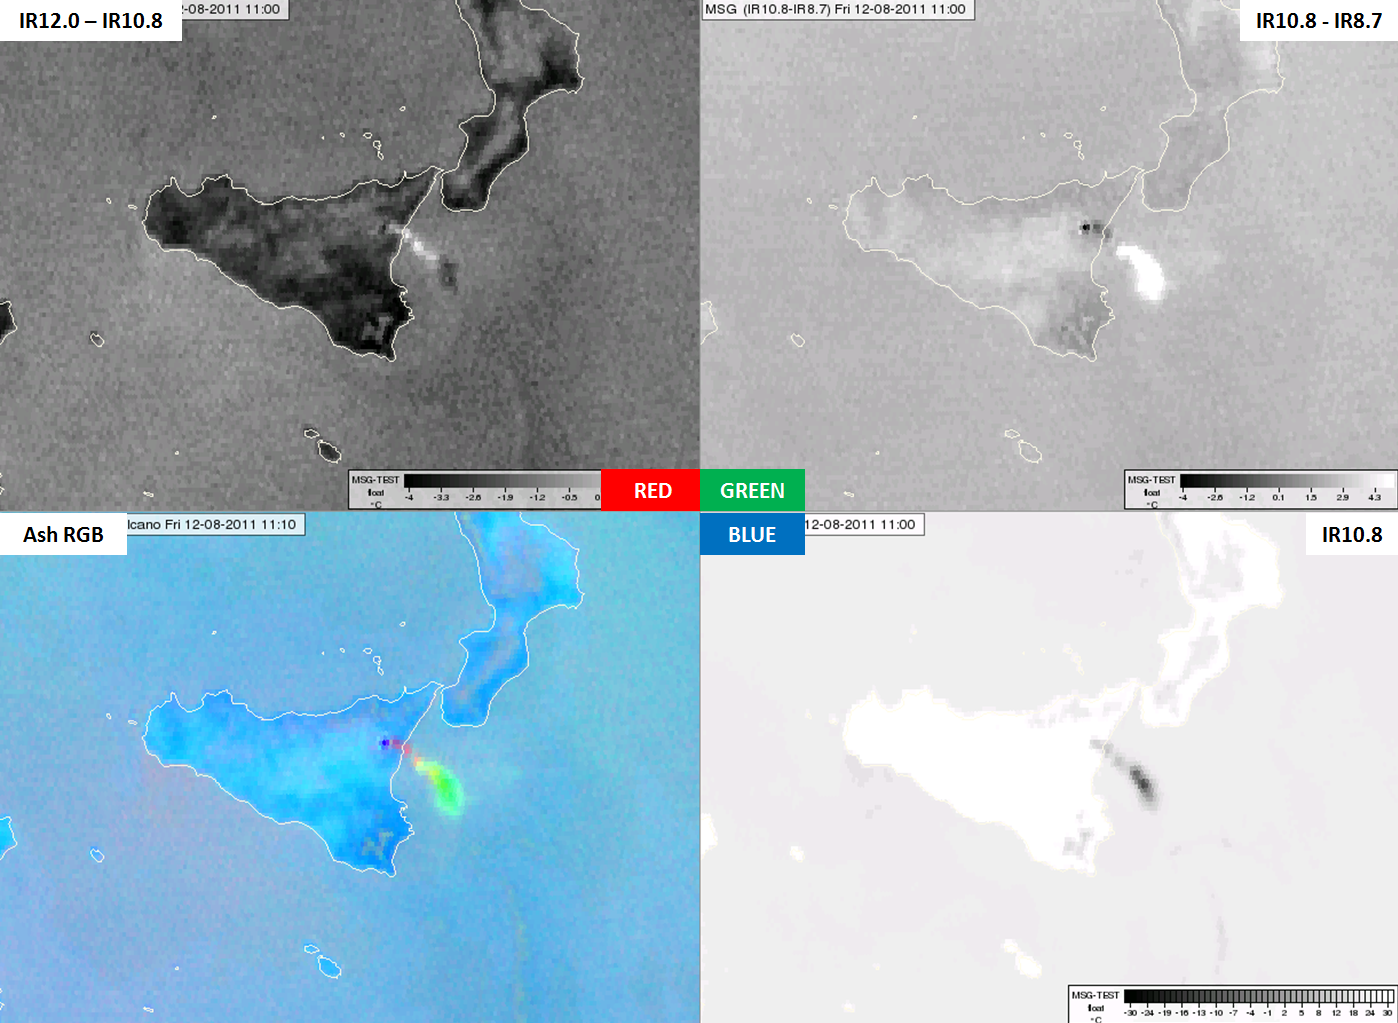
Fig. 4b shows the colour components of the Ash RGB image for the Mount Etna eruption: the channel and channel differences which comprise the image, with the corresponding enhancement. The lower left panel shows the Ash RGB.
- The bright shades in the (IR12-IR10.8) difference image could be volcanic ash. The dark shades at the end of the plume could be semitransparent ice clouds.
- The bright shades in the (IR12-IR8.7) difference image could be SO2 gas plume. Close to the crater there is a short elongated darker band, likely ash cloud. However, based only on this difference it might also be a thin ice cloud. Note that in the (IR10.8-IR8.7) difference image one can recognize the hot spot of the crater.
In the Ash RGB one can recognize the hot lava in the crater (dark blue) and a plume downwind of Mount Etna. The plume is magenta close to the crater and green further downwind, with some yellow patches in between. The green colour indicates an SO2 gas plume; the magenta colour indicates a volcanic ash plume and the yellow patches are likely to be their mixture.
The ice cloud hinted by the (IR12-IR10.8) difference image is not seen in the Ash RGB image. The gas and ash plumes are well separated from the surface colours.
| Figure 4b: Volcanic eruption in Sicily, Mount Etna. IR12.0-IR10.8 (top left), IR10.8-IR8.7 (top right), IR10.8 (bottom right) and the Ash RGB (bottom left) images for 12 August 2011 at 11:10 UTC |
|