Fuel
According to a classification of Forestry Canada in 1992, fuel types can be organized in 5 major groups (Coniferous, Deciduous, Mixedwood, Slash and Open), with a total of 16 discrete fuel types. As you can see in table 3.1, each type is defined in terms of:
- forest floor cover (e.g. lichen) and organic layer (e.g. organic duff with 0-5 cm depth, uncompacted)
- surface fuels (e.g. very sparse shrub cover) and ladder fuels (e.g. tree crown extends to ground)
- stand structure (eg. fully stocked conifer plantation) and composition (eg. leafless)
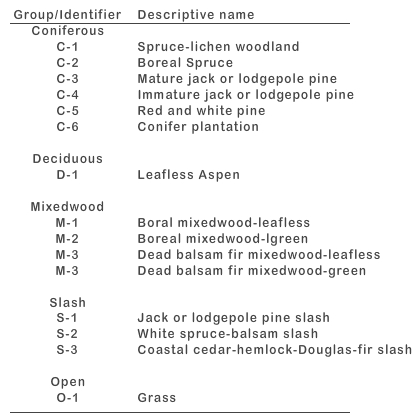
Table 3.1 - Fuel Types according to Forestry Canada (1992).
The given examples are simple for the benefit of those who are not foresters. One should be aware that the kind of vegetation should be accounted for, and that doing so is not simple.
One way of knowing how vegetation characteristics change from place to place and over time in a specific location is with a bird's-eye view using satellites.
The most well-known satellite product usually used to evaluate vegetation cover is the Normalized Difference Vegetation Index (NDVI). This index has been mostly derived from channel 1 (0.58-0.68 μm) and channel 2 (0.725-1.0 μm) of the NOAA satellite series. However, NDVI can be derived from any instrument with channels in the visible and near-infrared (NIR) parts of the spectrum, according to this general equation:
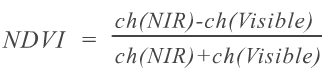
Infact, NDVI is based on the fact that pixels with dense vegetation have a stronger signal in the near-infrared than in the visible part of the spectrum, because green leaves have a reflectance of about 60% in the first case and less than 20% in the second.
Question
What NDVI values would you expect for an area with vegetation:
The correct answer is C.
0.5 is correct. In fact, you can expect the NDVI to range between 0.1 and 0.6 for an area with vegetation. On the other hand, clouds, water and snow have negative NDVI values as they have larger reflectance in the visible than in the near-infrared. Additionally, rock and bare soil have NDVI close to zero, as their reflectance is very similar in both visible and near-infrared.
Other satellite products also give information on vegetation status. You will see two LSA SAF products (EUMETSAT Satellite Application Facility for land, land-atmosphere interactions and biophysical applications):
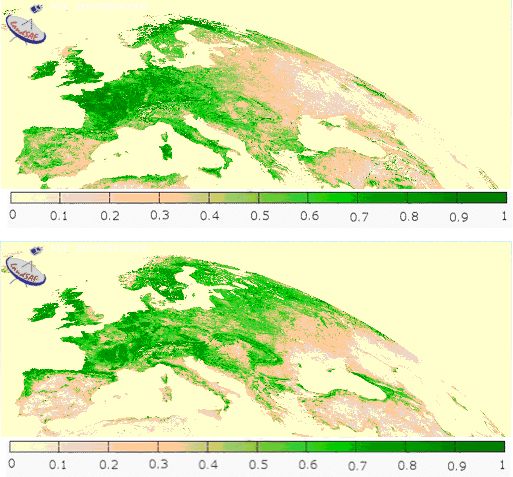
Fraction of Vegetation Cover
The Fractional Vegetation Cover (FVC) from Land SAF is a product derived for the MSG Seviri satellite channels. It gives the fraction of green vegetation per unit area on a horizontal surface. It is based on the different spectral signatures of vegetation and background on the MSG channels on the central wavelengths of 0.6, 0.8 and 1.6 μm.
In Figure 3.4 it is possible to evaluate FVC before and after the fire season of 2007, which mainly affected Italy and Greece. You can identify a drastic decrease in vegetation cover, to which fires have most likely contributed along with other reasons such as crops having been harvested or leaves drying out.
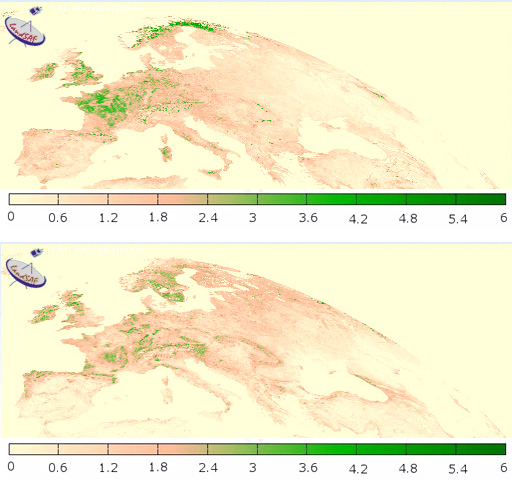
Leaf Area Index
The Leaf Area Index (LAI), also derived by Land SAF, is a dimensionless variable that accounts for the amount of leaves contained in a vertical column normalized by its cross-sectional area. It is derived from FVC, making use of parameterizations of the leaf albedo and the effect of canopy structure on radiation interception, which are dependent on the vegetation type.
Note that the decrease in vegetation that can be seen in the two images from May and August 2007 may not be completely related to the forest fires in Italy and Greece, as this period coincides with a natural decay of vegetation in these regions.