Burnt Areas
In addition to fire hot spots and smoke, satellite sensors are also able to detect burnt areas. Check the true color RGB image (0.66 μm; 0.55 μm; 0.47 μm) in Figure 5.34 (click to enlarge and play the animation) for an area in northern Portugal at the beginning of June 2006 (Fig. 5.35 and Fig 5.36).
|
|
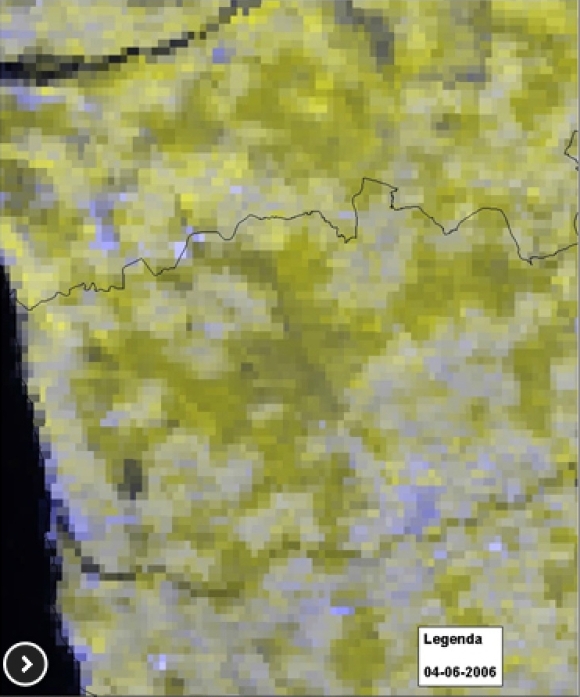
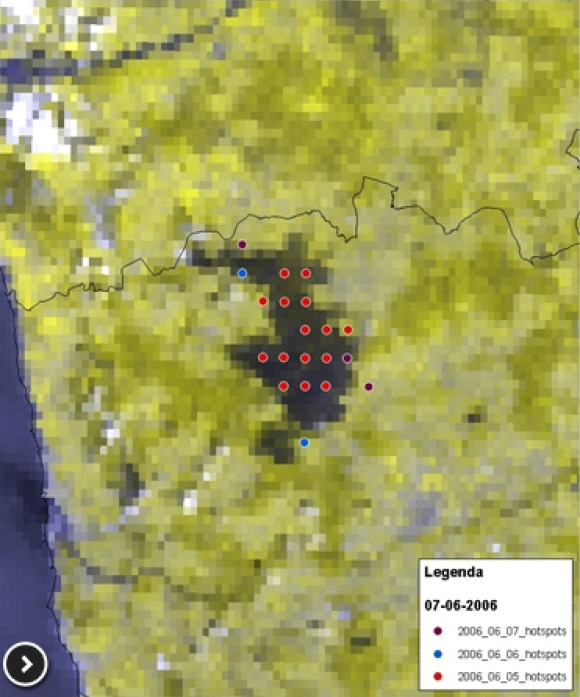
Fig 5.35 - True color RGB image from MODIS on 4 June 2006 before a series of forest fires and Fig 5.36 - True color RGB image from MODIS on 7 June 2006 after 3 days of forest fires over northern Portugal. Dots represent pixels where fires have been detected (hot spots): red on 5th, blue on 6th and purple on 7th June 2006 (Café and Tavares, 2008).
A change in the signature of the surface is clearly visible! The darker pixels correspond to a wide burnt area that resulted from several fires that took place over three days. The dots correspond to the hot spots (dots have different colors according to the day the fires occurred).
However, automatic detection of burnt areas is not straightforward. Did you know that warm burn scars from recent fires can be confused with cloud shadows in true color RGBs, like the one you see on the left in the image above?
In fact, aside from thresholds tests that depend on surface reflectivity, threshold tests with bands close to 3.9 μm and 10.8 μm may also be applied to distinguish cloud shadows from warm burn scars. For the warm burn scar (not an on-going fire!), the brightness temperature difference between these two bands [BT3.9 - BT10.8] is higher than for cloud shadows. Some scientists agreed on a threshold value of 6.5 K for this difference during experiments in Africa.
A burnt area product for the MODIS sensor has been in use since 2006 on a 500 metre spatial resolution. This product is based on an iterative algorithm with threshold tests. It uses bands 2 (841-876 nm), 5 (1230-1250 nm) and 7 (2105-2155 nm). Bands 2 and 5 are sensitive to burning and experience a decrease in reflectance after a fire. Band 7 is used as a reference since it changes less with burning.
For this MODIS product, threshold tests with bands 2, 5 and 7 may also not distinguish fire-affected areas from temporary changes. The changes may, in fact, be related not only to shadows, but also to undetected residual clouds or soil moisture changes. The MODIS burnt area algorithm uses a temporal constraint to solve this problem. Basically, it consists of tracking burnt area candidates on consecutive days and checking if an initial detection has future consistency.
Question
To see if you understood the basic concept underlying the (complex) algorithm, let's consider a simplified example with MODIS passes from 3 consecutive days over the areas A, B and C. For each of these days the algorithm's first-stage detection derives "no scar" or "scar candidate" for the specific area as seen below. Can you now connect each class to its corresponding area?
Before we go and start to look at some examples of satellite images with burnt areas you have to keep in mind the following:
 The
burnt area algorithm for MODIS makes use of many more days of
consecutive observations than the three days shown in this simplified
exercise that you just took. And of course cloud shadows are more
problematic with polar satellite observations than with 15 minute
images from a geostationary platform!
The
burnt area algorithm for MODIS makes use of many more days of
consecutive observations than the three days shown in this simplified
exercise that you just took. And of course cloud shadows are more
problematic with polar satellite observations than with 15 minute
images from a geostationary platform!