Smoke Spread within a Temperature Inversion
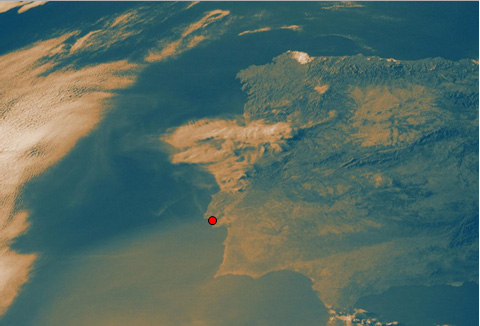
This happened on 4 August 2005 over Portugal - see Meteosat 8 HRV loop in Figure 4.2.
Fig 4.2 - Meteosat 8 RGB [HRV, HRV, IR10.8] animation over the Iberian Peninsula between 07:30 UTC and 13:15 UTC on 4 August 2005
The animation stops at 13:15 UTC. Can you guess what really happened afterwards?
Well, the fires kept on going during the afternoon, and later that day (around 5 hours after the last image of the animation of Figure 4.2) the sky became severely obscured by smoke and clouds as can be understood from the HRV image at 18:30 UTC (Figure 4.3).
On 4 August 2005, firefighting from the air (with airplanes and helicopters) had to be cancelled because of the drastic reduction in visibility. To confirm the existence of an inversion layer, please look at the tephigram from Lisbon at 12:00 UTC of that day (Figure 4.4).
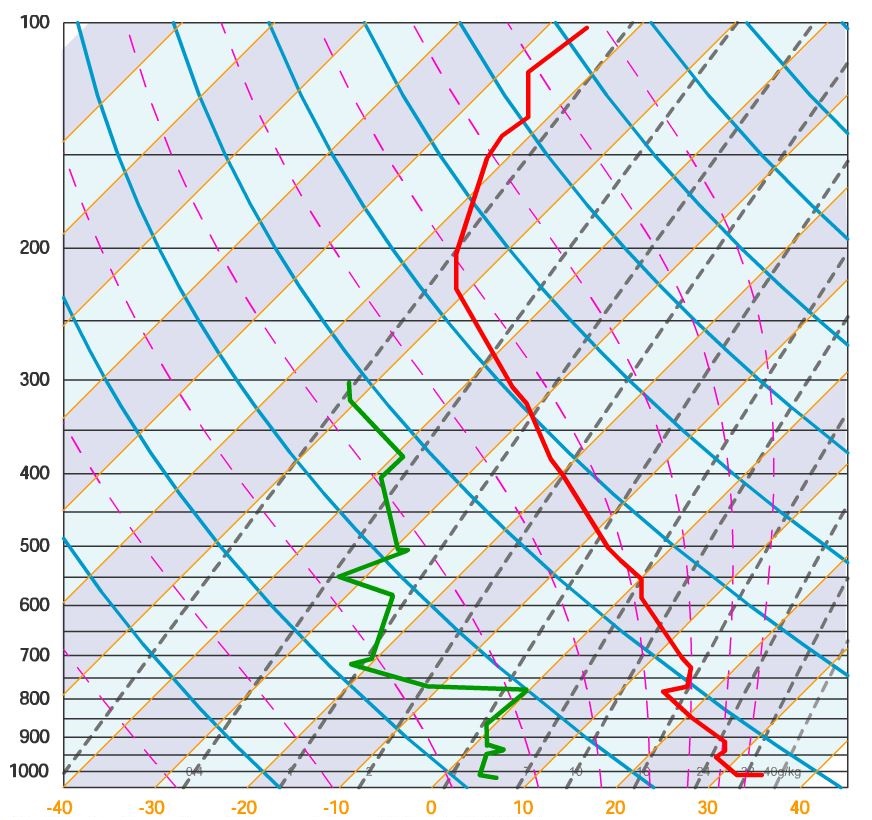
Fig 4.4 - Tephigram from Lisbon on 4 August 2005 at 12:00 UTC.
There are two inversion layers: one between 920 and 940 hPa (below 1000m) and another one between 760-770 hPa (around 2500m)!
The animation below is an imaginary scenario that will show you schematically what happens with smoke in combination with a radio sounding.
Fig 4.5 - Tephigram with temperature T (red) and dewpoint temperature Td (green).
We start from a stable situation with no remarkable inversion. In this situation the smoke slowly rises to the higher layers of the troposphere and dissolves.
As time progresses, an inversion settles around 700 hPa. As a consequence, the inversion functions like the lid on a boiling pan and ensures that the smoke is retained in the lower layers of the troposphere.