Aerosol Gallery
We now show you some examples of smoke clouds, pyrocumulus clouds and other products of aerosols and gases. Some of the examples are similar to ones seen before, but you can now look at them from a different perspective!
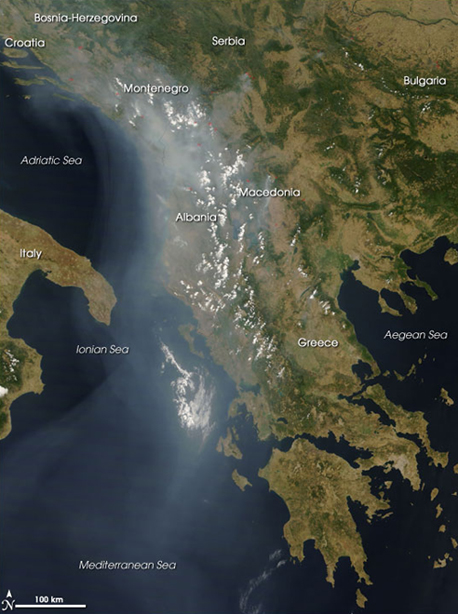
This first MODIS image taken on 29 July 2007 shows parts of Greece, Montenegro, Macedonia and Albania. Both fire smoke clouds and water clouds are seen in this image.
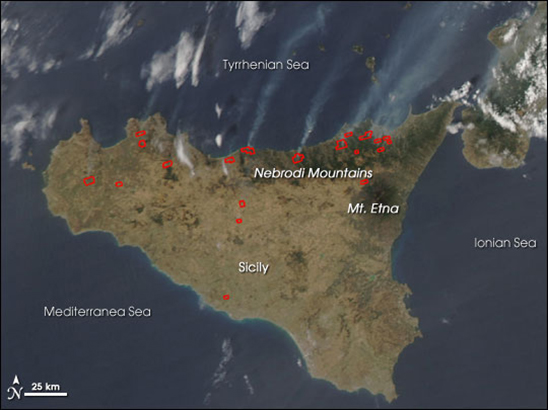
Smoke and fire product (polygons in red) over Sicily. The northward flow of the smoke indicates the wind direction clearly.
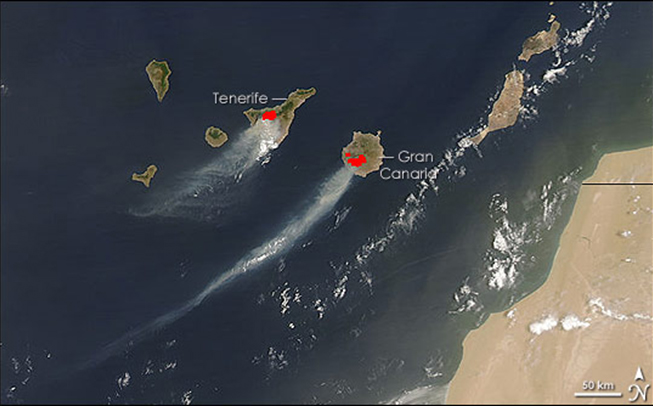
Smoke and fire product (polygons in red) over the Canary Islands in the Atlantic (namely Gran Canaria and Tenerife). A northeasterly flow over the Islands drags the smoke away from the fires. Note how there is a high contrast over sea and a low contrast over land, in particular in Tenerife.
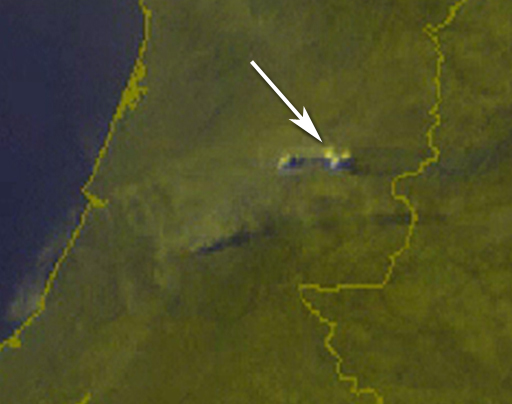
An example of Meteosat Second Generation. This RGB, which uses the HRVIS channel for red and green and IR10.8 for blue, shows a smoke cloud towards the center of the image and immediately northeast some pyrocumulus clouds (white arrow).
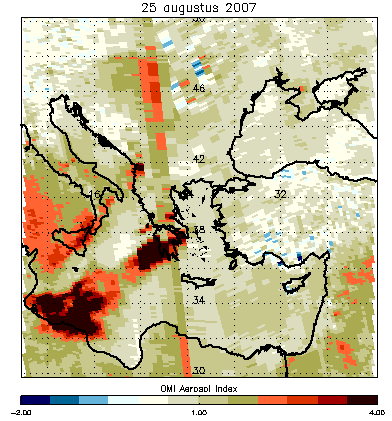
This image of the aerosol index measured by the OMI (Ozone Monitoring Instrument) instrument on 25 August 2007 clearly shows the soot of the fires blown from the Peloponnesus in Greece to Libya.
NO2 column density (in 1015 molecules/cm2) from the OMI (Ozone Monitoring Instrument) sensor onboard NASA's AURA-satellite from 23 to 26 August 2007 (during the forest fires in Greece). NO2 (together with formaldehyde) is a gas released by burning biomass and was detected over Greece and also downwind, even in the coast of Libya.
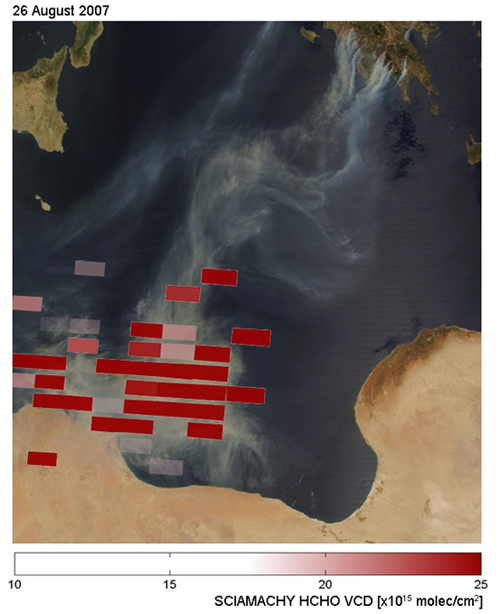
An example of formaldehyde concentration on 26 August 2007, derived from the SCIAMACHY sensor onboard ESA's ENVISAT satellite. Formaldehyde (together with NO2) is a poisonous gas released by biomass burning and was detected off the coast of Libya. Note also that, again, the smoke in the background image has more contrast over sea than over land.
Question
Up to now we have been analyzing forest fire remote sensing from satellite platforms as they provide a wide spatial coverage. But before finishing this chapter, you should be aware that forest fires are also usually tracked/sensed from the ground. So, as a final question in this module, try to guess which other instruments/platforms can forest fire signatures be sensed with:
The correct answer is F.
All of the above platforms may be used or have been found to provide useful information.
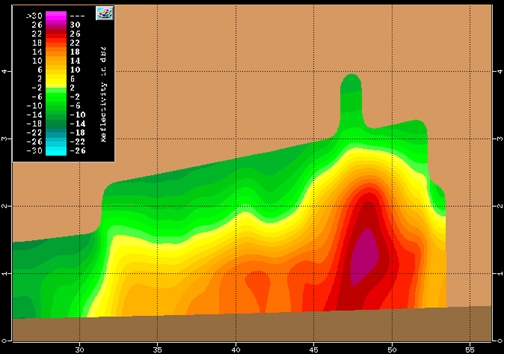
One instrument you might not immediately think of for the purpose of monitoring forest fires is radar. However, experiences from the Portugese Meteorological Service have shown that it can be of use. In the example you see here (Figure 5.32), a Maximum Reflectivity (Max Z) radar image is showing two fires under a northerly flow in central Portugal on 20 August 2007. In this case, higher values of reflectivity are caused by ash particles and not by hydrometeors!
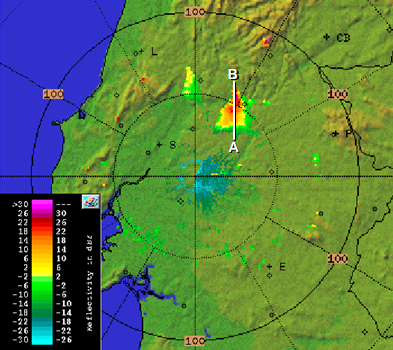
A cross section is retrieved in a north-south direction (see white line) as seen from the east. You can see how a stronger signal is found right from the surface up to around 4 km, in the location of the fire (Figure 5.33).