Hot Spots Gallery
In this section we will show you a gallery on how remote sensing helps to detect hots spots.
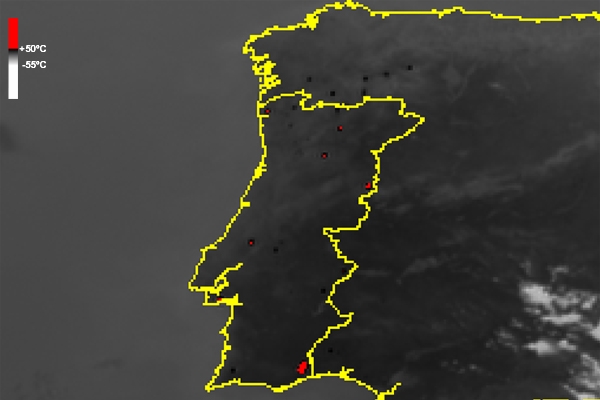
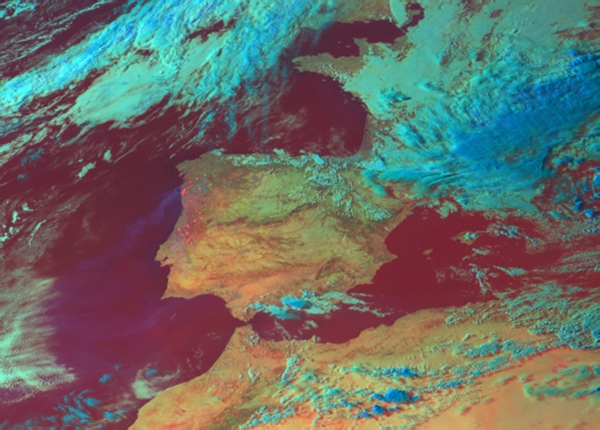
This Figure is an example of an IR3.9 image over Portugal and part of Spain, with hot spots in red, where the brightness temperature exceeds the threshold of 50 ºC.
Although it may seem a promising image for detecting fires, in fact it does not distinguish fires from hot land during the day as we see in the this example of a hot summer day (Fig 5.8).
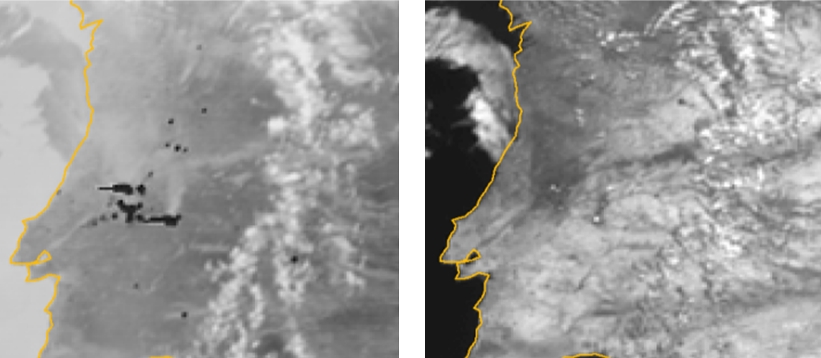
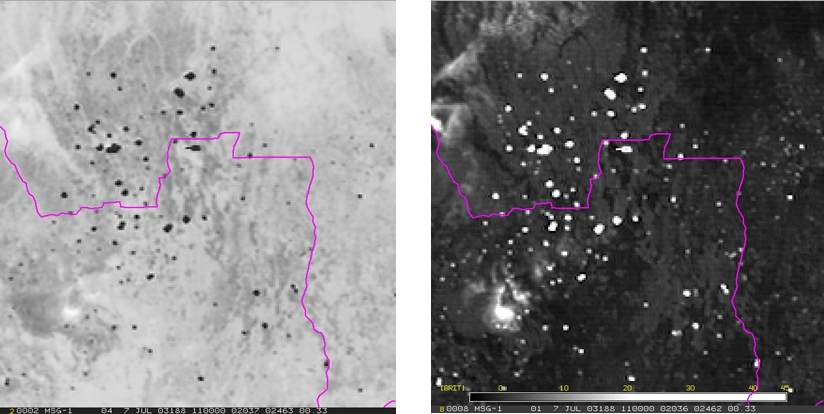
Two Meteosat 8 images are shown here. On the left there is the 3.9 µm (inverted image) and to the right the near-infrared 1.6 µm. Most striking in the 3.9 µm image are the hotspots associated with the fires (darker pixels). A closer look even reveals some smoke swirling northward from those pixels. If fires are too hot they may even be detected using 1.6 µm. In this example, only a few pixels with high radiance values (white pixels) are identified at 1.6 µm, while the number of pixels in the 3.9 band is much larger (number of dark pixels). Note the hot spot color is different in the images, as the IR3.9 is inverted and the NIR1.6 is not!
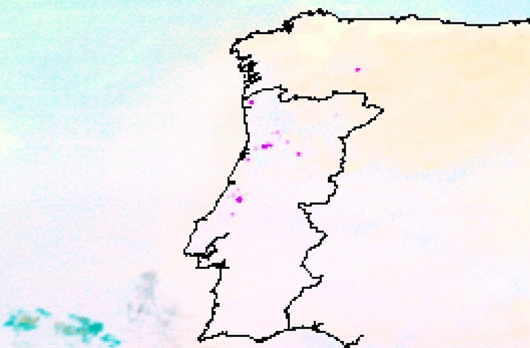
Figure 5.10 shows the
so-called Night Microphysical RGB where the range and gamma values are
defined to depict fire pixels in magenta.
The magenta color results from high values on the red
and blue beams and low values on the green beam. The key beam is in
fact the green - less and less green is obtained when IR3.9 brightness
temperature increases and steps away more and more from the IR10.8
brightness temperature (up to a maximum difference of 15 ºC). Also, the
air has to be very dry, so the difference between the brightness
temperatures of IR10.8 and IR12.0 is close to 0 (maximum of red), and the
fire pixels have to have a brightness temperature of at least 20 ºC in
IR10.8 (maximum of blue). These two final conditions are peanuts for a
fire event, right?
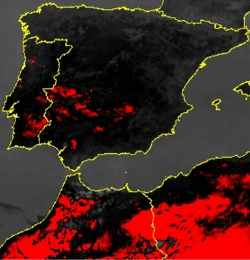
In
Figure 5.11 one can see the construction of the so-called Fire RGB
which uses the VIS0.6, HRV and IR3.9 channels. In the ultimate RGB the
fires themselves appear as red dots. A close look also shows the smoke
which was swirling over the Atlantic Ocean on that day.
During
the night there is no contamination of the IR3.9 band by solar
radiation. Naturally, this is not the case during the day, which makes
it more difficult to detect hot spots. However, there have been case
studies where some RGBs have been successfully used to detect hot spots
subjectively
during the day. The image shows the hot spots over northern and central
Portugal on a day during the devastating 2005 forest fire season.
Here is a case of fire hot spots over Congo and Angola. The fires are depicted in both the single IR3.9 image and the difference IR3.9-IR10.8 image.
The
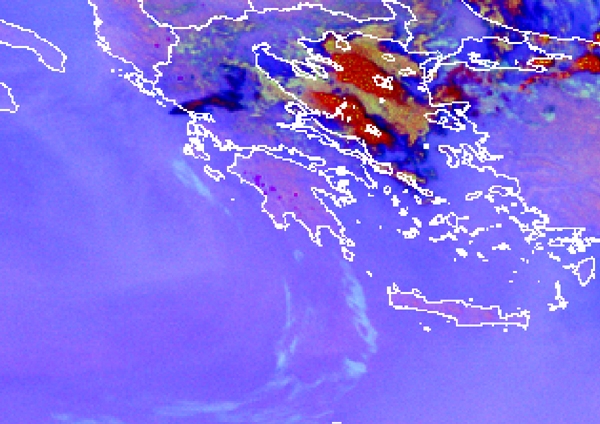
following two examples are from Greece during the last week of August
2007, when large parts of the Greek countryside - from the island of
Evia north of Athens to the Peloponnese in the south - were ravaged by
some of the worst wildfires in living memory.
The locations of fires and smoke can also be seen with the METOP satellite using the AVHRR instrument.
Another RGB image which uses most of the thermal channel (which makes it possible to also monitor fires at night). The hot spots themselves are seen as small red dots in the center of the image.
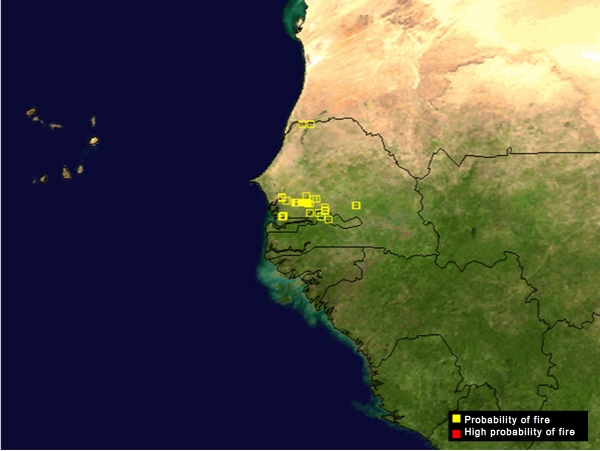
Figure 5.15 is again the EUMETSAT fire product which was also presented in the beginning of this chapter. In this case a zoom is made over western Africa, where pixels with a probability of fire are found over Senegal and Gambia during the summer of 2008.
The Fire Detection & Monitoring product from the LSA SAF (Fig. 5.16) is a pre-operational procedure that allows detecting active fires based on information from MSG-SEVIRI. The procedure takes advantage of the temporal resolution of SEVIRI (one image every 15 minutes), and relies on information from SEVIRI channels (namely 0.6, 0.8, 3.9, 10.8 and 12.0 μm) together with information on illumination angles. The method is based on heritage from contextual algorithms designed for polar, sun-synchronous instruments, namely NOAA/AVHRR and MODIS/TERRA-AQUA. A potential fire pixel is compared with the neighbouring ones and the decision is made based on relative thresholds as derived from the pixels in the neighbourhood.
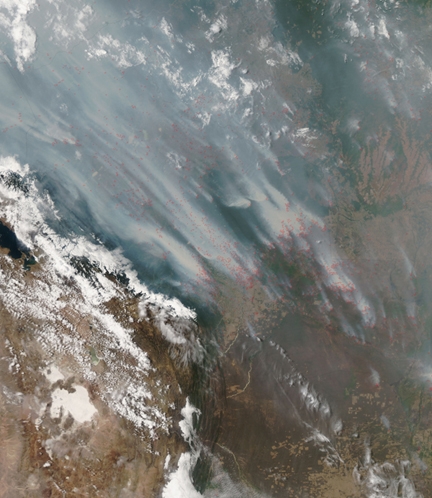
Hundreds, possibly thousands of fires (locations marked in red) were burning in South America when the Moderate Resolution Imaging Spectroradiometer (MODIS) on NASA's Aqua satellite passed overhead on 25 September 2007 and captured this image. The most intense fire activity was in Bolivia, where fires are concentrated in the Santa Cruz Department, in the southeastern part of the country. Thick smoke hangs over much of the scene. The towering Andes mountains (lower left) partially block the flow of smoke to the west.
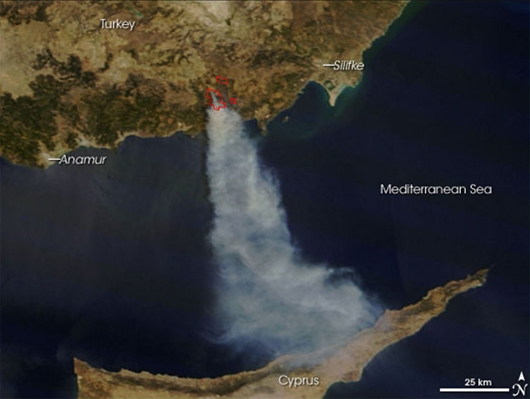
The MODIS fire product mentioned earlier is very well suited for the detection of hotspots in a higher resolution than those obtained from geostationary platforms such as the MSG. This is an example of the MODIS fire product in southern Turkey, in which the hotspots are plotted in red polygons. These are superposed on a composite image using three bands from the visible region of the spectrum. In the image, the smoke generated by the fire is also clearly visible as it is being driven southward and reaches Cyprus.
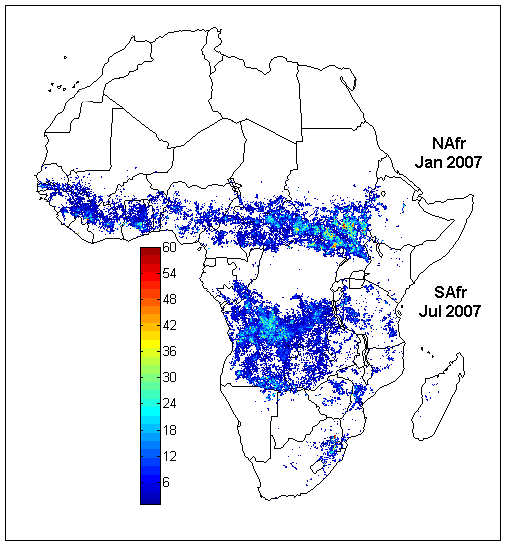
Although it might be easier to identify small/weak forest fires with a polar orbiter satellite, like is the case of MODIS, the high temporal frequency provided by geostationary observations enables to follow the life cycle of the identified fires. An example of this is provided by fig. 5.19 showing the temporal behaviour of the wild fires over the Sahel region for 2 weeks in 2004 as captured by a fire product derived from Meteosat 9, the Fire Radiative Power (in short, FRP) (on the left axis). This product is also being computed by the LSA SAF. As you can see, the temporal behaviour of the fire activity is very well captured by the high SEVIRI revisiting time (15 minutes). The colors represent different land covers; Mosaic Forest, Savanna and Deciduous woodland have the most pronounced diurnal cycle of the fire activity.

The previously mentioned Fire Radiative Power (FRP) product from LSA SAF corresponds to the amount of radiant heat energy of a fire per unit time. It is measured in megawatts every 15 minutes on a pixel basis, being currently in a pre-operational status. The example showed in Figure 5.20 is for the fires over Greece on 25th August 2007 at 09:45 UTC. Note that this product can be extremely useful as it was found to be related to the amount of fuel consumed by fires.
There is another related product that will become available in 2012: the FRP grid, which will estimate hourly averages of FRP within 1º longitude times 1º latitude boxes. The FRP grid will also benefit from a correction for small fires that go undetected by SEVIRI and for potential cloud contamination. These corrections are based on statistical analysis performed for each box and the user will access both the end product and all correction factors applied. Other main ancillary pieces of information stored in the product include the percentage of burnt area and the average number of detected fires per grid box.
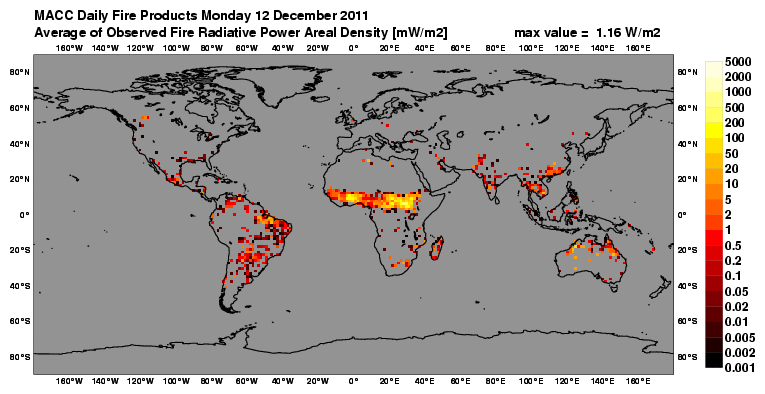
Figure 5.20 presents the thermal radiation coming from actively burning vegetation and other open fires for 12 October 2011. The data is derived from SEVIRI (LSA SAF) and MODIS (NASA) and calculated as daily averages of FRP in 125 km grid cells [mW/m2]. This (daily average) FRP areal intensity data is computed within the D-Fire subproject, which provides data of global emissions from biomass burning that are used as model input for smoke distribution forecasts (organic matter, black carbon and sulfate aerosols). The emissions are calculated in real time and retrospectively from satellite-based observations of open fires (for example wildfires and human-ignited grassland and forest fires).

The left panel shows the fire intensity observed by the SEVIRI instrument in terms of fire radiative power (FRP per unit area at 25 km resolution, reddish color bar) and the optical depth of the simulated resulting smoke aerosols (AOD, bluish color bar) for 26 and 27 August. Images on the right show concurrent MODIS observations; the simulations and observations of the Greek fire plumes display very similar shapes. (source: landsaf.meteo.pt)