Radar
Unfortunately when this case happened in October 2007 over Mallorca no radar was (yet) available on the island. To follow and monitor the convective system we will rely on the radar images from three stations of the Iberian mainland, namely Valencia, Murcia and Barcelona.

Figure 3.1: Radar layout of east coast of Spain with the three radar stations Murcia, Valencia and Barcelona. Since 2008 also a radar is available at Mallorca.
Murcia Radar - Time sequence - Flash material not existing
From this sequence we can have an idea about the first stages of the convective systems life. Despite the fact that the main radar core velocity field is not seen by Murcia radar, because it is out of range, there are some indirect indicators that tell us the system could have been a supercell during some time of its youth, but we can not be sure of this at all, as no radar derived wind information is available.
Valencia Radar - Time sequence - Flash material not existing
From 1310 UTC to 1510 UTC the best viewer among the available radars, was the one located at Valencia. During this period a very intense (reflectivity cores above 60 dBZ) bow echo structure was formed that finally reached Mallorca Island at 1530 UTC.
Barcelona Radar - Time sequence - Flash material not existing
The Mesoscale Convective System arrived in Mallorca Island at around 1530 UTC. The radar situated in Barcelona showed the best reflectivity view for this time. This sequence shows the passage of the system through the island.
Vertical Integrated Liquid Water - Flash material not existing
Radar derived Vertical Integrated Liquid water, VIL, is one of the key products for severity watching purposes. In Figure 3.2 the VIL values from Murcia radar for 1100 UTC is shown.
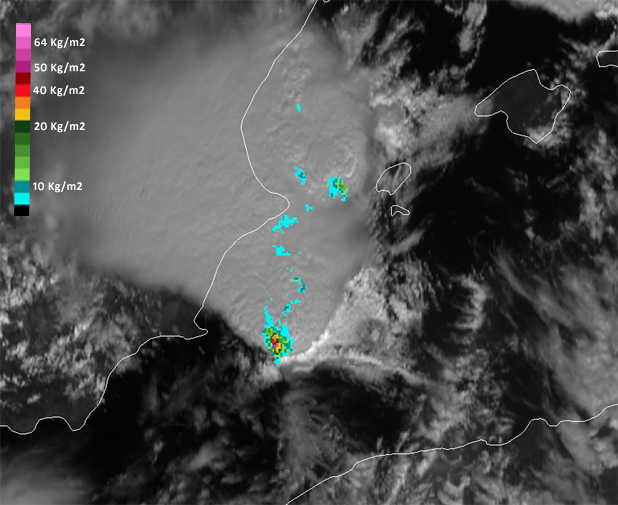
Figure 3.2: Vertical Intergated Liquid Water derived from Murcia Radar for 4th October 2007 1100UTC overlayed on the corresponding Meteosat 9 HRVIS image.
It shows which can be the most active part of the convective system, in terms of severe surface weather potential, by the time when it showed more clear supercell signatures.
Verify yourself that the percentage of area covered by the VIL high values is quite small compared to the size of the system from a satellite perspective. The main VIL core in the image, as a first guess, could also be considered the area with the highest precipitation rates at the at the surface or even large hail.