Introduction
This chapter will present you a range of satellite images from MODIS and Meteosat 9 and a combination of these images with a set of basic and derived ECMWF parameters. Starting of which please have a look at the following MODIS image of 4th October 1143UTC. A mesoscale convective system can be seen in Figure 2.1 (Click to enlarge). The radar imagery (see radar chapter) suggest the presence of a Supercell thunderstorm in the southern flank of the MCS during its initial phase. A close look of Fig 2.1 even reveals some eminent signs of the severity of this cell as overshooting tops and some resulting gravity waves are visible. Towards the southern edge of the cell we can identify a fierce V-shaped structure.
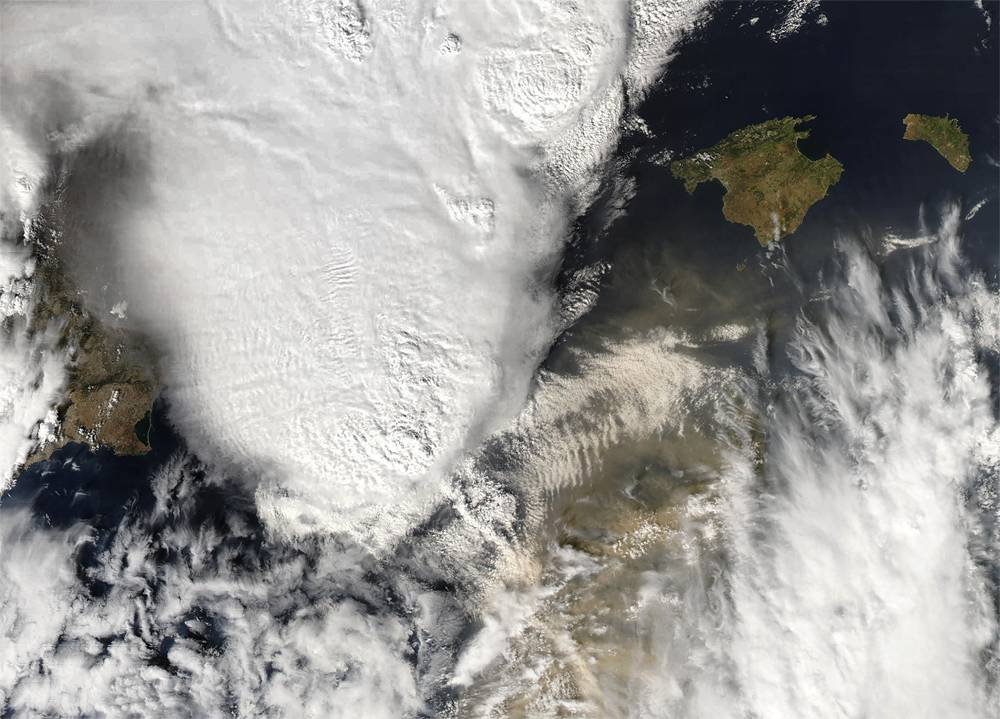
Figure 1: Modis image of 4th October 2007 1143UTC. The convective cell is evident at this stage with associated overshooting tops and due to the inflicting perturbation at the upper layers of troposphere also some gravity waves are seen.
Although we look at a static image it is possible to recognise different air masses. Each having its own characteristic helping us to solve the puzzle together to explain why the developments were so explosive.
- The image reveals there is a low level flow coming from the east "feeding" the MCS. This is best seen by the gravity waves observed east of the system.
- On mid-level flow a thickness ridge cloud from the Sahara is observed. It is observed a thick patch of clouds on the far right side of the image. Flanked by a dust cloud from the Sahara it is a sign of the southerly flow.
- The dust cloud also is the cause for a capped inversion. Continental African mid-level air over Mediterranean colder air, is supposed to produce a strong capped air mass, to the east of the MCS.
In the next three subchapter we will start to look at the different animations of satellite images and combine them with NWP.