General information: 1st July 2004:06UTC
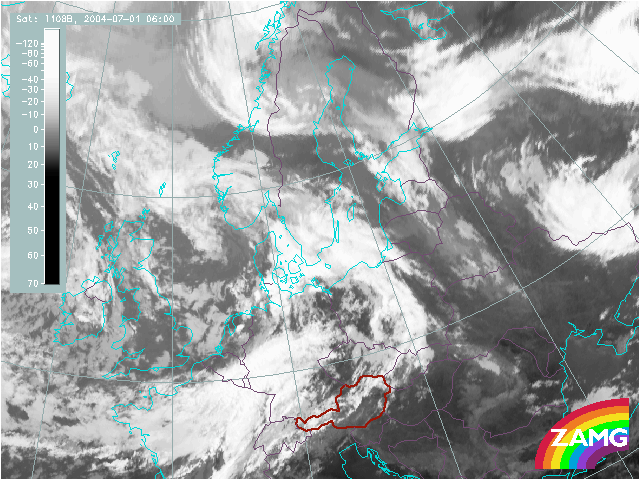
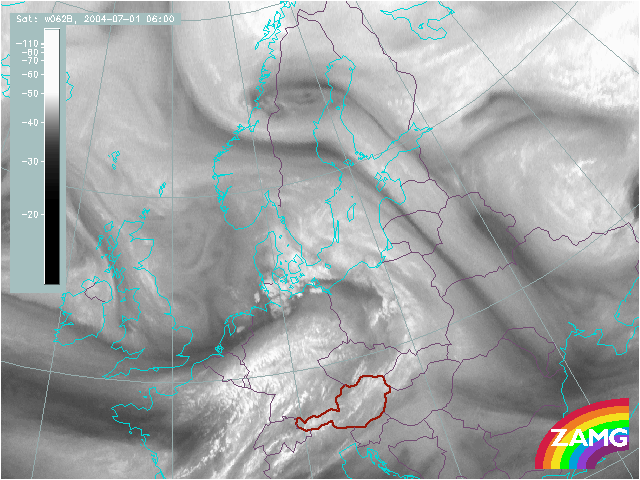
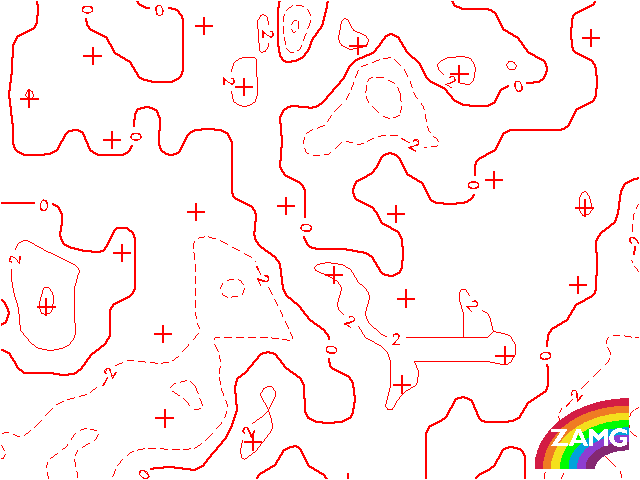
In the satellite image of July 1st: 06UTC, West-Europe is overcasted by a frontal system, dominating the weather. The occlusion cloud spiral of the system is still over the Atlantic and can not be seen in this image. Between Norway and Scotland the onset to a secondary cloud spiral is seen. Its evolution is also nicely pictured in the following images. The Cold Front, on which the 1st Wave will develop, can be seen over Germany. Over the course of day the Cold Front will see a fast North-Eastward displacement and enhancement. At the time being there seems to be a weaker cloud area like an interruption between a N-S and a W-E oriented part of the cloud band.
Geopotential Height 1000 hPa.
Concentrating on the features belonging to the Cold Front under discussion, the most striking feature at this point of time is the intensive surface trough which accompanies the North-South orientated part of the Cold Front. The West-East orientated cloud band which will approach and merge later does not show any surface trough.
Geopotential Height 500 hPa.
There is a large upper level trough behind the CF cloud band over England and the Northsea in the area of cold air cloudiness.
Temperature Advection
This is the initial stage of the case study. No Waves have been recognised in the satellite images, nor in the geopotential height at the surface. The isolines of the temperature advection (TA) follows the rear side of the North-South orientated part of the Cold Front cloud band, while the West-East orientated part, merging with Cold Front at a later stage, is mainly under CA. An interesting area is the WA maximum found over the border between France and Germany. It demonstrates a typical Wave situation.
PVA 500 hPa.
Both PVA max, in particularly in the area of interest, over Denmark and Germany show the NE-ward displacement of the upper level trough (See Hgt 500 hPa.)
Isotachs and PVA 300 hPa.
The following set of images will explain the difference between the first and the second Wave in respect to the rate of their development. When a Jet Streak crosses a frontal zone with a large acute angle an increase of cloudiness as a consequence of PVA in the right entrance and left exit region of this crossing jet streak can be observed. In this case, and in the relevant fronts, there are very dominant jet streaks over the Atlantic reaching Britain and along the northern edge of the CF band mainly over Germany. The later jet streak consists of two small scale maxima. There is one PVA maxima over France, which is partly in the right entrance region, and a second PVA maximum can be found over Poland, situated more in the left exit region. Both PVA maxima are in areas of intensifying clouds. But for both maxima it seems to be clear that also curvature connected to an upper level trough is the main reason.
Height of PV=1
The high gradient of the isolines manifest the frontal area. Two parts show a deeper down intrusion of stratospheric air.
1) Behind the frontal system over the Northsea.
2) Over northeast Germany and Poland, which is the area of double structure in the frontal system.
Surface Observations
All the weather events are represented by a colour-symbol where green represents rain and showers; blue: drizzle; orange: hail; red: thunderstorm with precipitation; black: no actual precipitation. In this first phase where the Cold Front cloud band is formed from an older North-South orientated and a newer West-East orientated part the main precipitation is in the Cold Front area over Germany.