Observational data
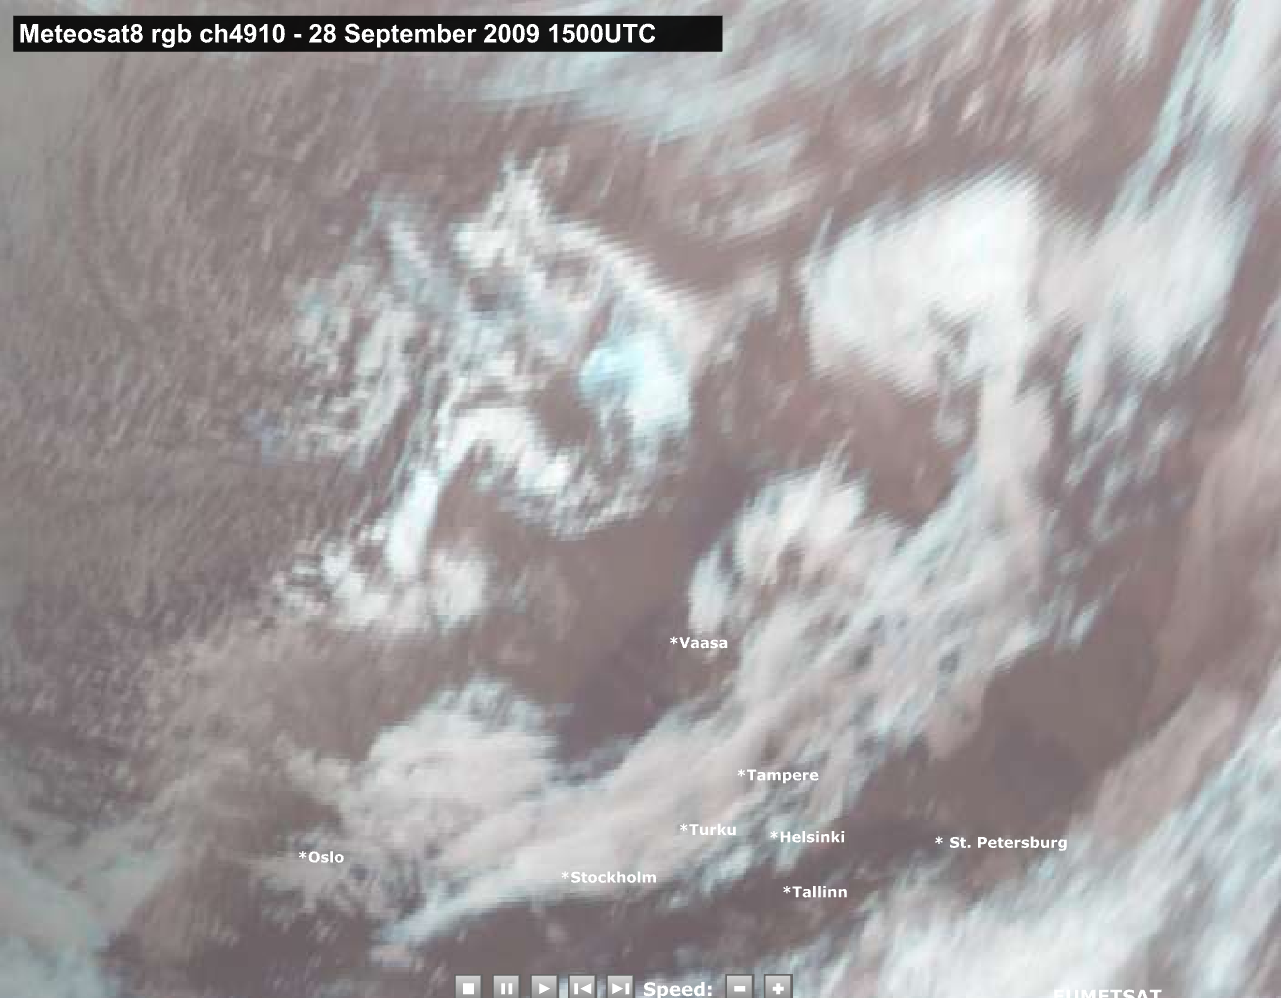
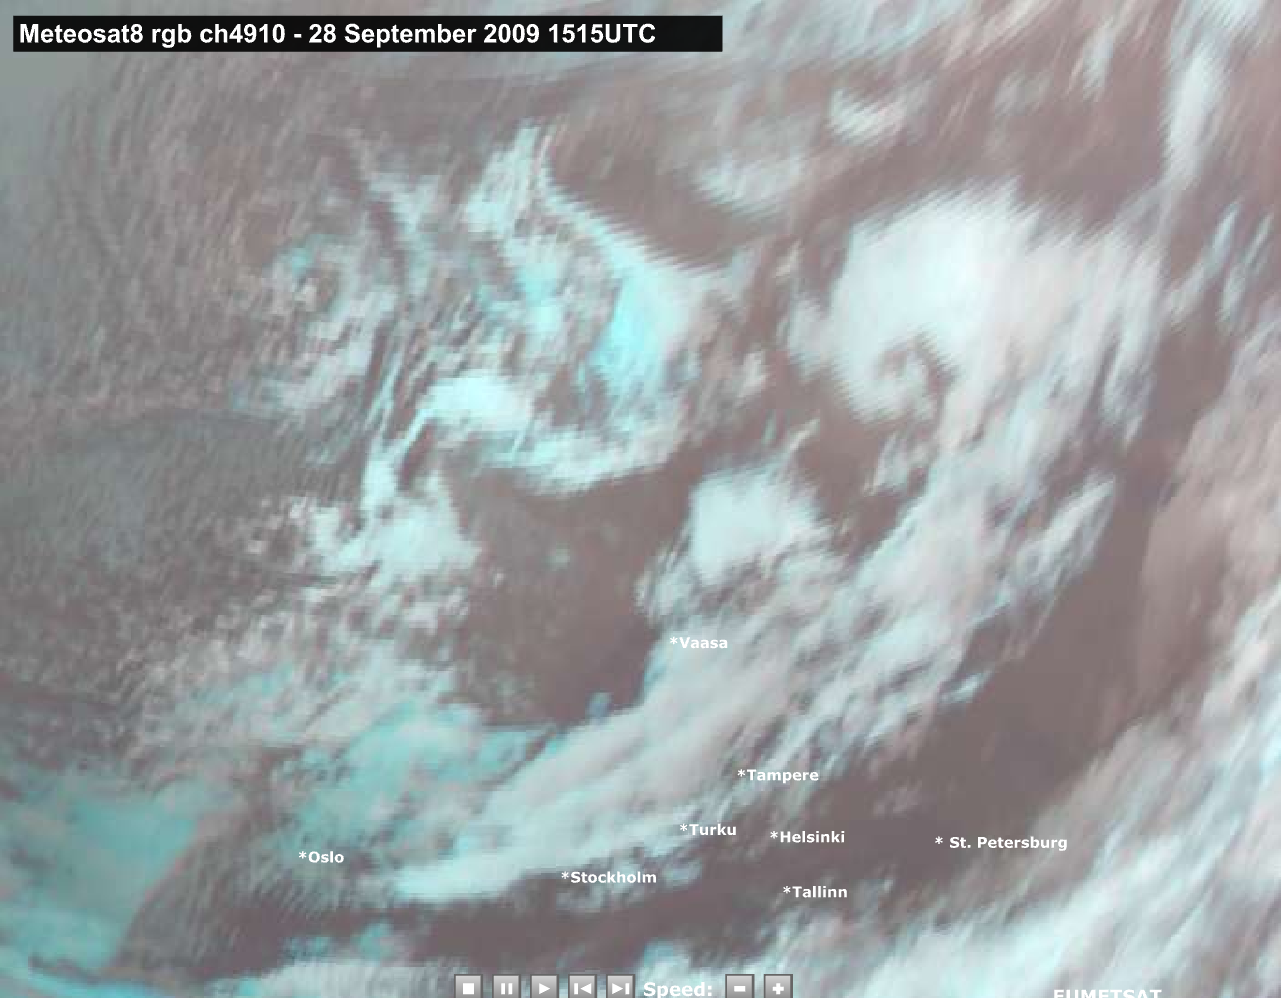
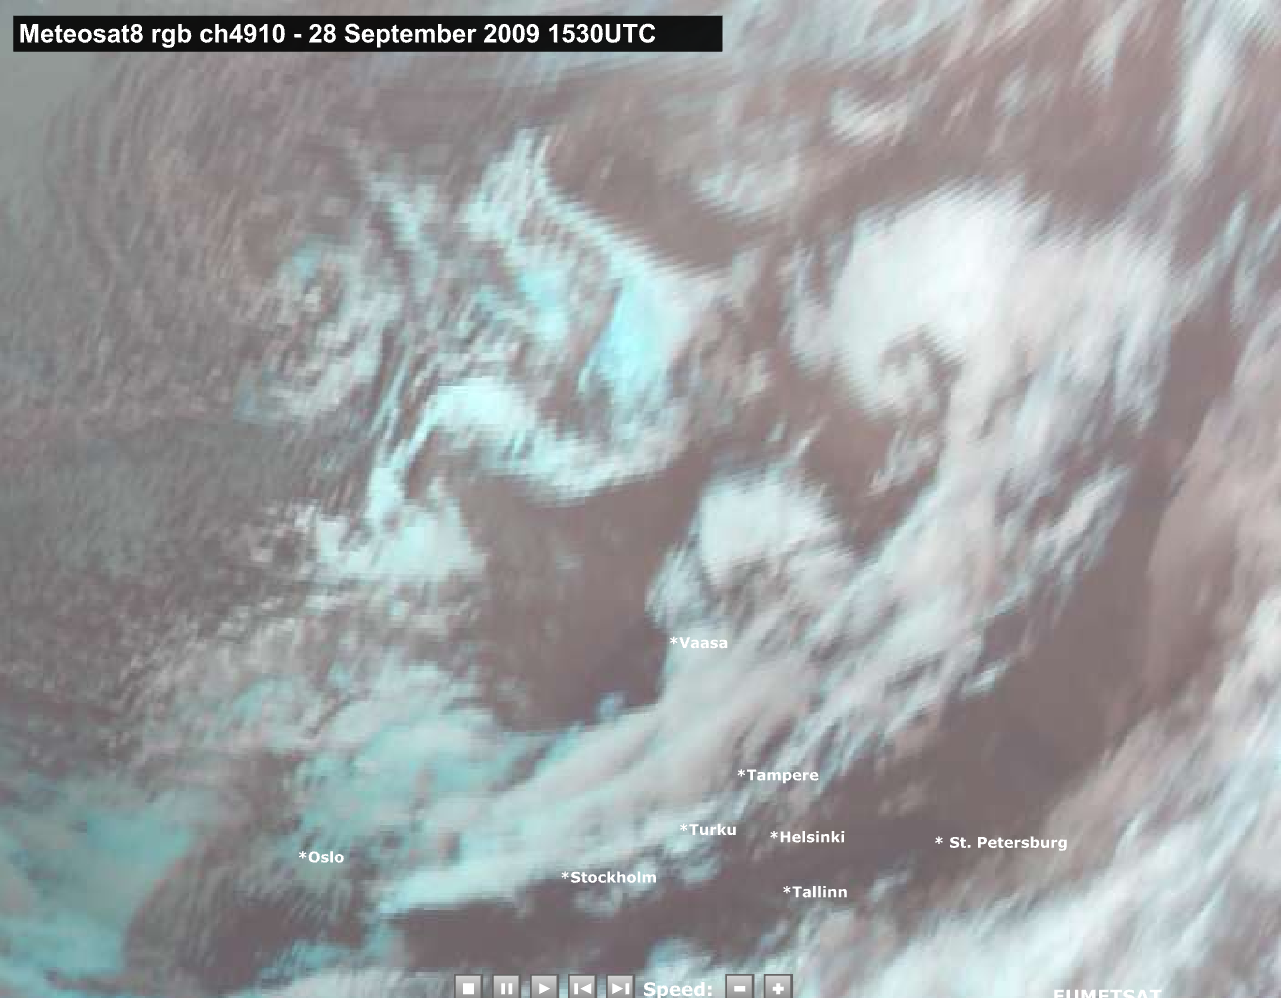
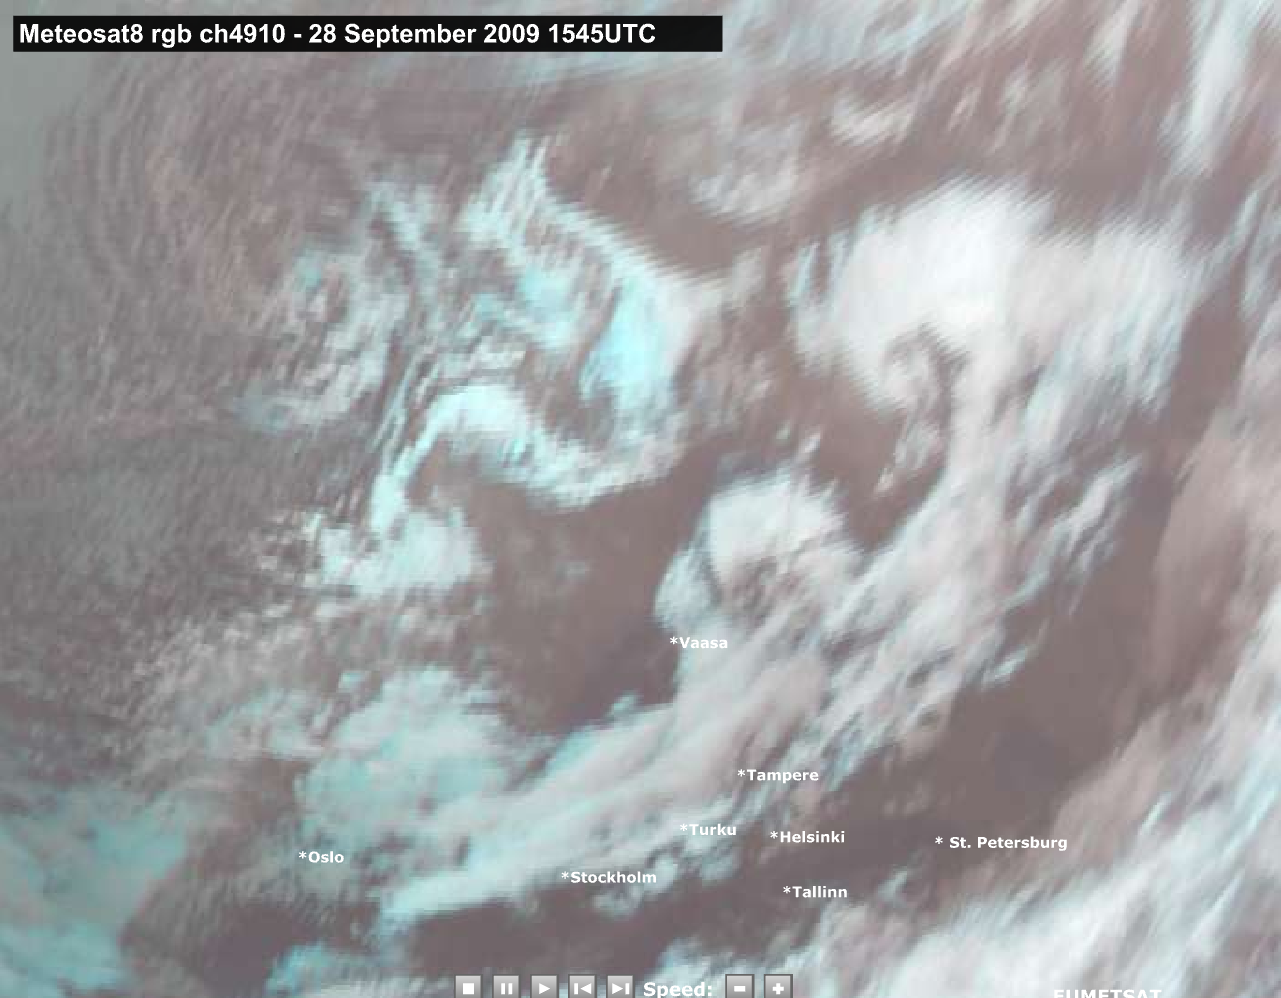
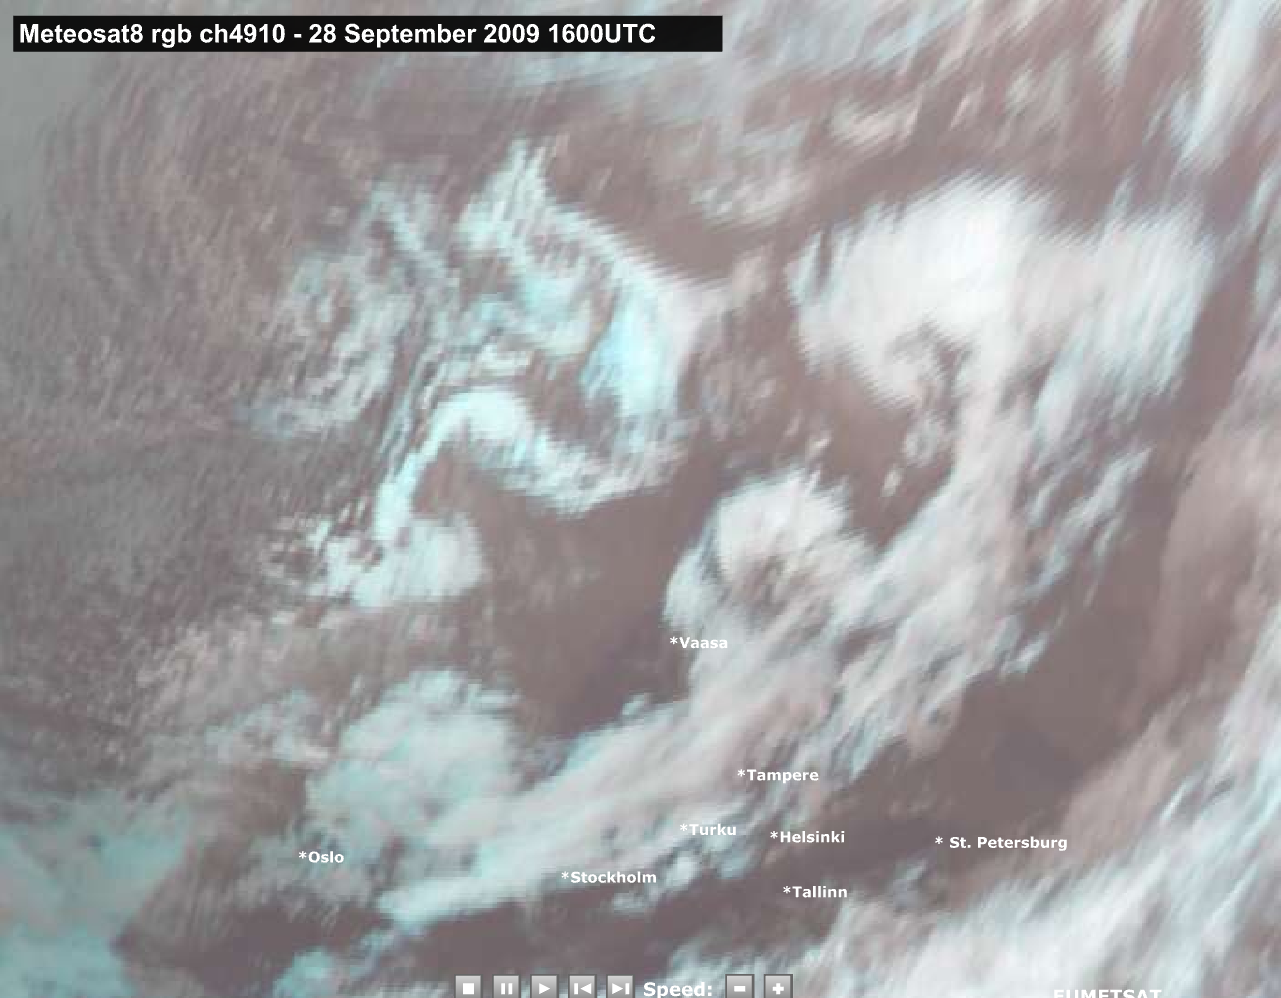
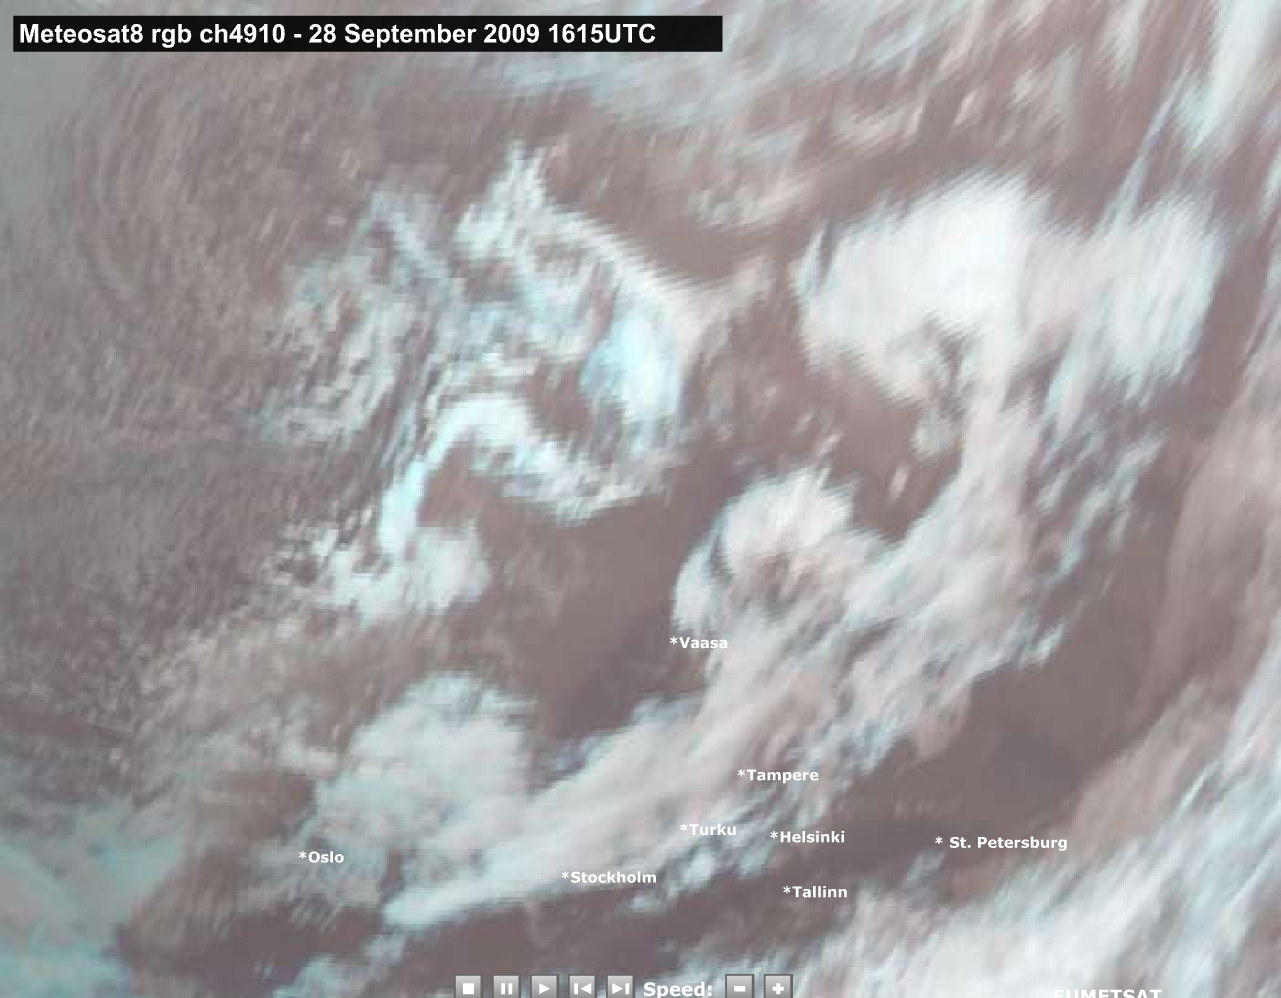
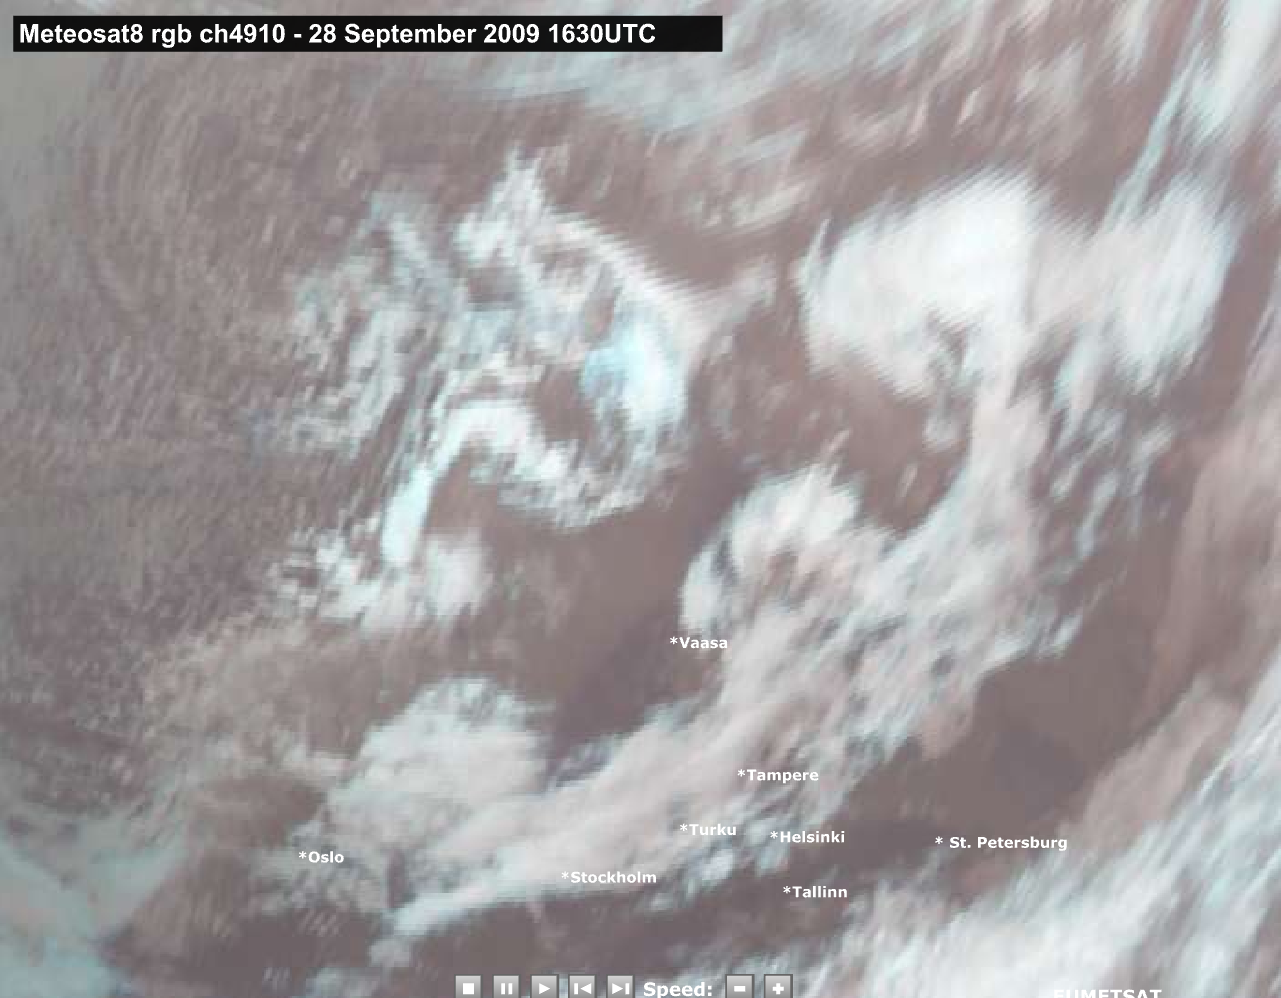
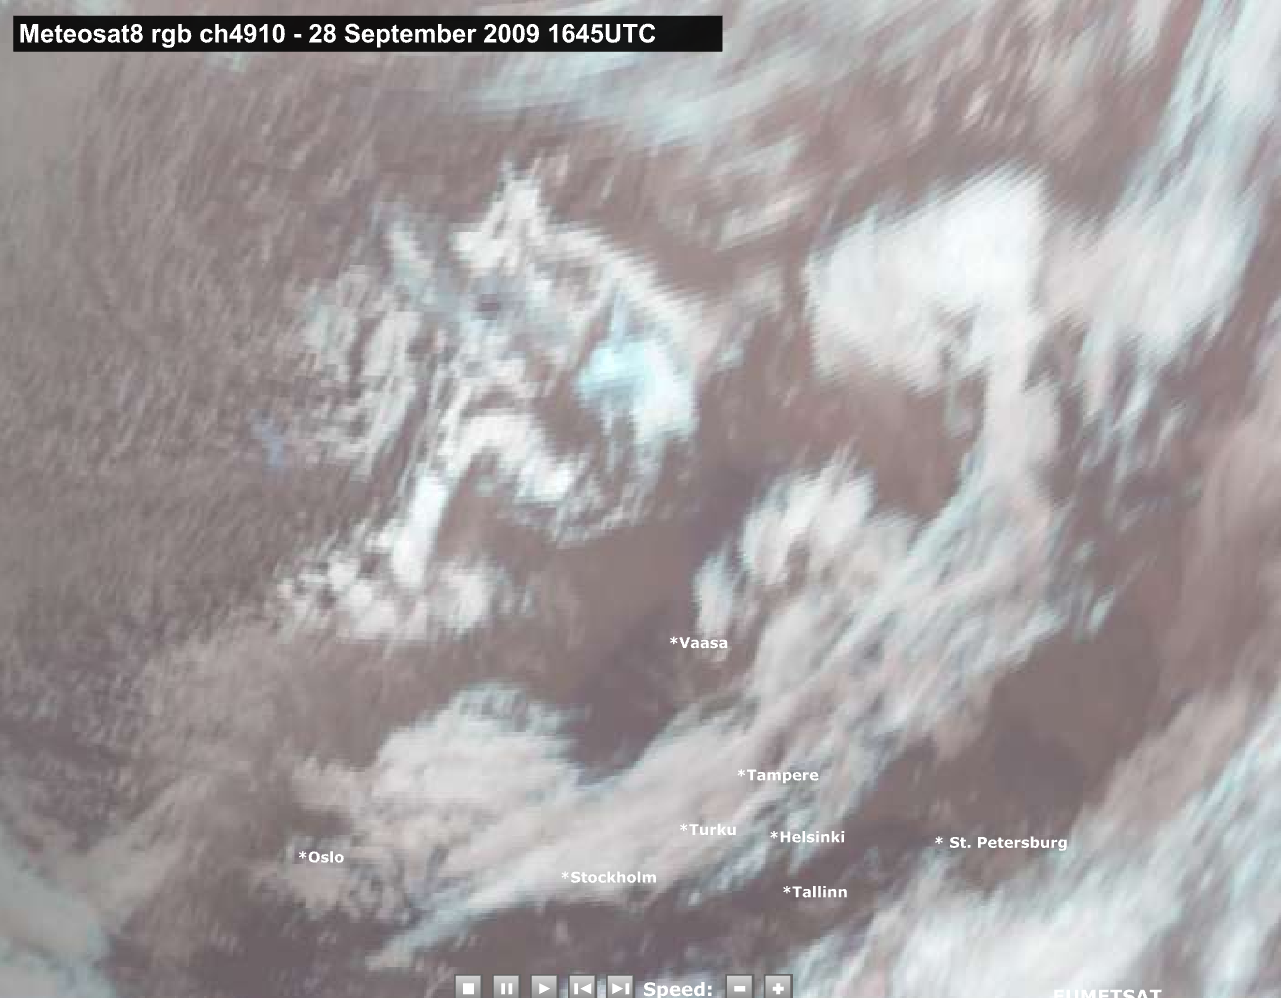
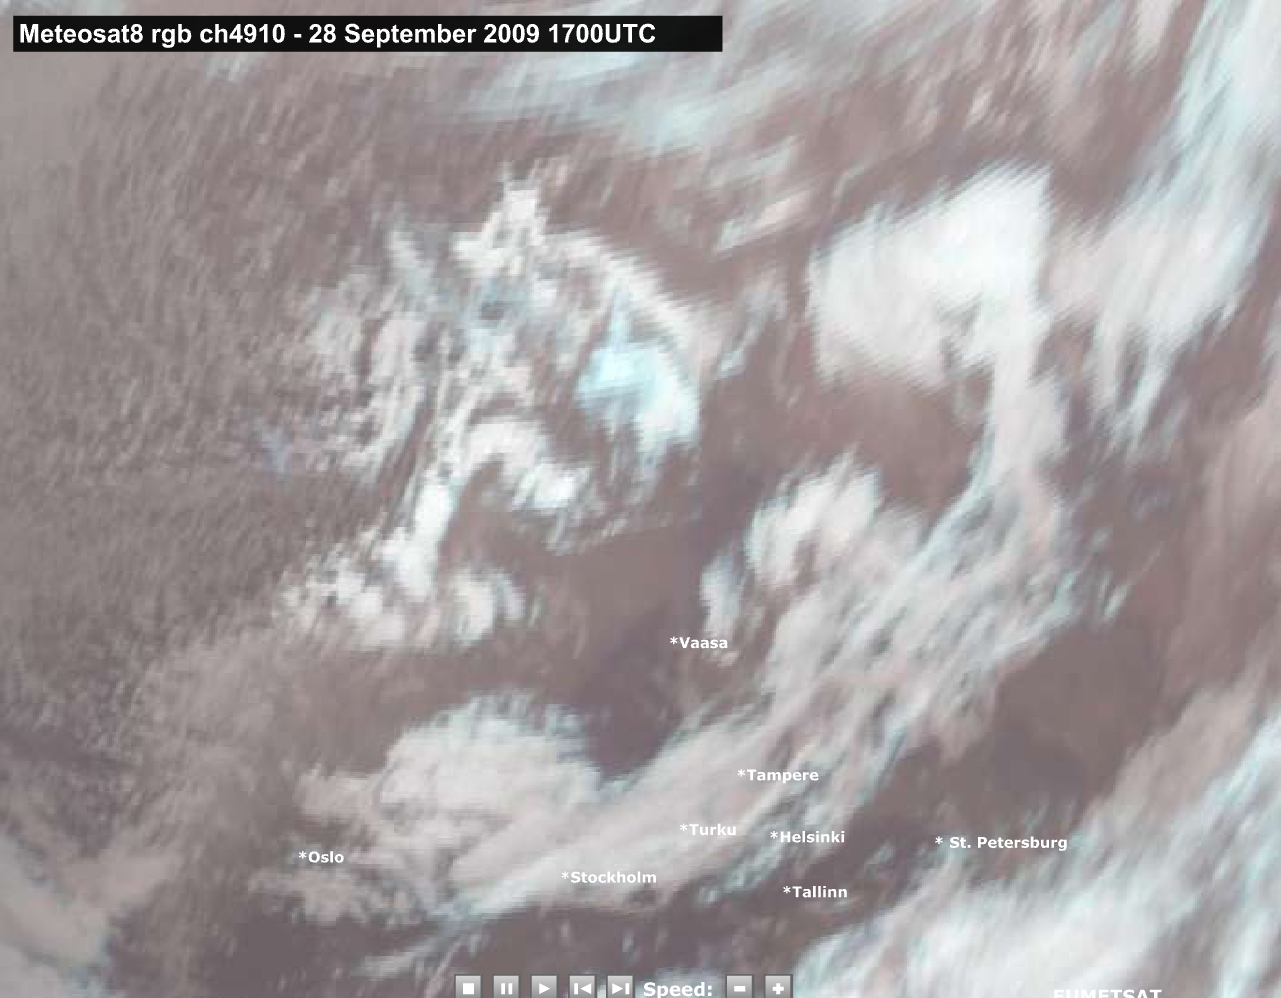
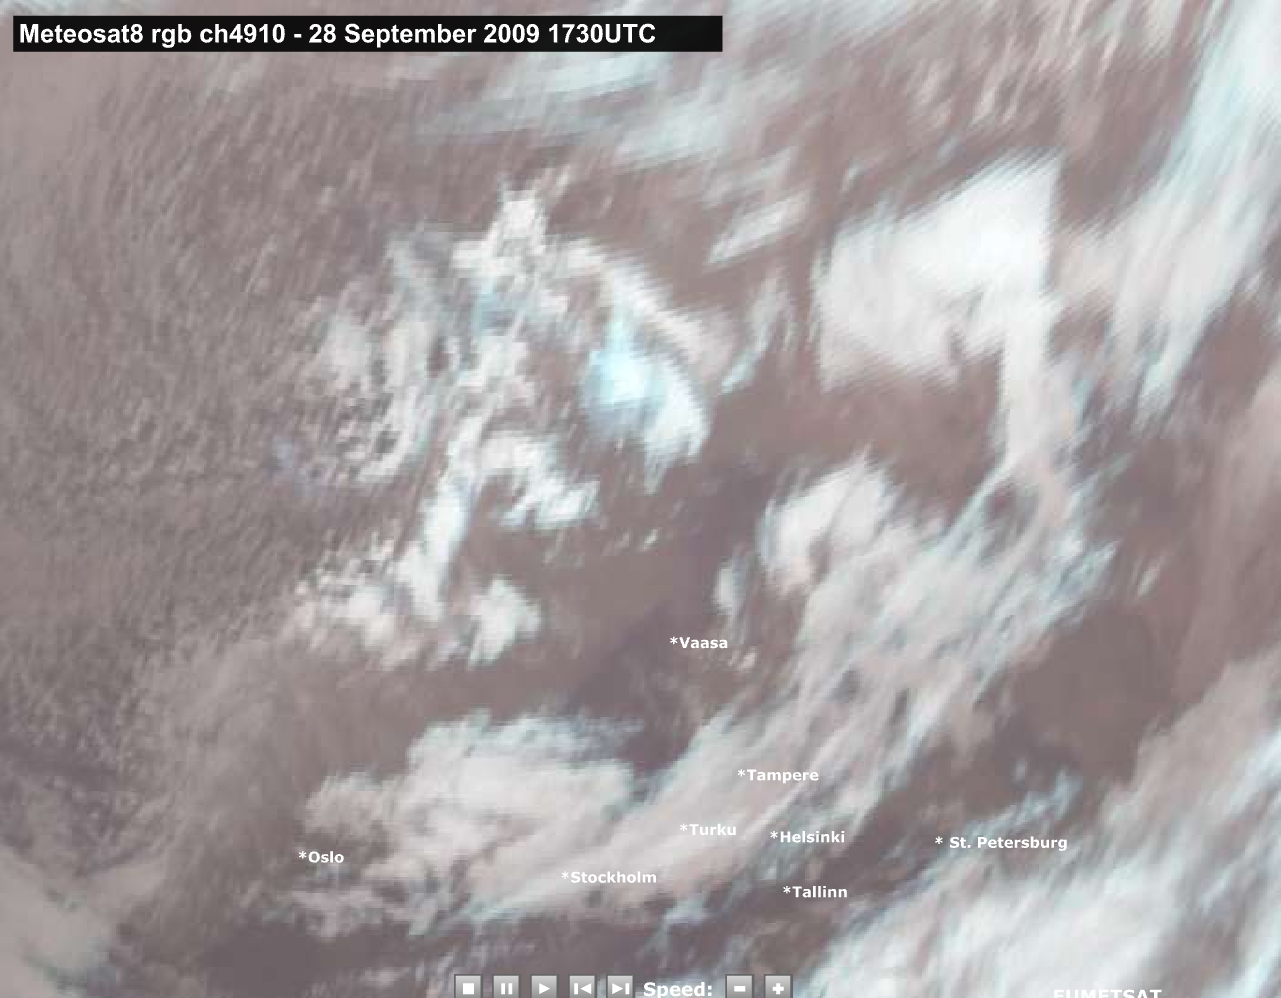
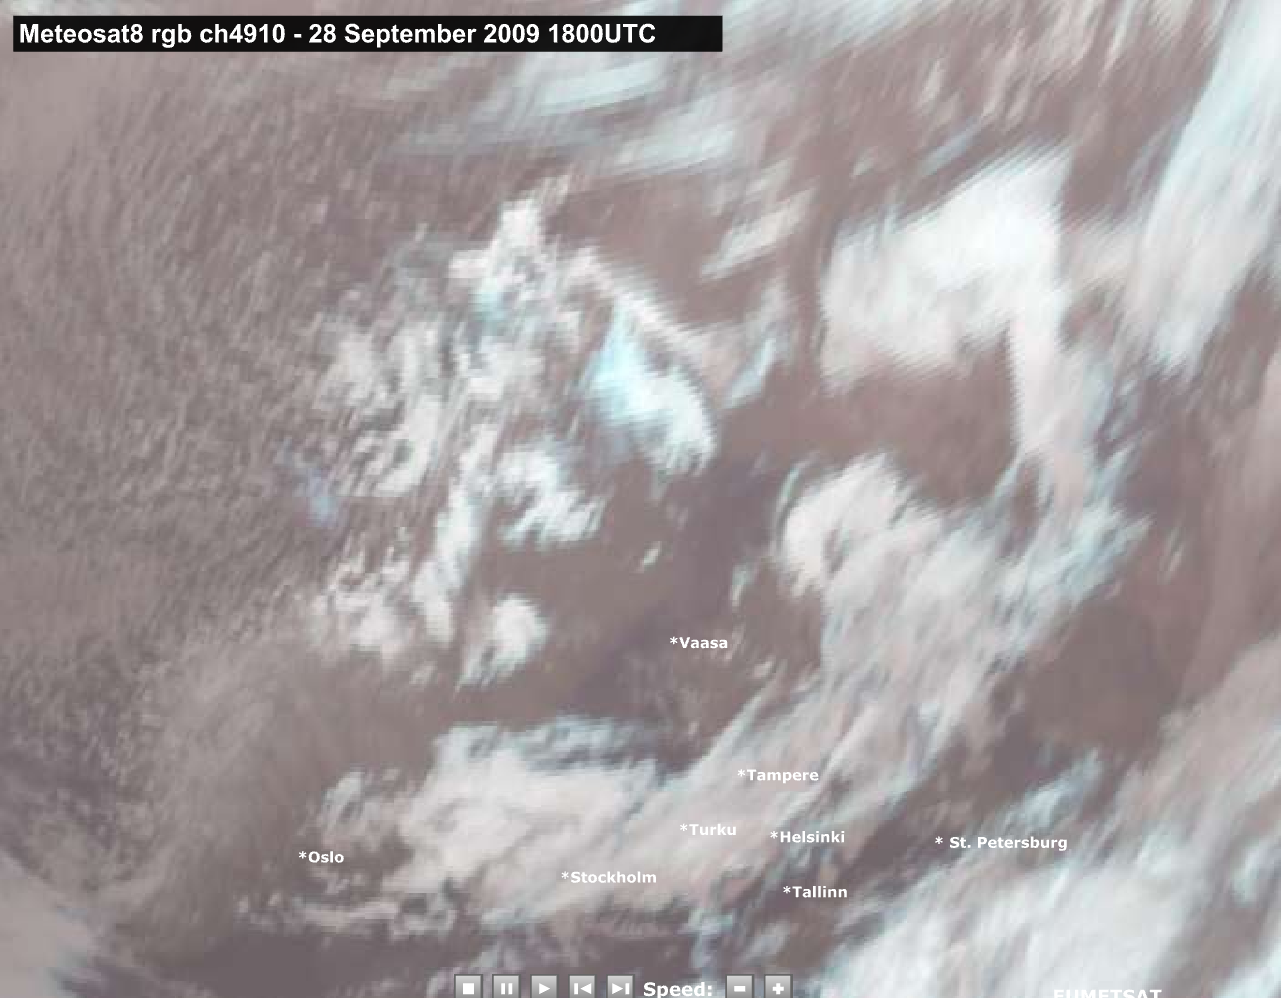
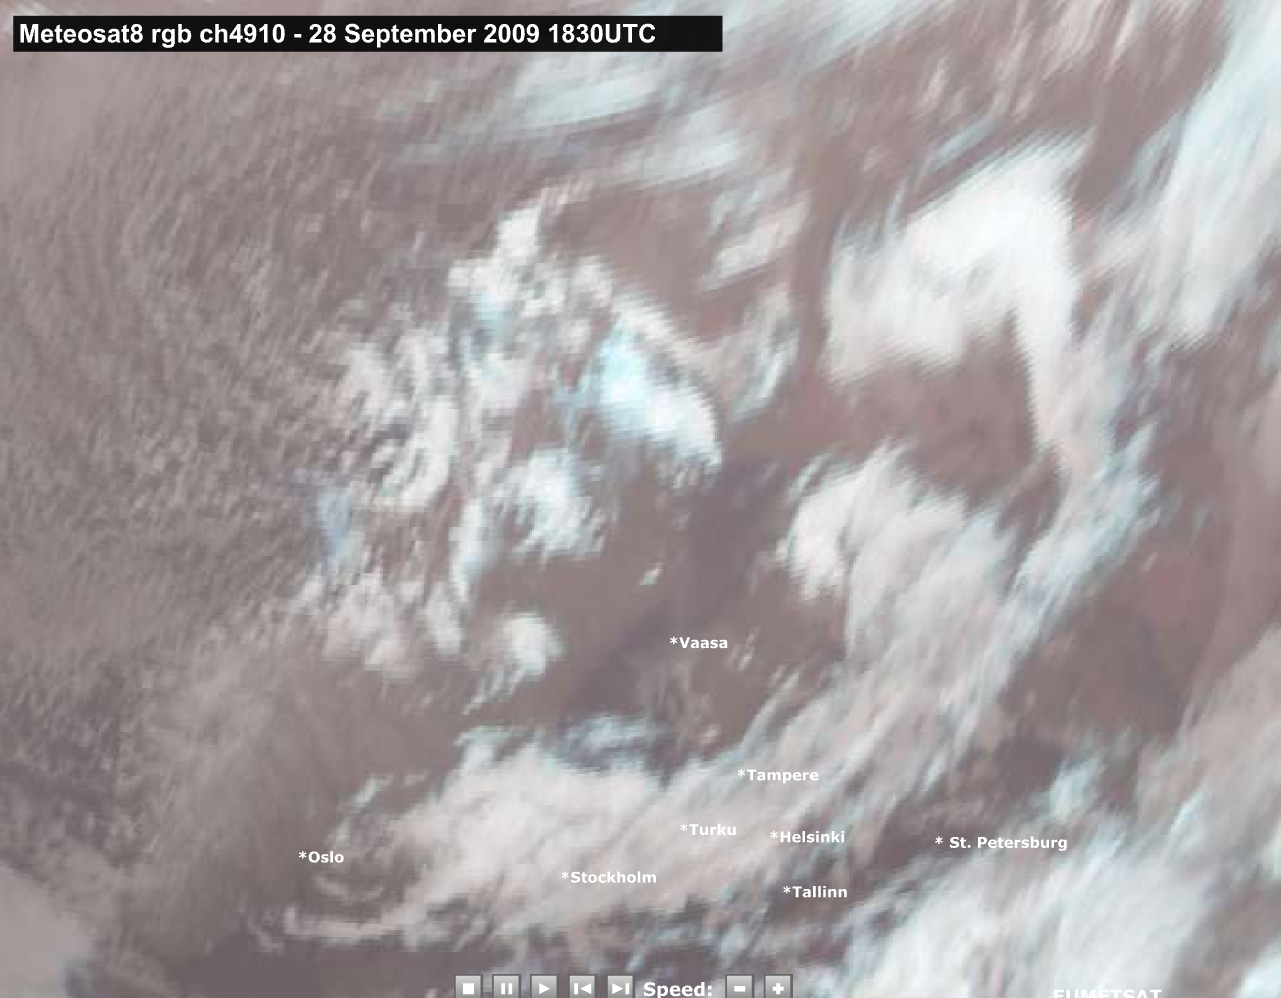
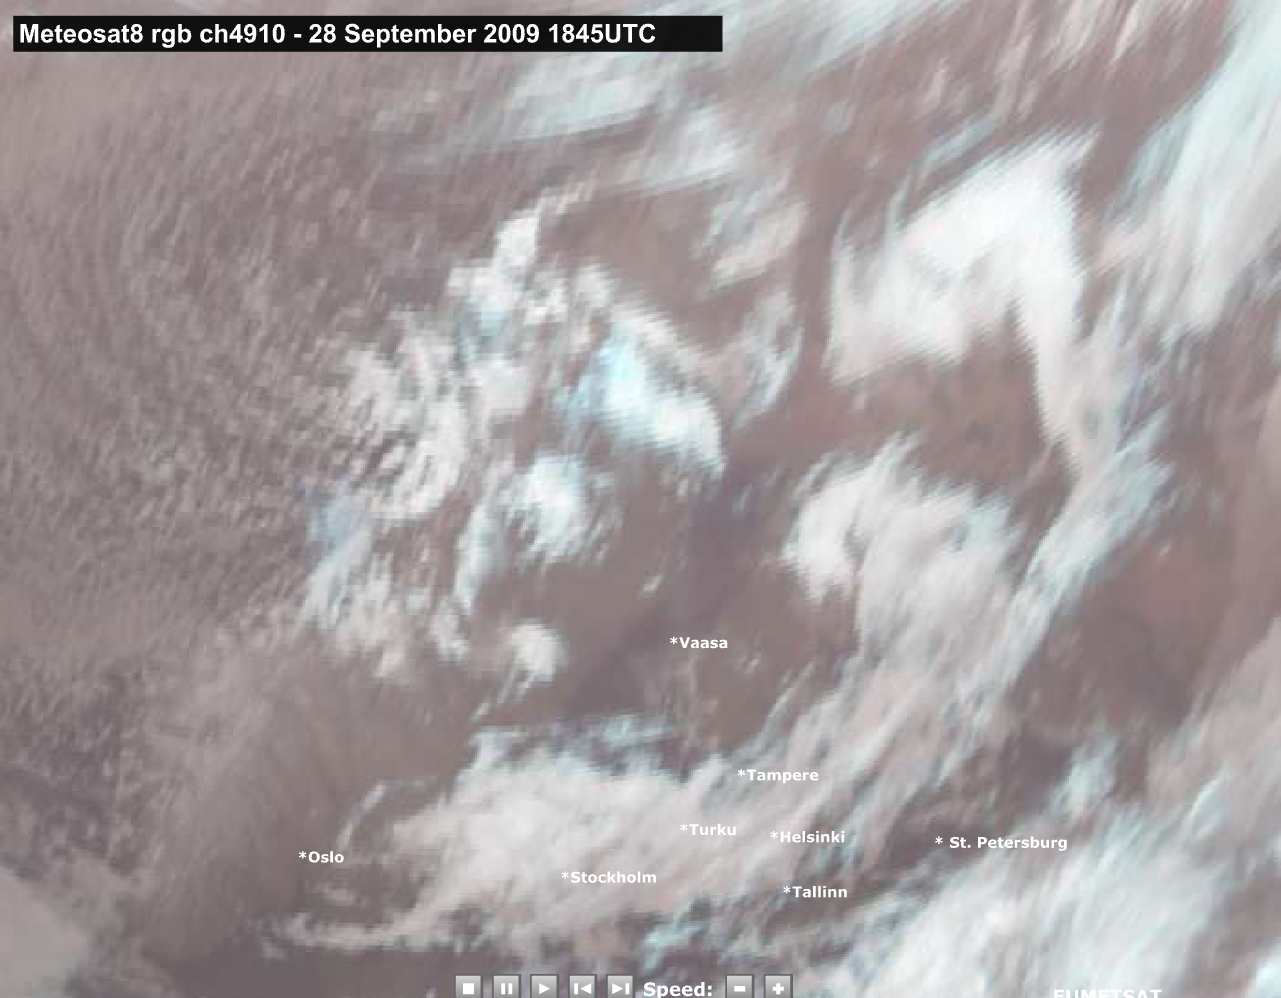
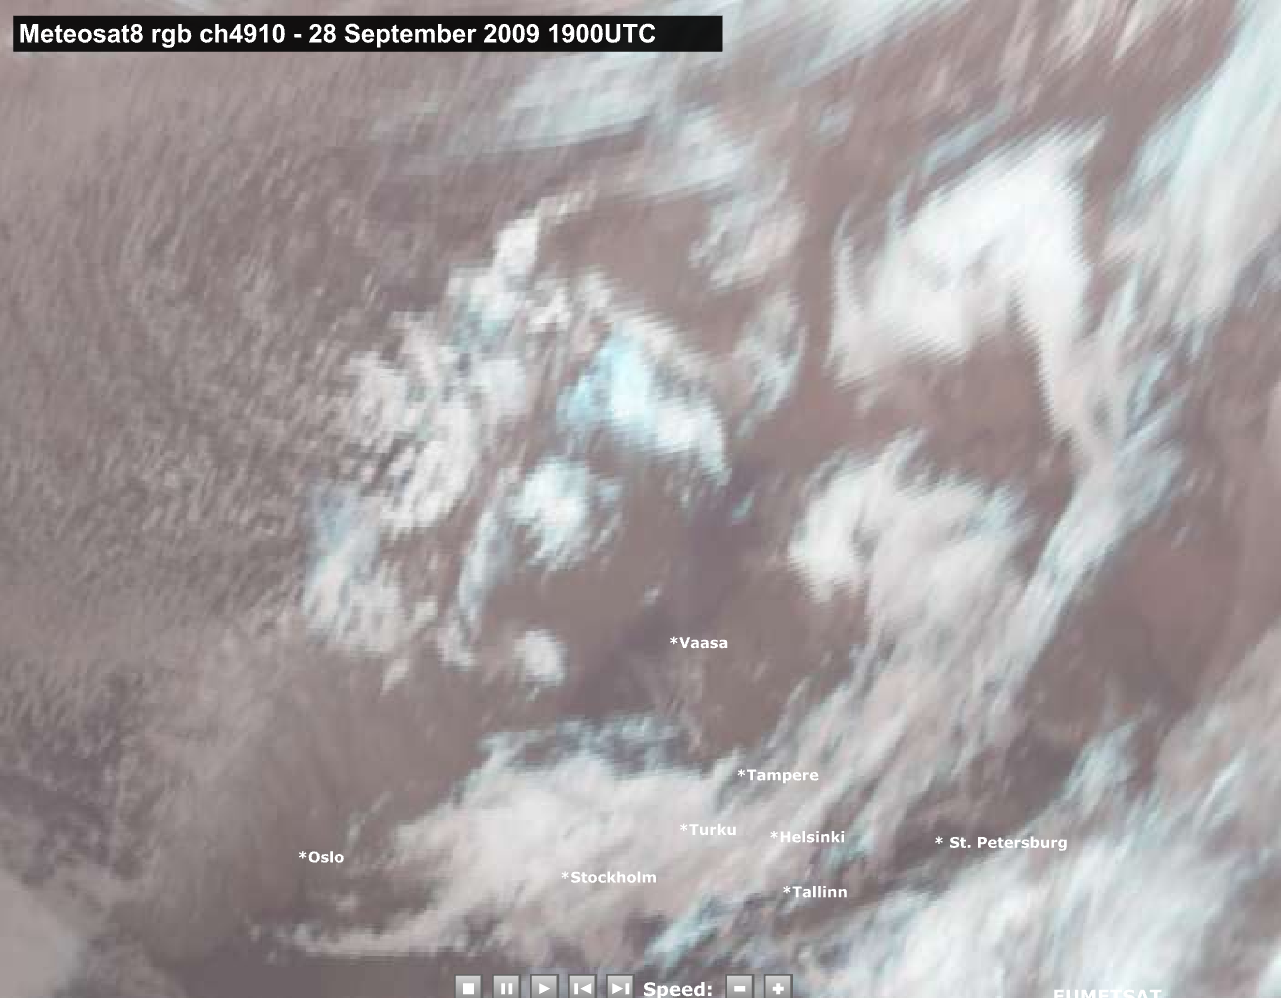
Figure 1: Meteosat8 3,9+10,8+12.0 μm RGB image; 28 September 2009 / 15 - 19 UTC gallery in 15-minute-intervals. The coldest cloud tops and frontal cloudiness are in bright white colours, while lower and warmer cloud tops are in dark red colours. This combination image shows from 17UTC onwards a gust front line, quickly propagating southwards over the sea coming out of cold front band near the center bottom of image.
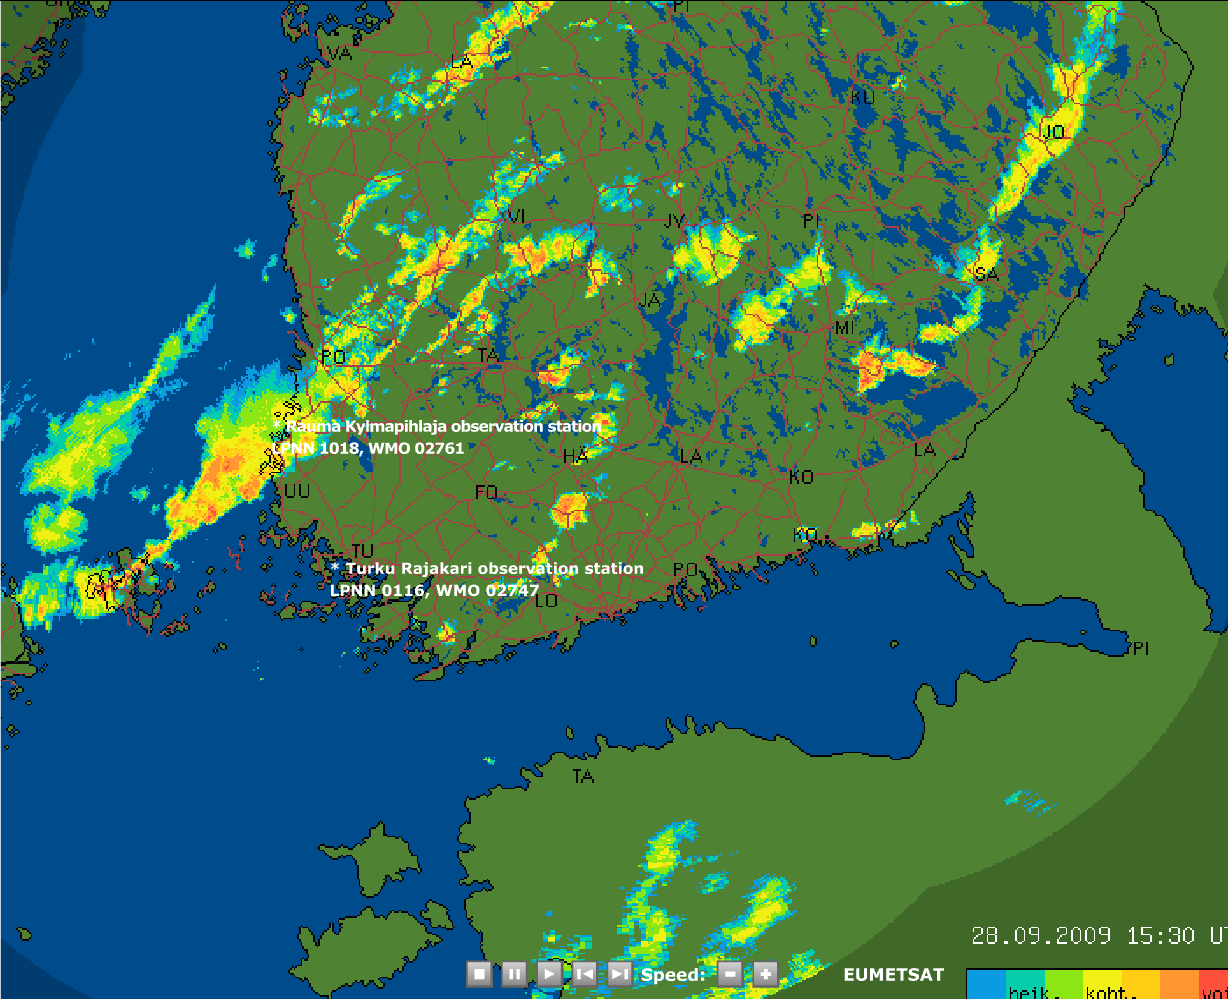
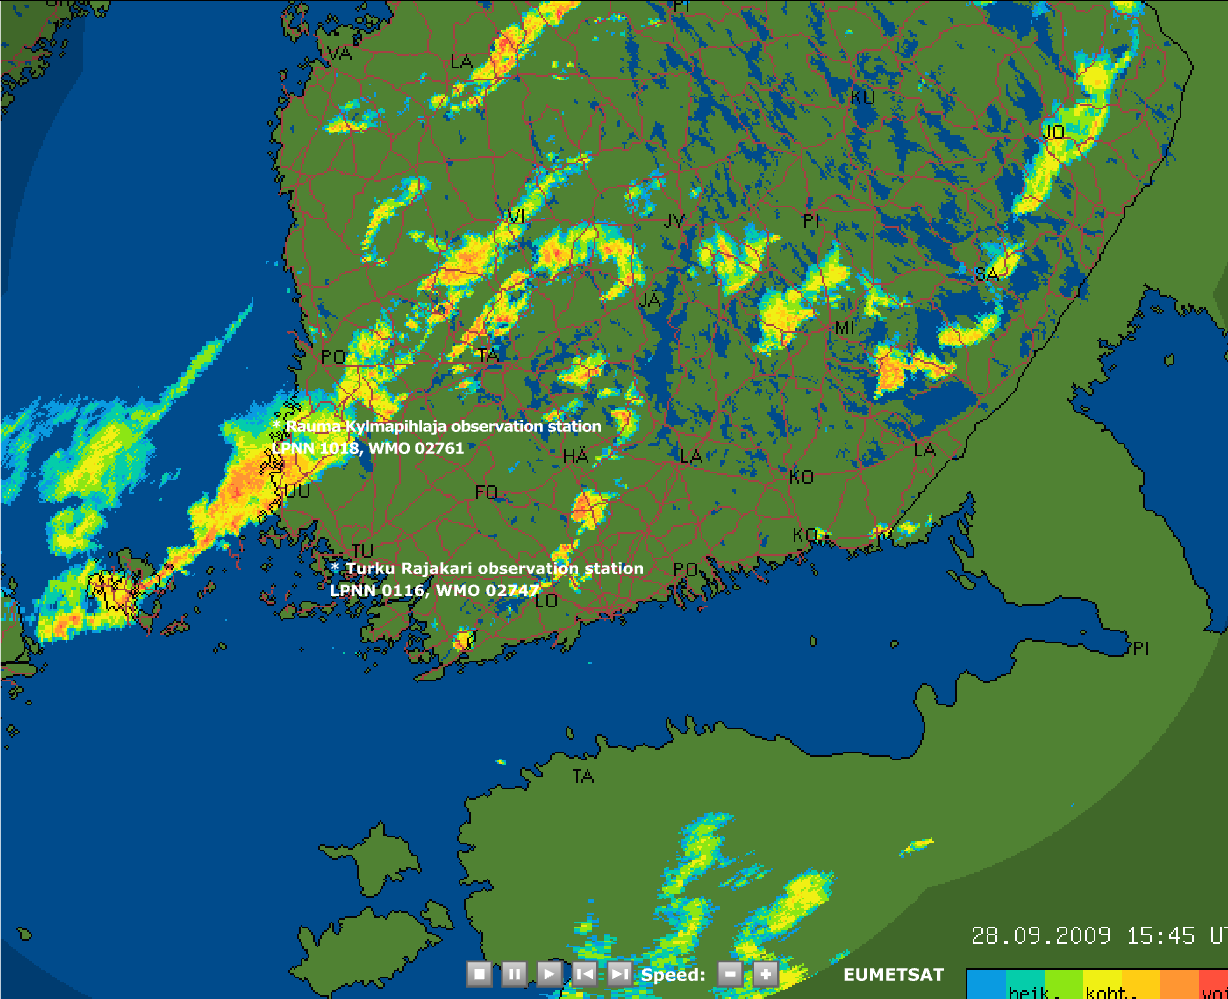
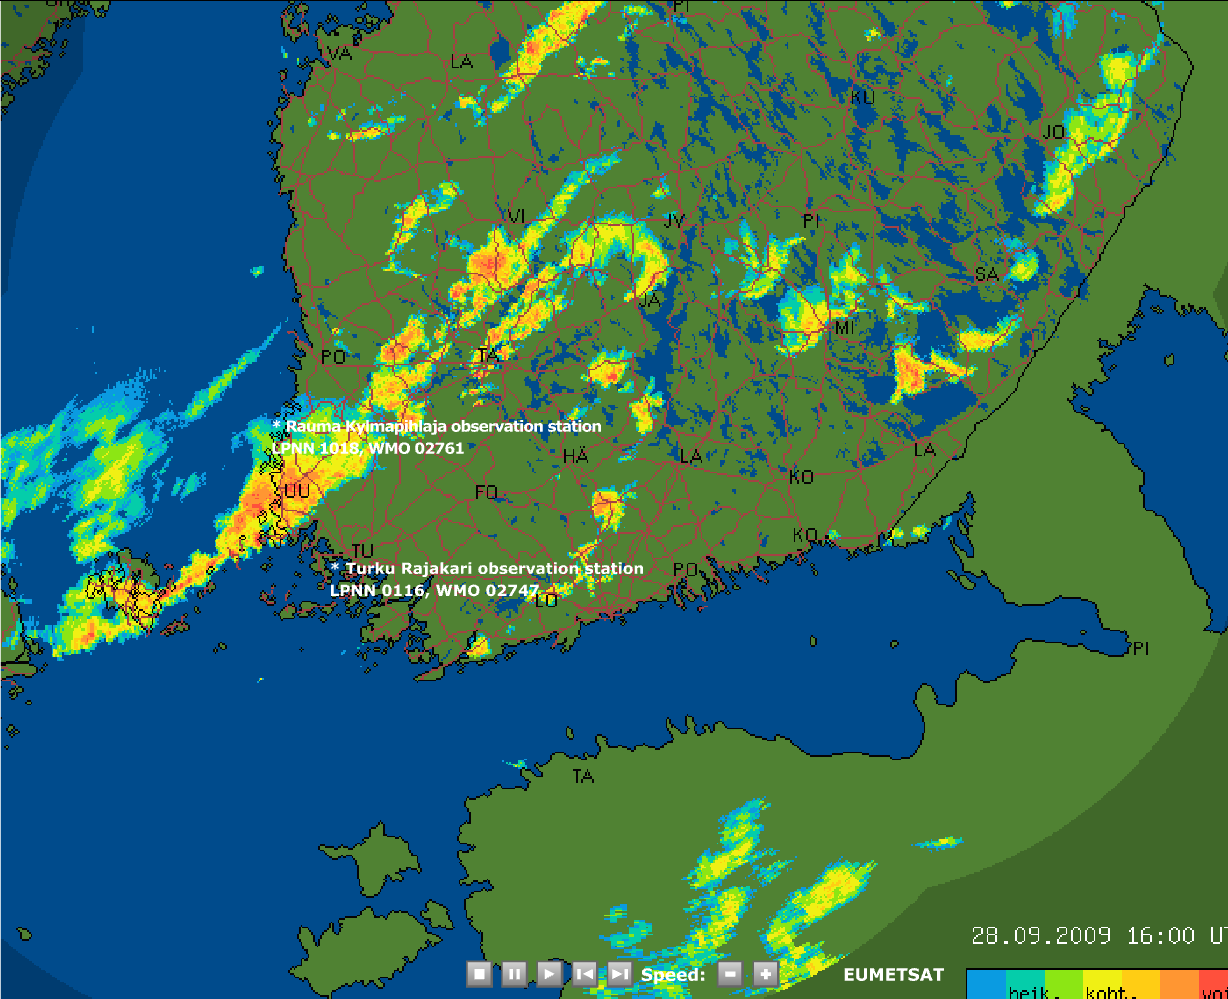
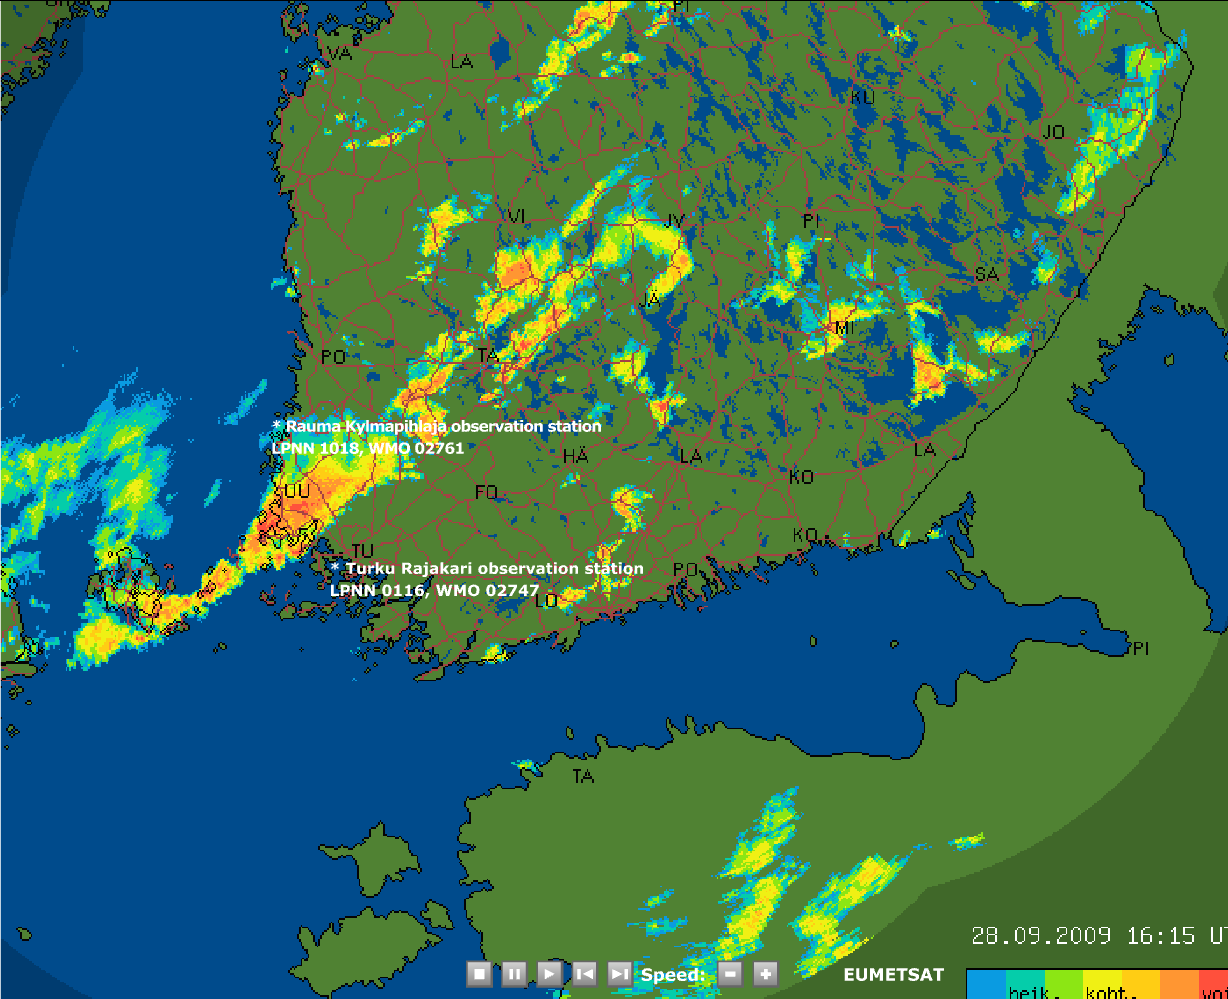
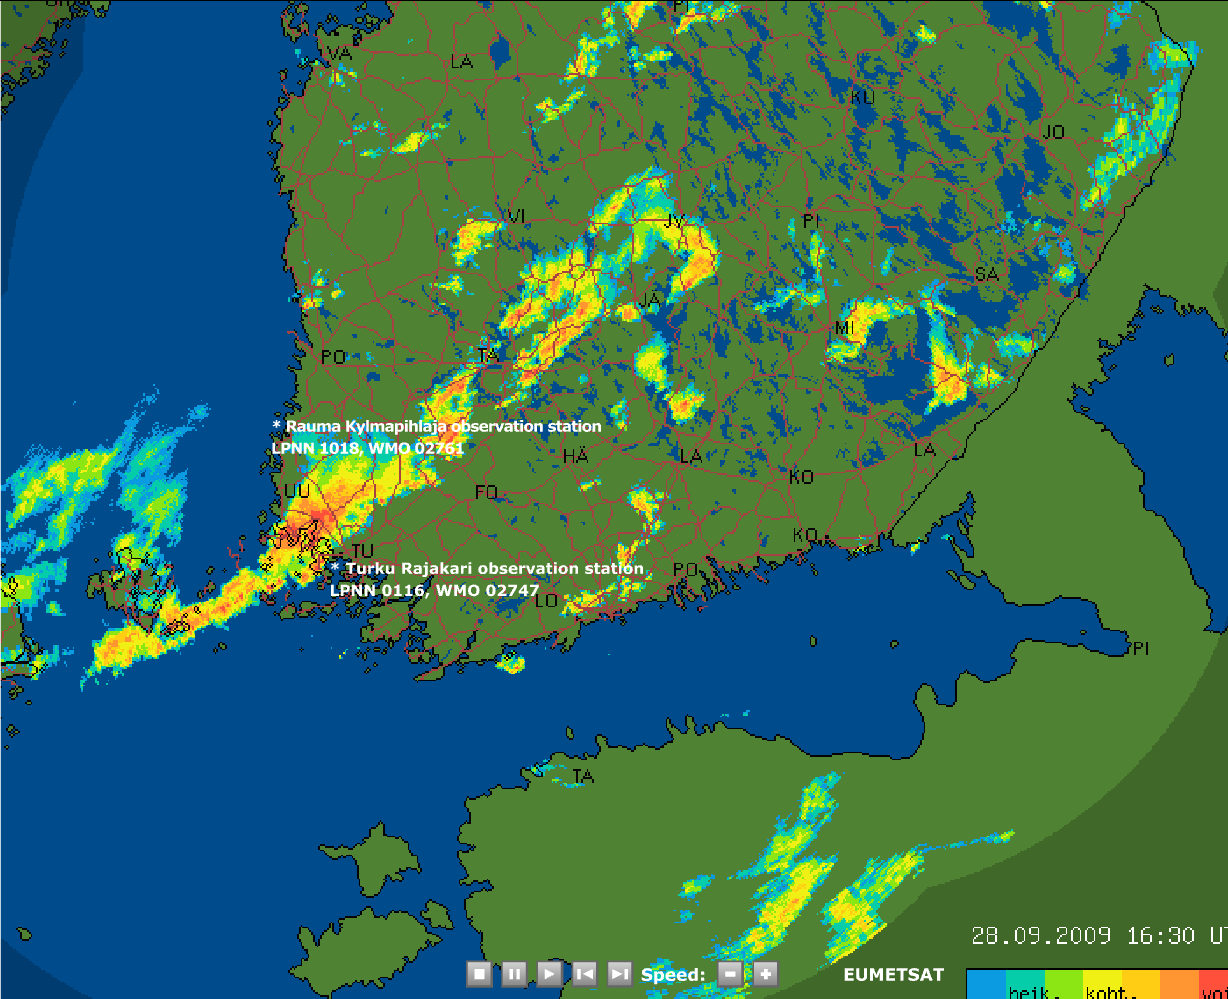
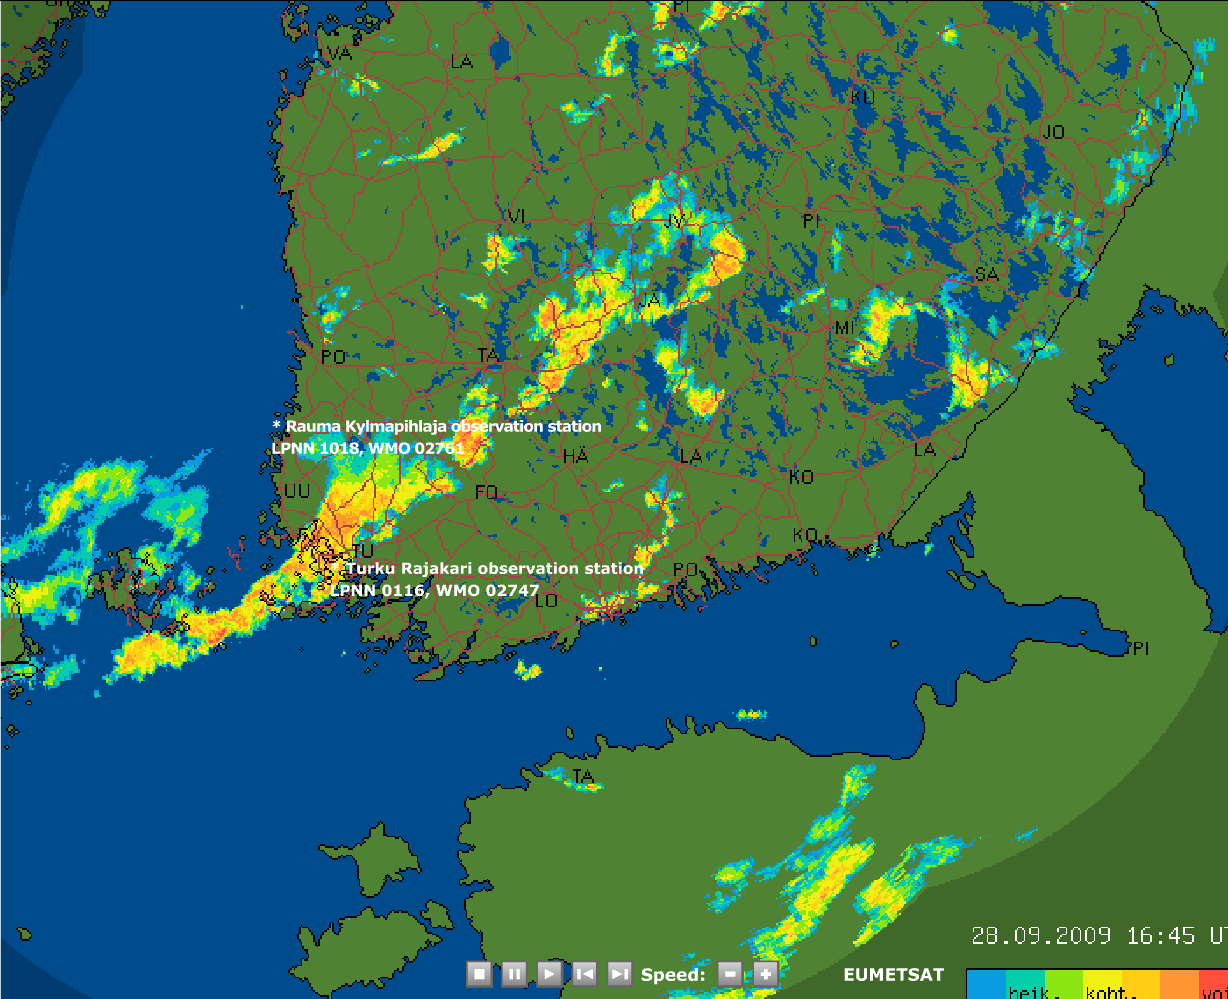
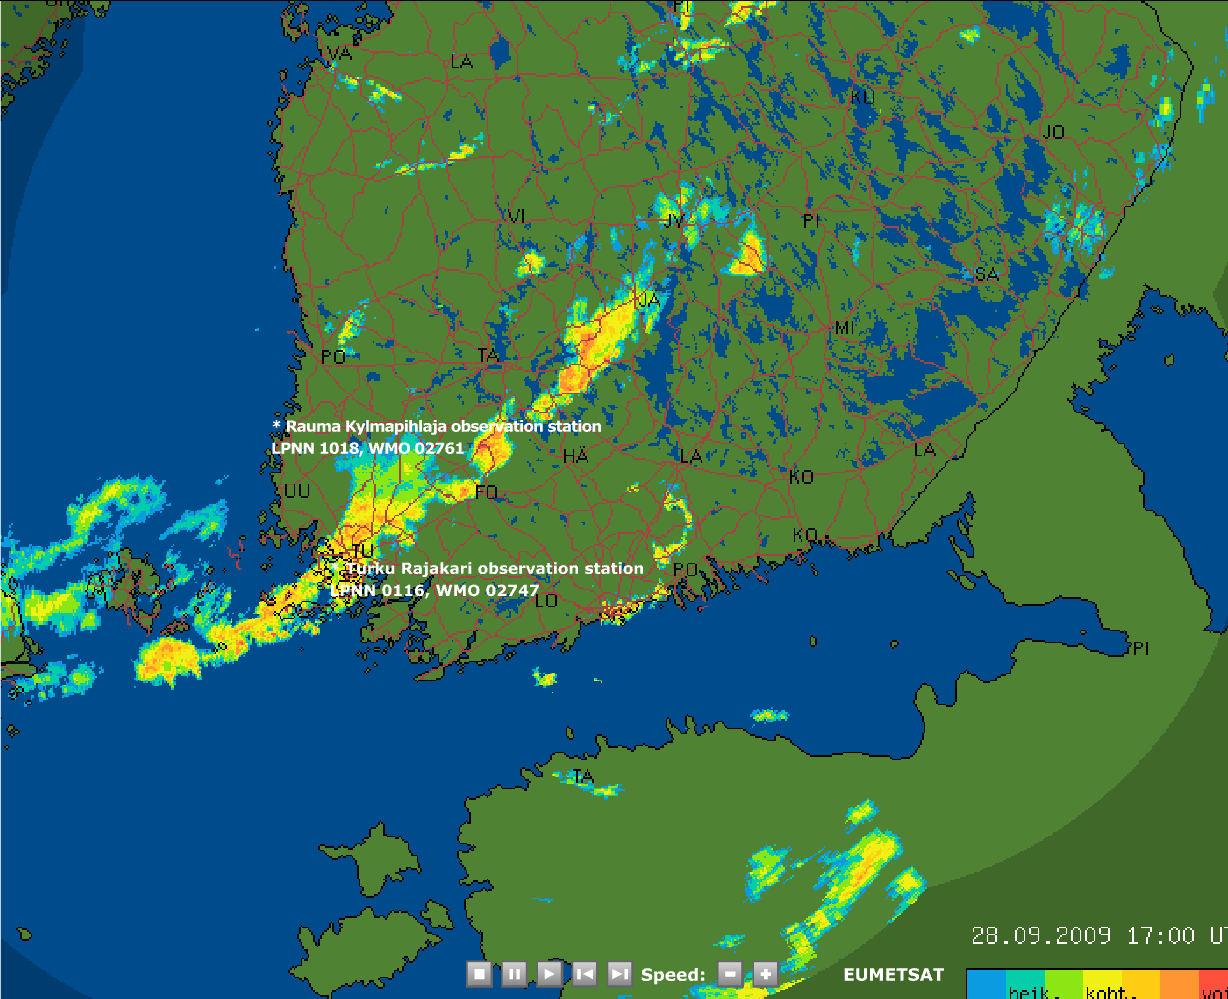
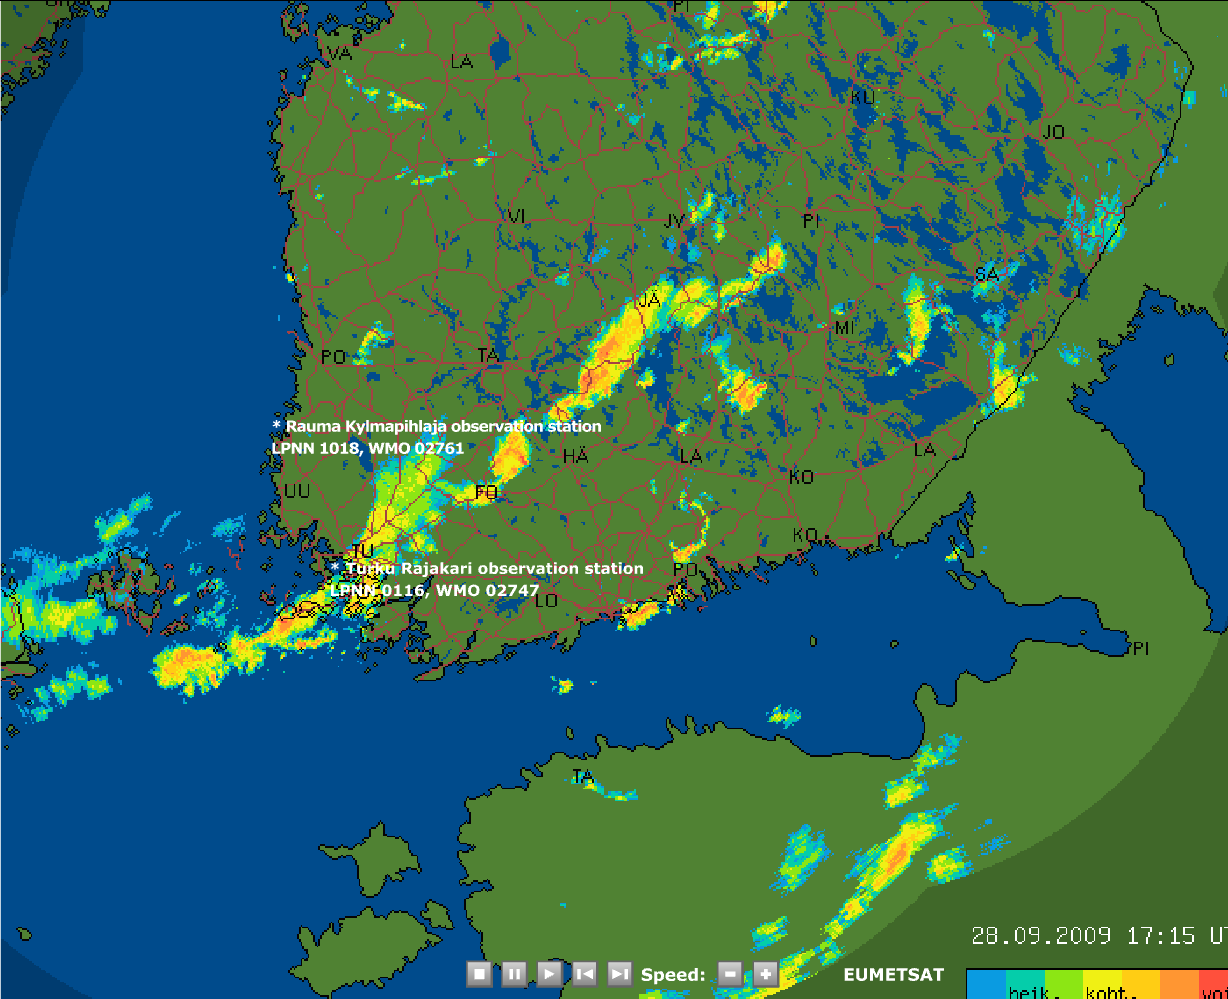
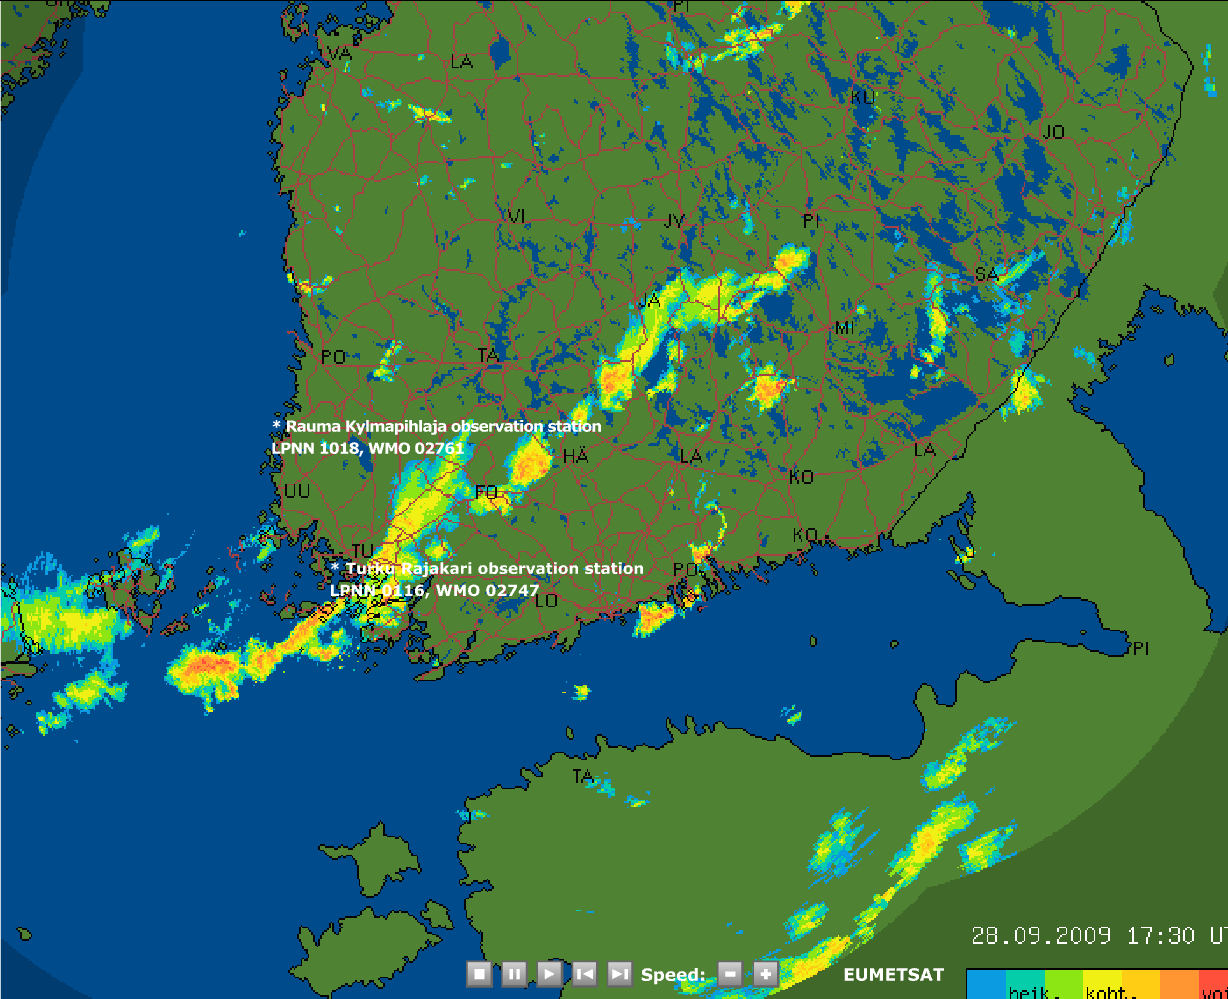
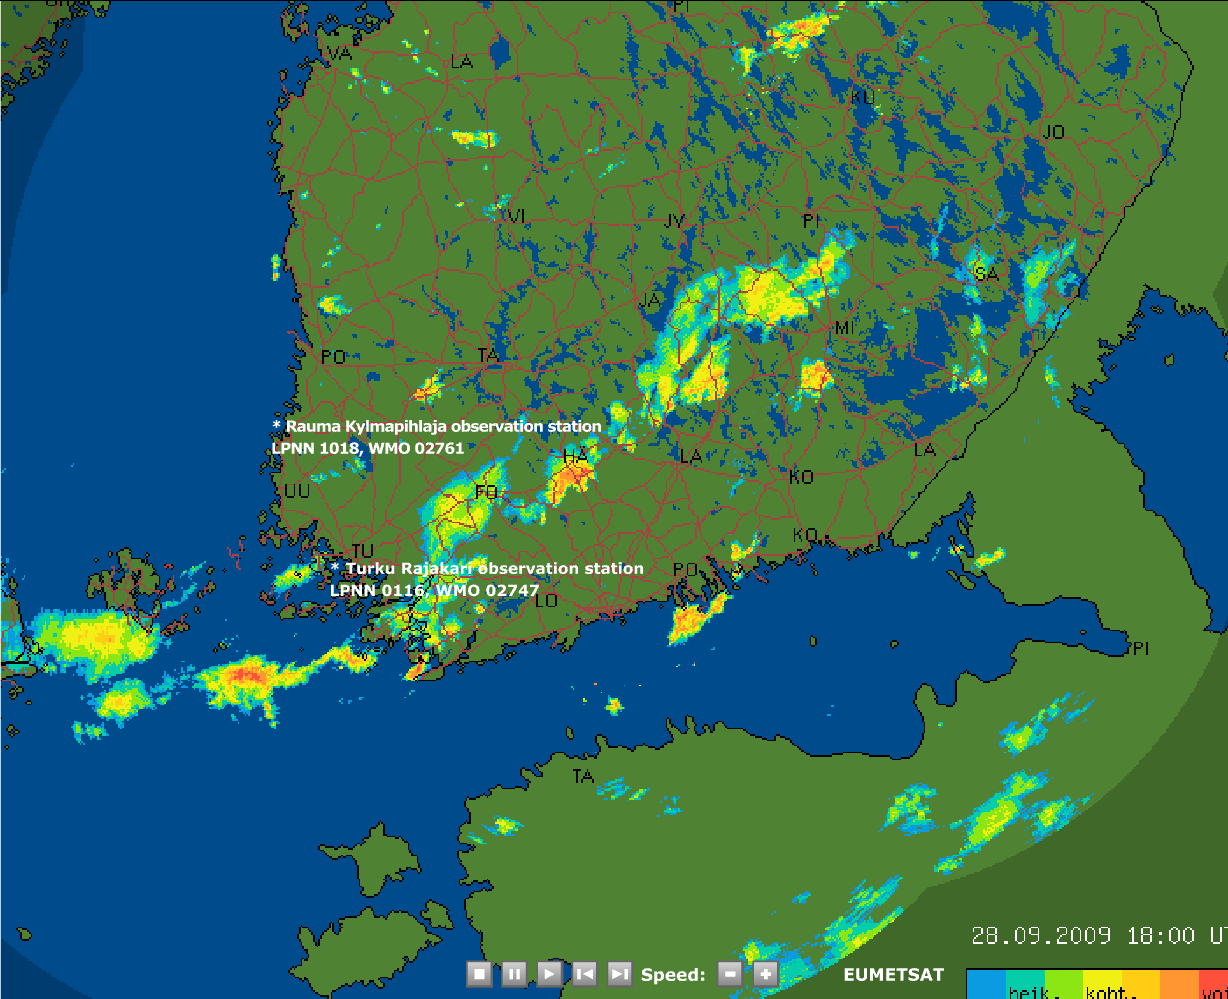
Figure 2: Radar composite loop, 15.30utc - 18.00 utc. Red color means over 40 dBZ radar reflectivity factor.

Figure 3: 10min average wind speed (m/s) Rauma Kylmäpihlaja. Coastal weather station mostly sea area, open view to northwest.
Figure 4: 10min average wind speed (m/s) Turku Isokari. On this station 30 m/s wind gust was measured. Southwest Archipelago, mostly (59%) land area around within 10 km radius.