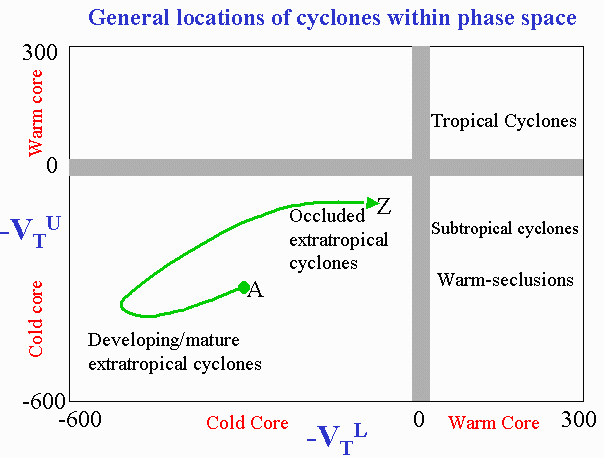
Each cylone is quantified using three fundamental measures of its phase:
- "B" - The storm-motion-relative 900-600hPa thickness gradient across the cyclone.
where h = hemisphere (1 = NH, -1 = SH).
DeltaZR = mean 900-600hPa thickness in semicircle right of motion
DeltaZL = mean 900-600hPa thickness in semicircle left of motion
The mean thicknesses are evaluated in semicircles of radius 500km.
- "-VTL"
- The magnitude of the cyclone lower troposphere thermal wind. This is
measured as the vertical profile of cyclone geopotential height
gradient (cyclone strength) between 900 and 600hPa.
Thermal wind dictates that cyclone phase is related to cyclone strength profile:
- A warm core cyclone has a profile of cyclone strength that decreases with height.
- A cold core cyclone has a profile of cyclone strength that increases with height.
- Cyclone strength is measured as the height perturbation, phi'.
- phi' = phiMAX - phiMIN
- This difference approximates the height gradient on an isobaric surface and the magnitude of the geostrophic wind (Vg).
- phi' = df|Vg|/g
- where d = distance between extrema, g = gravity, and f = coriolis parameter.
- "-VTU" - This is the same as (2), except is calculated for the middle/upper troposphere -- between 600 and 300hPa. This gives the measure of cyclone phase (cold vs warm core) for the upper troposphere. This third measures helps to distinguish full-troposphere warm-core cyclones (e.g. tropical cyclones) from shallow warm core cyclones (warm-seclusions or subtropical cyclones).

 B = 0The example to the left illustrates a
near-zero value of B. The magnitude of B is calculated as the
difference in thickness (shaded) between the semicircle right of motion
from that left of motion. A value near zero for B indicates a
nonfrontal cyclone. The example to the left is a schematic for a
conventional tropical cyclone, which has a maximum of thickness in the
center of the cyclone that decreases almost uniformly outward in all
directions.
 B = 0The example to the left also illustrates a
near-zero value of B. This schematic example is for an occluded
extratropical cyclone.
 B >> 0The example to the left illustrates
a positive value of B. The semicircle right of motion has a
substantially larger thickness (warmer) than that left of motion. Thus,
this schematic represents a frontal cyclone with strong temperature
gradients perpendicular to the storm motion. This schematic is for a
conventional intensifying or mature extratropical cyclone.


 These three parameters, B, -VTL, and -VTU
represent each of three dimensions of the experimental cyclone phase
space. In reality, there are many more dimensions of cyclone phase
(larger scale flow, stratospheric interaction, surface fluxes, etc);
however, the three chosen here represent the majority of the
variability among known synoptic-scale cyclones.


