Introduction
The conveyor belt theory is a very convenient way to visualize the three-dimensional airflows involved in weather systems and therefore a useful method to explain the physical background of Conceptual Models. This theory is especially suited for CMs like fronts and cyclogenesis. The conveyor belt theory does not only provide a new perspective on atmospheric processes such as cyclogenesis or frontogenesis, but it also allows a better insight into the phenomenon of the Occlusion process. It shows a higher variety of possible developments and clearly indicates that the Occlusion process as described by the Norwegian model only represents a special case.
Conveyor Belts are:
- "Air parcels" transported on isentropic surfaces (like luggage on a Conveyor Belt)
- The transport of these parcels occurs on isentropic surfaces along relative streams - relative to a system - as if an observer would move with the clouds and the air parcels.
Even though Carlson first presented the conceptual model in 1980, parts of this concept were developed earlier by Harrold (1973), modified later by Young et al (1987), and summarized by Browning (1999). This concept was intended to describe the storm-relative flow around a mature frontal wave.
Relative Streams
The concept of relative streams on isentropic surfaces have gained more and more importance with the introduction of conveyor belt theory. However, current work with relative streams is mostly restricted to research work and is not that common in operational weather forecasting. Relative streams are computed on isentropic surfaces (i.e. on layers with constant potential or equivalent potential temperature). The wind speed and direction of a relative stream is calculated as a function of the system velocity. This system velocity is subtracted from the absolute velocity:
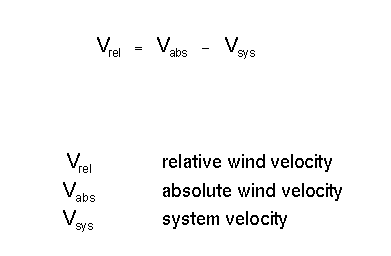
The determination of the system velocity is one of the critical steps in the computation process; it can be derived from the propagation of cloud systems accompanying a weather system. For instance, the propagation of a frontal cloud band can be used for the system front and upper level trough.
The subtraction of the system velocity means that an observer would move with the system and that all the air streams and their changes occur relative to this system.
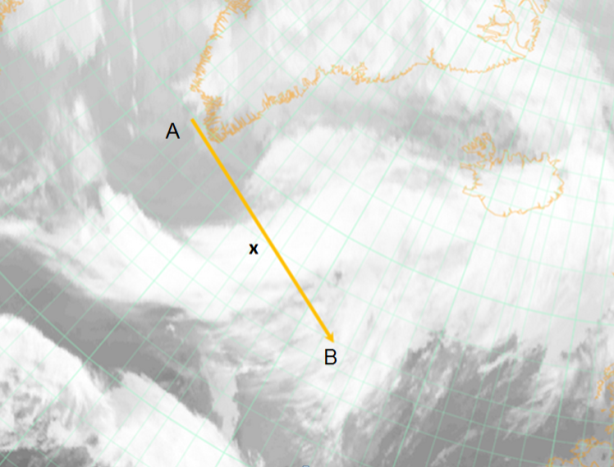
The next schematics explain the connection between presentations on isobaric and isentropic surfaces.
 |
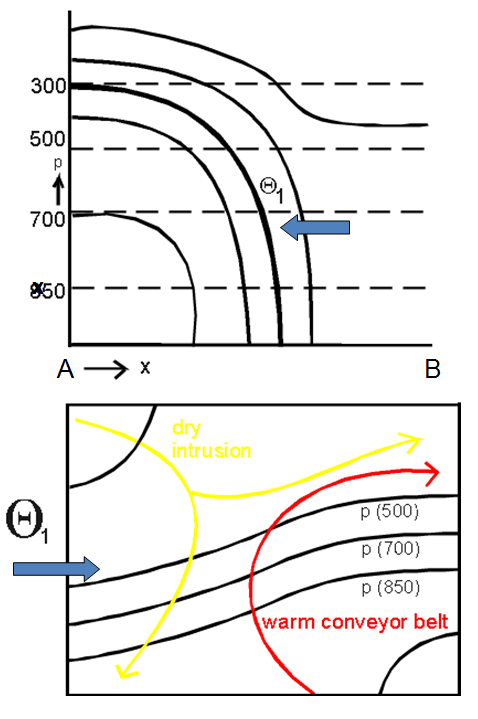 |
Figure 1: The connection between presentations on isobaric and isentropic surfaces
There are two main advantages when using relative streams:
- The different air masses involved in a weather system are visualized through the relative streams which transport them; therefore, sharp cloud boundaries and other cloud structures can be easily explained.
- An isentropic surface is a surface of constant potential (or equivalent potential) temperature, which means that air parcels moving along such a surface are presumed not to undergo any heat exchange (adiabatic process) and consequently stay and move on this surface. Therefore, rising and sinking motions can be directly seen on an isentropic surface by noting the isobars which are crossed by the streamlines.
As already mentioned, the conveyor belt theory has been derived from an approach using relative streams. In the above schematics two typical conveyor belts associated with a cold front situation are marked: A warm conveyor belt and a dry intrusion.
Conveyor Belts
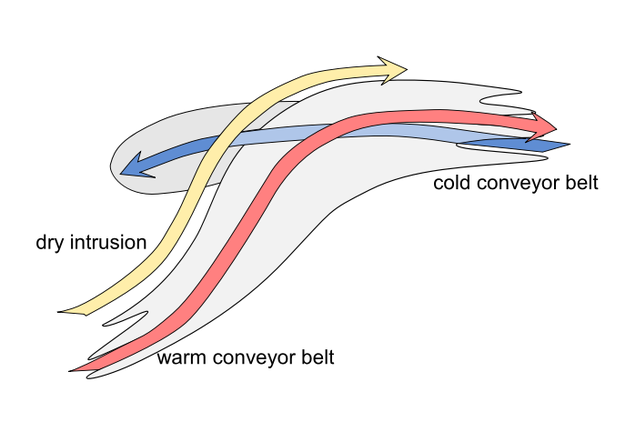
Three types of conveyor belts have revealed useful for the description of the processes involved in cyclogenesis (described here for the northern hemisphere):
The Warm Conveyor Belt (WCB), the Cold Conveyor Belt (CCB), the Dry Intrusion (DI).
- The Warm Conveyor Belt is a relative stream rising from lower layers in the south, south-east to higher layers in the north, north-east and finally turning to eastern directions while sinking again; it transports warm and moist air. The WCB is located ahead of the cold front and glides up on the warm front. During the advanced stages of an occlusion process the WCB can split in two branches in the area of the occlusion cloud spiral and the Warm front
- The Dry Intrusion is a relative stream sinking from very high layers (sometimes even from the stratosphere) from north-west to south-east and a rising again from there on to the north-east; it transports cold and dry air.
- The Cold Conveyor Belt is a relative stream rising from low layers in the east, south-east (which comes initially from below the warm conveyor belt) westward into middle layers till it emerges from below the warm conveyor belt and turns to southern directions while sinking again.
Schematics below:
Typical configurations of the three conveyor belts for two different stages of occlusion cloud bands
 |
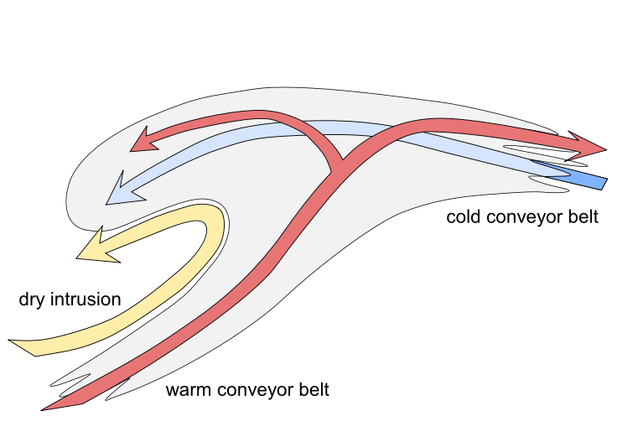 |
Figure 2: Two different stages of occlusion cloud bands
A good way to look into Conveyor Belts is the example of a highly developed frontal cloud system presented with the air mass RGB (14 November 2018/ 06 - 12 UTC) in two stages of development.
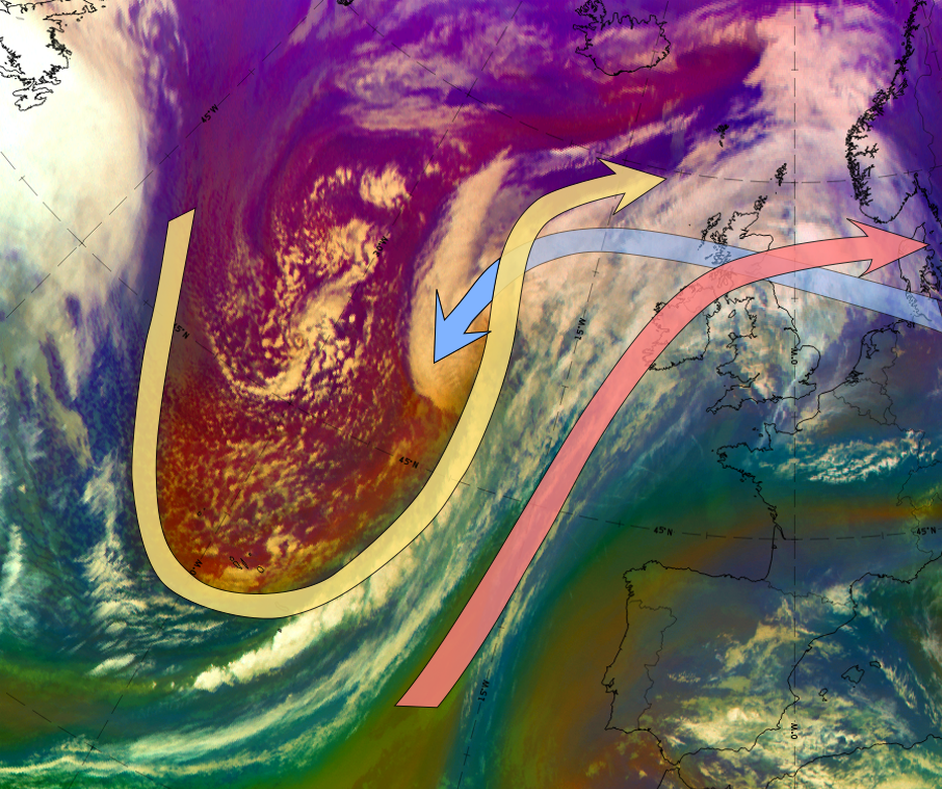 |
WCB: Warm conveyor belt: CCB: Cold conveyor belt: DI: Dry intrusion: |
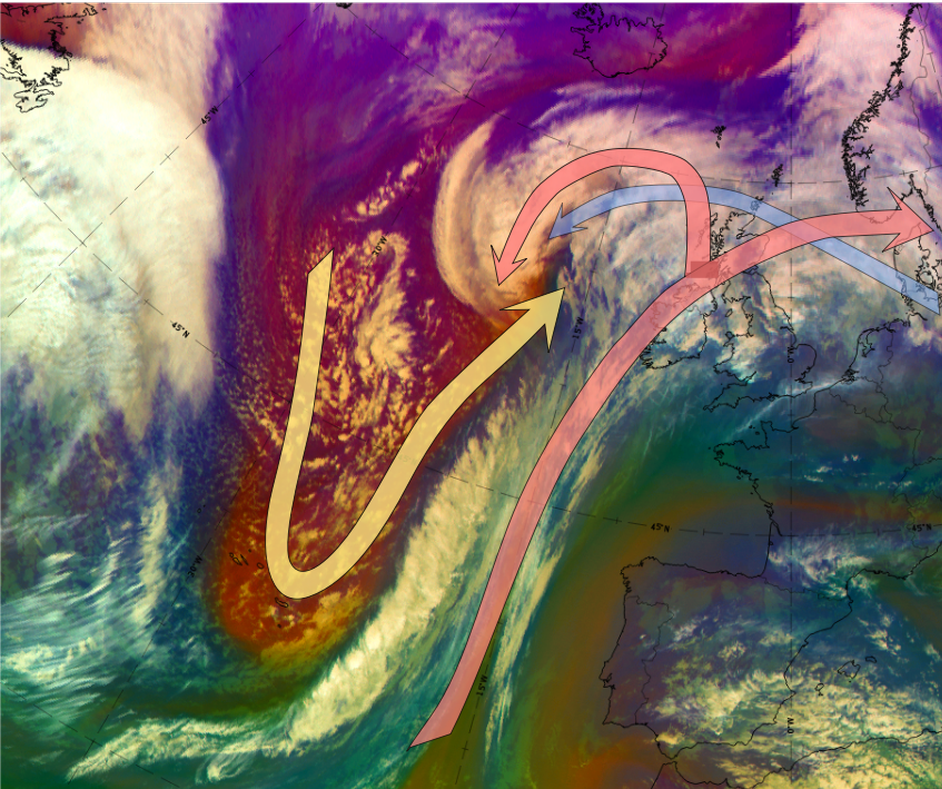 |
Figure 3: 14 November 2018/ Airmass RGB - Upper image: 06 UTC; lower image: 12 UTC
Conveyor Belts are primarily connected with the Conceptual Models of Fronts and Cyclogenesis. The table below gives a summary.
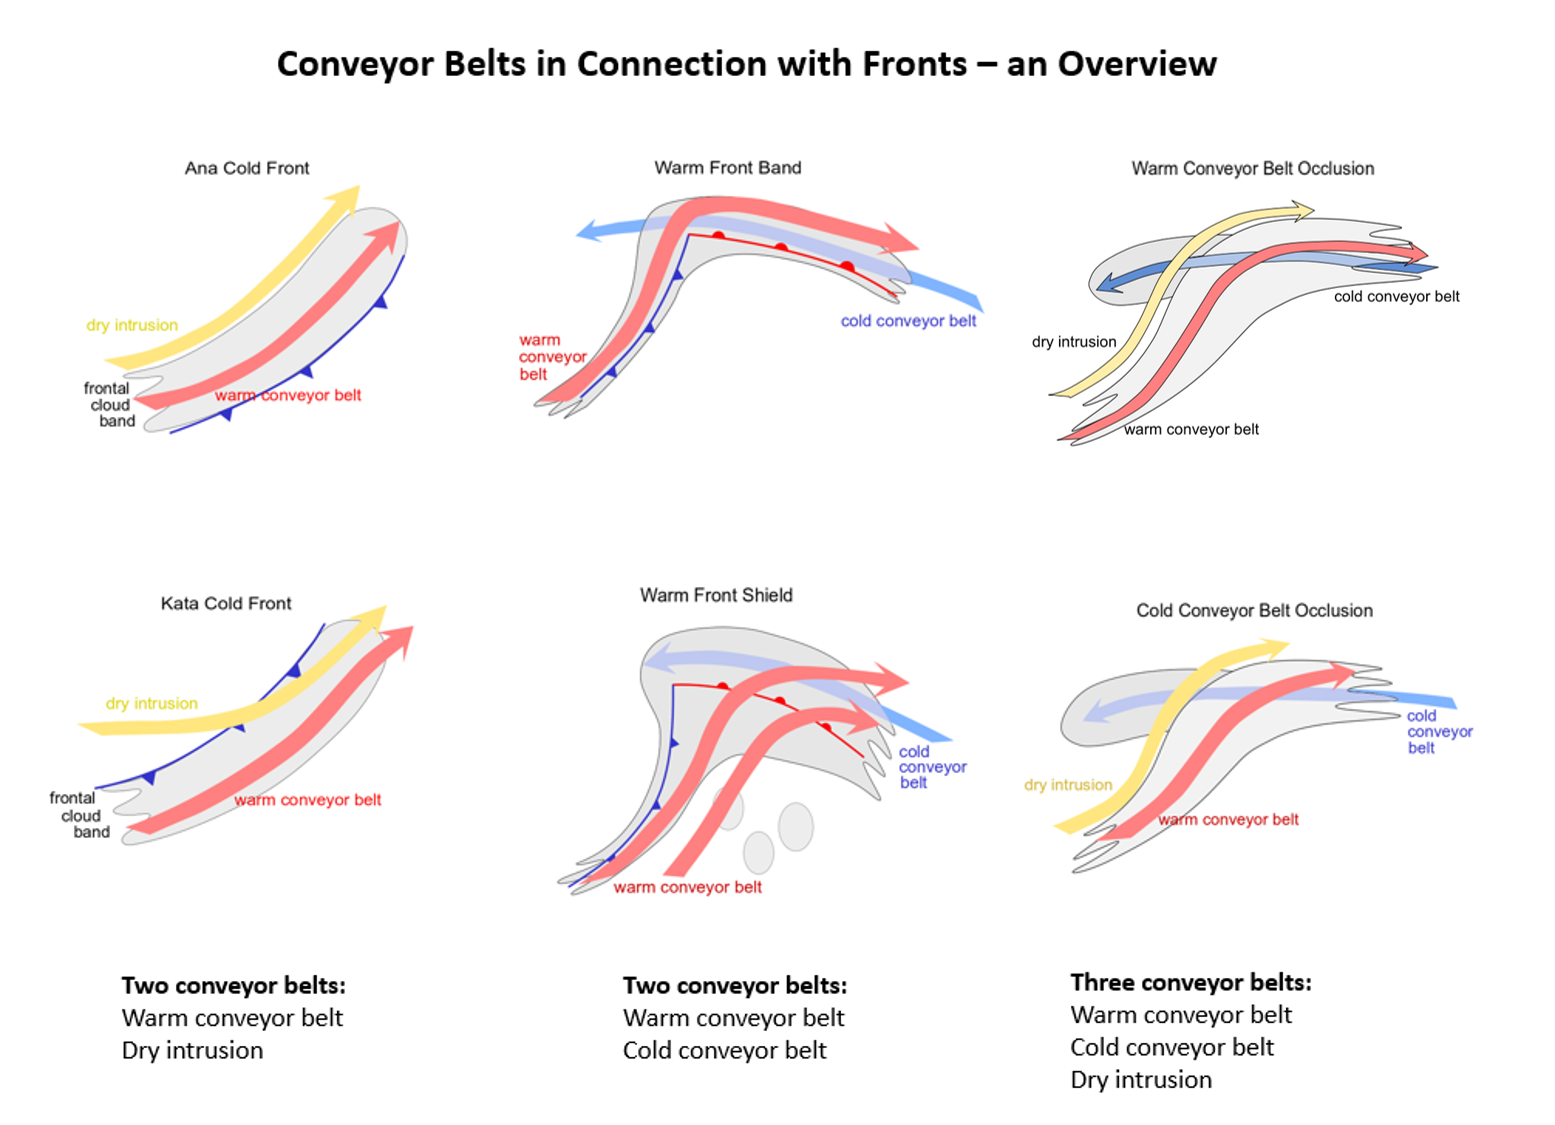
Figure 4: Conveyor belts in fronts