Key Parameters
- Height contours at 1000 hPa and 500 hPa:
- Temperature advection (TA):
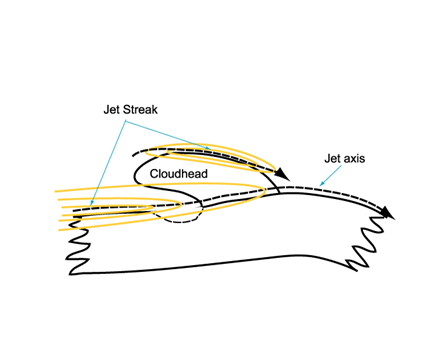
- Isotachs at 300 hPa:
- Vorticity advection at 500 and 300 hPa (positive vorticity advection or PVA, and negative vorticity advection or NVA):
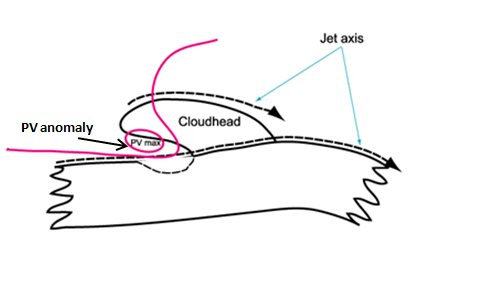
- Potential vorticity (PV):
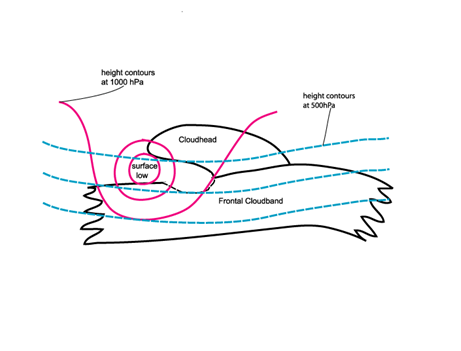
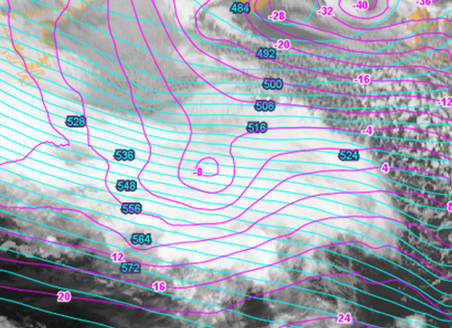
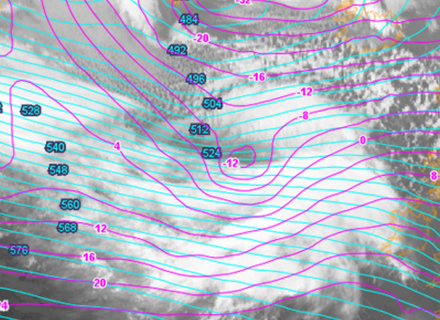
The height contours at 1000 hPa start with a weak low or trough but undergo rapid deepening during the initial stages of development. The upper level height contours at 500 or 300 hPa show only a very weak trough in the beginning to the west of the surface low. The trough deepens during the process and finally catches up with the position of the surface low. The height contours at 500 (or 300) hPa are perpendicular to the height contours at 1000 hPa in the initial phases, indicating the cyclogenesis is in the developing stage.
The mature stage is characterized by a low center with very low values at 1000 hPa as well as at 500/300 hPa. At this point the trough axis is vertical and situated in the center of the cloud spiral.
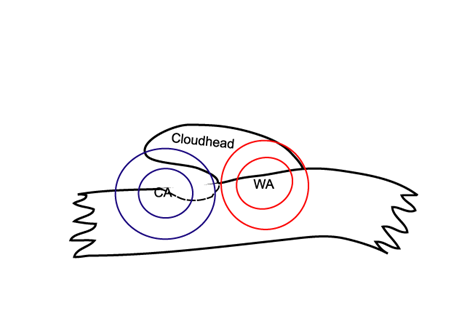
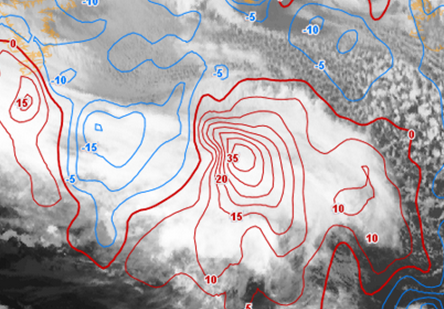
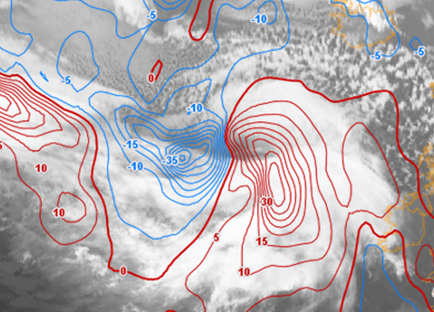
The field of temperature advection shows a very typical situation for a wave: a maximum of warm advection (WA) within the cloud head and the warm front (WF) shield and cold advection (CA) behind. This pronounced WA/CA dipole is a sign of the ongoing cyclogenesis. However, one characteristic of Rapid Cyclogenesis events is that compared to more classical developments the WA is very strong, with values sometimes even higher than those of the CA.
The isotachs at 300 hPa show a pronounced jet streak along the rear edge of the frontal cloud band. The cloud head can be found within the left exit region of this jet streak. In the mature stage a second jet streak often forms at the east-northeastern (polar) side of the cloud head.
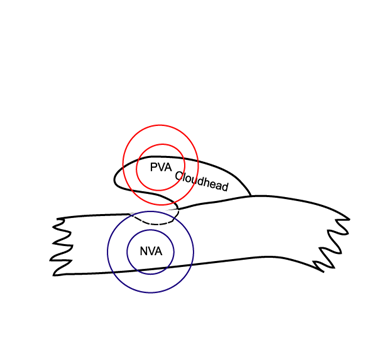
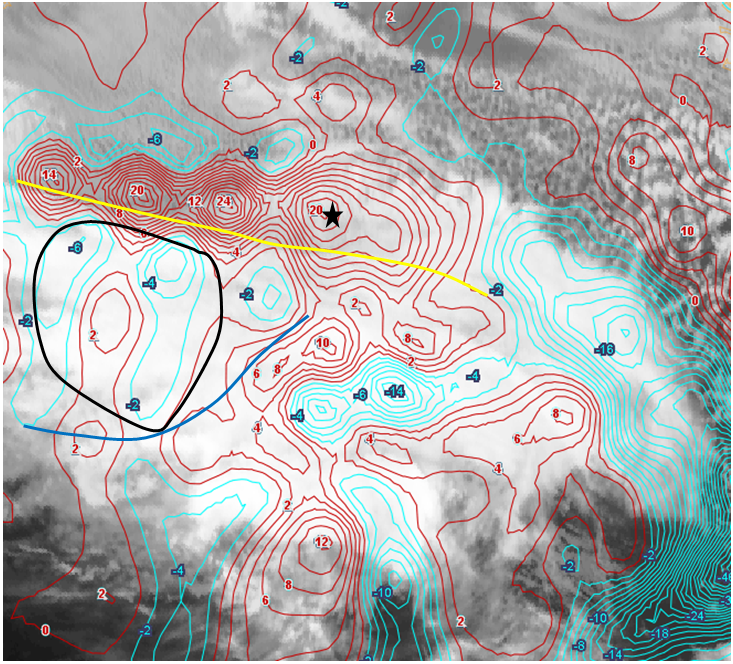
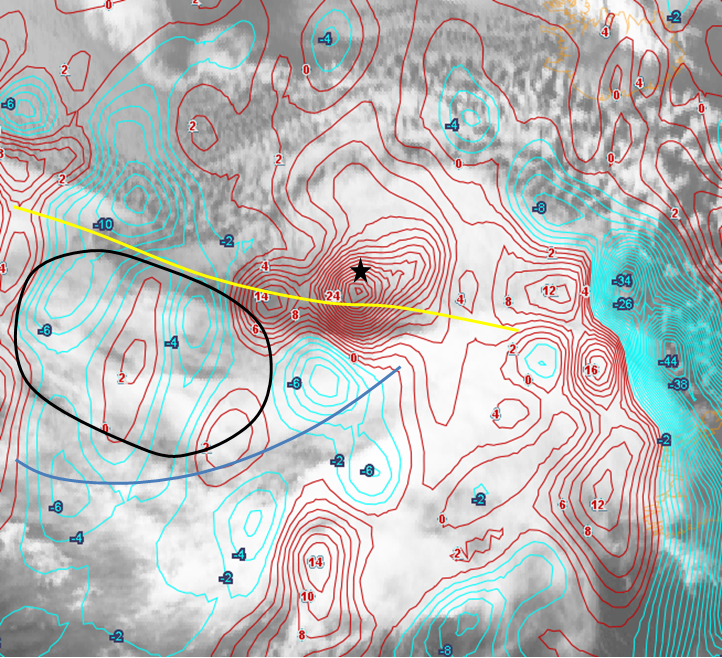
The field of vorticity advection shows a pronounced PVA maximum at 500 and 300 hPa, situated mostly within the area of the cloud head and therefore also in the area of the left exit of the main jet streak. If the second jet streak, downstream from the low, has already developed, the maximum is also located near the right entrance of the second jet streak. As a consequence both PVA maxima work together and have an enhanced impact.
During the phase of strongest development NVA in the right exit region intensifies, which goes hand in hand with the dissipation of clouds within the cold front of the cold front cloud band.
The potential vorticity shows a PV anomaly (values bigger than 1 PVU) protrude downward in the upper troposphere along the rear cloud edge of the cold front.
The anomaly, which separates tropospheric and stratospheric air, goes lower than in classical cyclogenesis. In the initial stage it is approximately at 400-500 hPa and goes down to 700 hPa or even lower. In the beginning of the process the anomaly is upstream of the low center, and approaches it while the Rapid Cyclogenesis proceeds.
In the phase where the deepening of the surface low is strongest, the PV anomaly coincides with the location of the low and the intensified PV values of the troposphere.
This does not automatically mean that stratospheric air reaches the surface. The increase of PV in the low layers can also have other reasons, such as the mutual increase of rotation between high and low levels as described by Hoskins (see Meteorological Physical Background) and the release of latent heat, especially in convective situations.
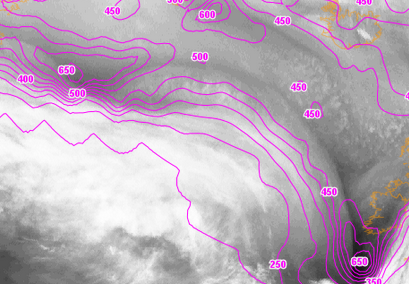
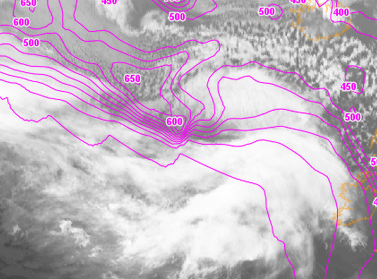
The images from 8 January 2015 show three time steps in the life cycle of a Rapid Cyclogenesis: 06:00, 12:00 and 18:00 UTC from initial to advanced stage. The schematics summarize the most typical features which can appear in some or all phases of development.
Height contours at 1000 hPa and 500 (300 hPa)
| Fig. 22a: Schematic of height contours at 1000 hPa and 500 hPa. | Fig. 22b: 8 January 2015, 06:00 UTC - Meteosat 10, IR 10.8 image. Magenta: height contours 1000 hPa, cyan: height contours 500 hPa. |
 |
 |
 |
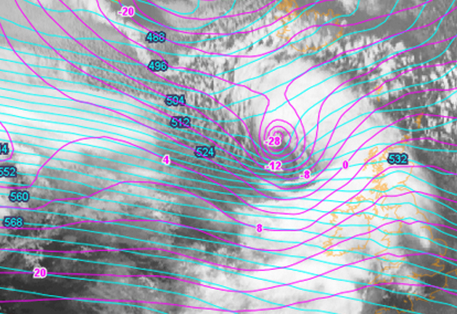 |
| Fig. 22c: 8 January 2015, 12:00 UTC - Meteosat 10, IR 10.8 image. Magenta: height contours 1000 hPa, cyan: height contours 500 hPa. | Fig. 22d: 8 January 2015, 18:00 UTC - Meteosat 10, IR 10.8 image. Magenta: height contours 1000 hPa, cyan: height contours 500 hPa. |
Temperature advection (TA) at 700 hPa
| Fig. 23a: Schematics of temperature advection. | Fig. 23a: 8 January 2015, 06:00 UTC - Meteosat 10, IR 10.8 image. Temperature advection 700 hPa; red: warm advection; blue: cold advection. |
 |
 |
 |
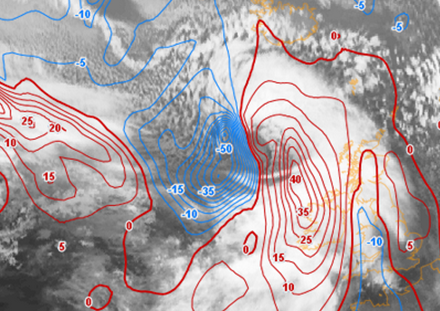 |
| Fig. 23b: 8 January 2015, 12:00 UTC - Meteosat 10, IR 10.8 image. Temperature advection 700 hPa; red: warm advection; blue: cold advection. | Fig. 23c: 8 January 2015, 18:00 UTC - Meteosat 10, IR 10.8 image. Temperature advection 700 hPa; red: warm advection; blue: cold advection. |
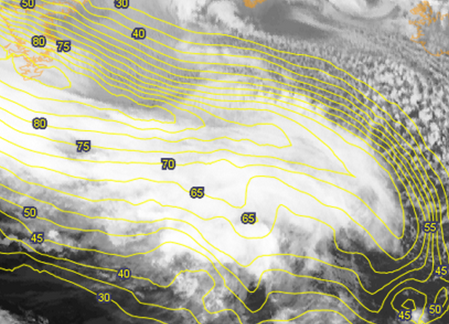
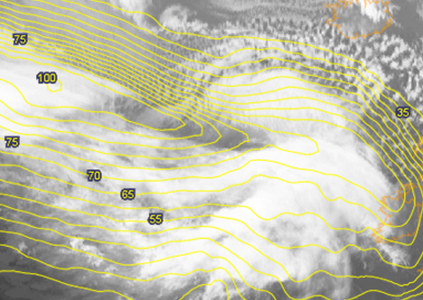
Isotachs at 300 hPa
| Fig. 24a: Schematics of isotachs at 300 hPa. | Fig. 24b: 8 January 2015, 06:00 UTC - Meteosat 10, IR 10.8 image. Yellow: isotachs 300 hPa. |
 |
 |
 |
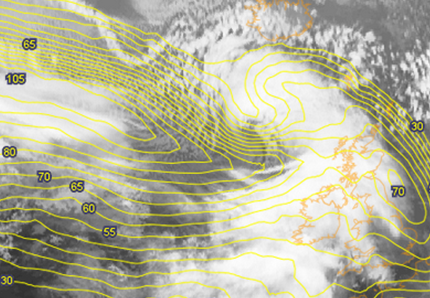 |
| Fig. 24c: 8 January 2015, 12:00 UTC - Meteosat 10, IR 10.8 image. Yellow: isotachs 300 hPa. | Fig. 24d: 8 January 2015, 18:00 UTC - Meteosat 10, IR 10.8 image. Yellow: isotachs 300 hPa. |
Vorticity advection at 300 hPa (PVA/NVA)
The field of vorticity advection is rather noisy and it is important to filter out the meteorologically irrelevant areas from the important ones. To make this easier the relevant PVA fields are marked by a black star and the NVA areas are encircled by a black line.
| Fig. 25a: Schematics of vorticity advection at 300 hPa. | Fig. 25b: 8 January 2015, 06:00 - Meteosat 10, IR 10.8. image. Vorticity advection 300 hPa; red: PVA; cyan: NVA; blue line: TFP CF; yellow line: jet axis 300 hPa; black line: CF cloud dissolution. |
 |
 |
 |
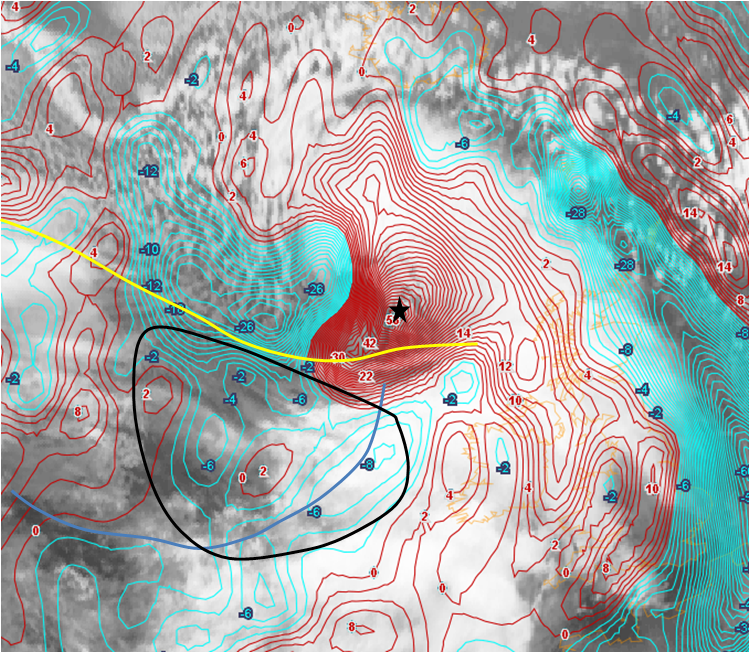 |
| Fig. 25c: 8 January 2015, 12:00 - Meteosat 10, IR 10.8. image. Vorticity advection 300 hPa; red: PVA; cyan: NVA; blue line: TFP CF; yellow line: jet axis 300 hPa; black line: CF cloud dissolution. | Fig. 25d: 8 January 2015, 18:00 - Meteosat 10, IR 10.8 image. Vorticity advection 300 hPa; red: PVA cyan: NVA; blue line: TFP CF; yellow line: jet axis 300 hPa; black line: CF cloud dissolution. |
Potential Vorticity (PV)
| Fig. 26a: Schematics of potential vorticity | Fig. 26b: 8 January 2015, 06:00 UTC - Meteosat 10, IR 10.8 image. Magenta: height of PV >1 unit. |
 |
 |
 |
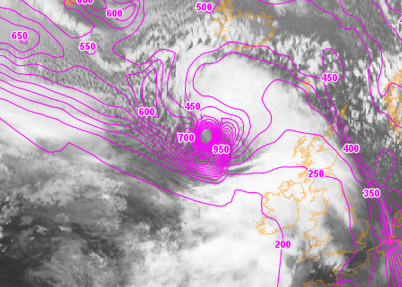 |
| Fig. 26c: 8 January 2015, 12:00 UTC - Meteosat 10, IR 10.8 image. Magenta: height of PV >1 unit. | Fig. 26d: 8 January 2015, 18:00 UTC - Meteosat 10, IR 10.8 image. Magenta: height of PV >1 unit. |