Table of Contents
Cloud Structure In Satellite Images
A Comma is a very prominent cloud feature that develops and exists in cold air. Several similar phenomena occur within cold air, such as Enhanced Cumulus cloudiness (see Enhanced Cumulus). Also found in cold air are vortex rings, crescents, ovals, solid cloudiness, multiple deep or shallow bands, single deep or shallow bands and swirls in cumulus streets.
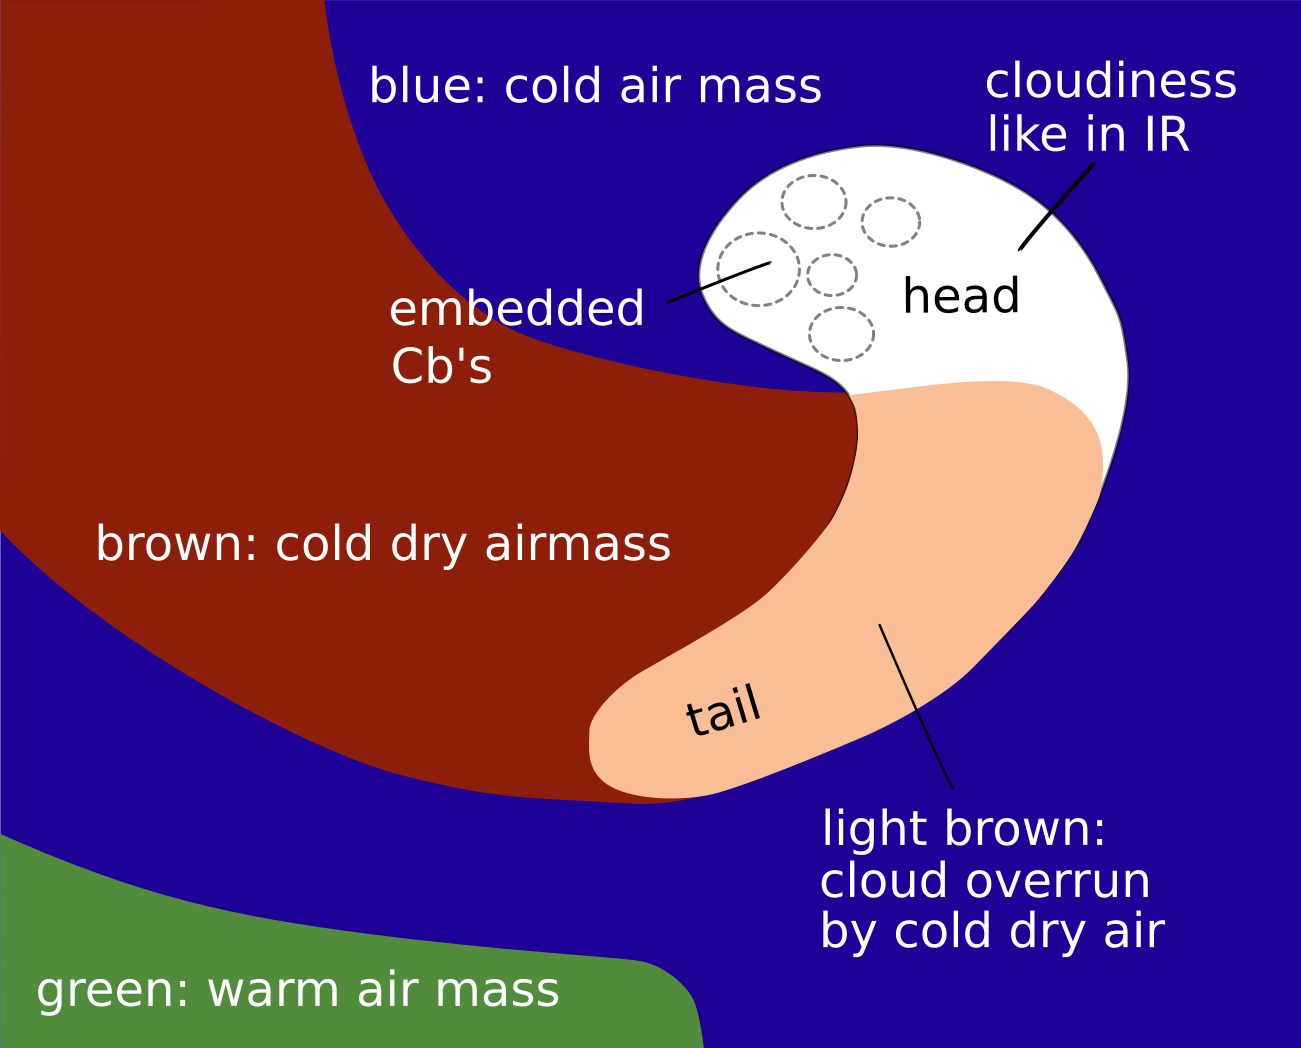
In order to distinguish the Comma from other cold air features, the Comma cloudiness is defined as a small to meso-scale cloud spiral consisting of white (i.e., cold) cloud cells partly overlaid by cirrus shields. In most cases the strongest convection can be found in the Comma tail, but sometimes enhanced convection can also be found in the Comma head. In a few cases the Comma head and tail are separated by a narrow cloud-free area or only connected by low clouds (although this may not be apparent throughout the whole lifetime of the system). Commas occur on scales between 200 and 1000 km, i.e., much smaller than a fully developed depression or a cyclone.
|
Larger Commas can be a sign of a development process called Cold Air Development (see Cold Air Development), where a Comma increases in size and finally gains some frontal characteristics.
Appearance in the basic channels
Comma head:
IR, VIS, WV: white, especially in the areas of embedded convection, representing rather thick cloud.
Comma tail:
IR, VIS and WV: light grey changing to white in the areas of convection. This represents lower cloud tops than on the head, where convection reaches higher of it exists.
 |
 |
Appearance in the basic RGBs:
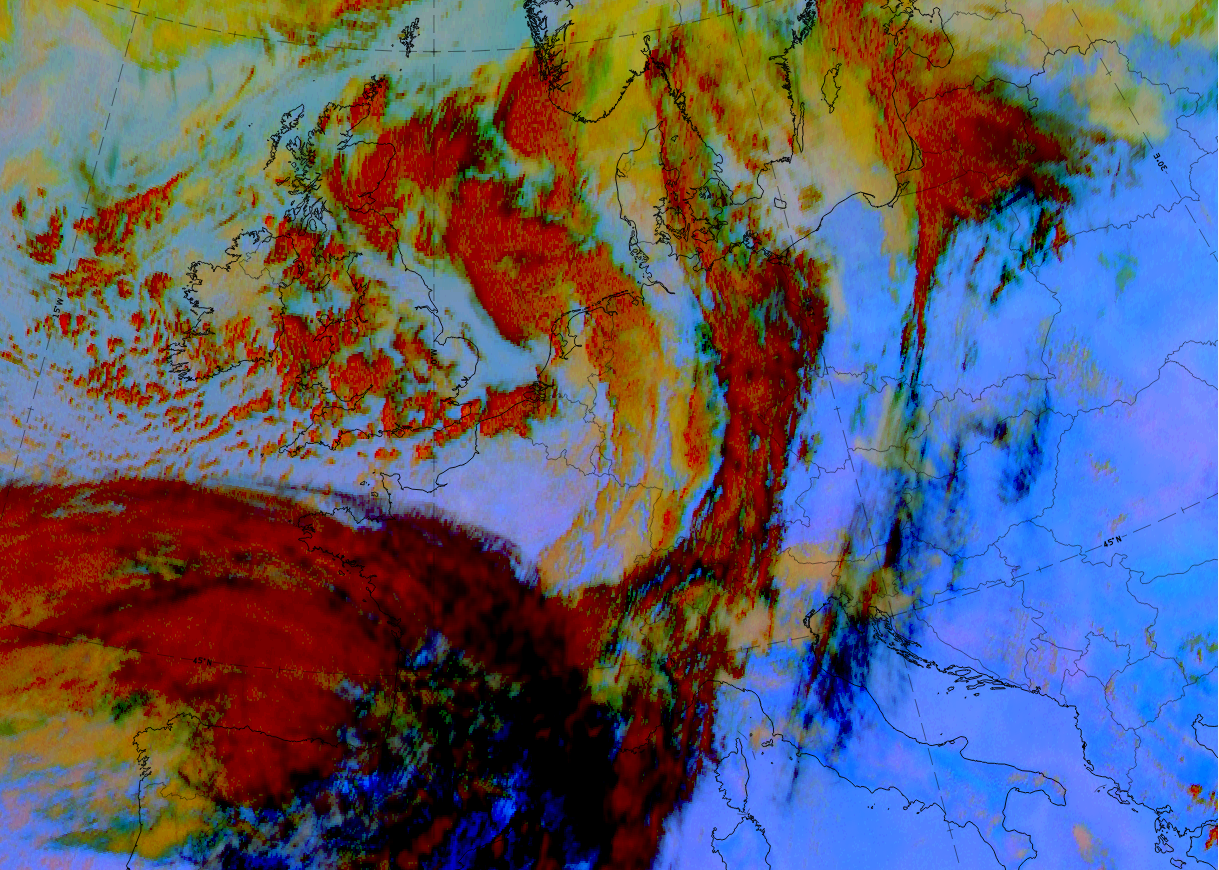
Airmass RGB:
A comma is a mesoscale cloud feature in the cold air outbreak behind a front; consequently, and unlike for other cloud configuration types, shows the Airmass RGB shows dark blue and brown colours, representing the cold and dry air mass within the comma is located. Very often the brownish colours appear behind the comma and penetrating the comma tail. The area between the comma and the previous frontal cloud band is either blue or brown, depending on the specific case.
The Comma cloud itself looks very similar to that in the IR image but, mostly overlaid by the brownish colour representing the dry air, adding a brownish shade to the bright white colours. This is especially true for the comma tail, which consists of lower cloud.
Dust RGB:
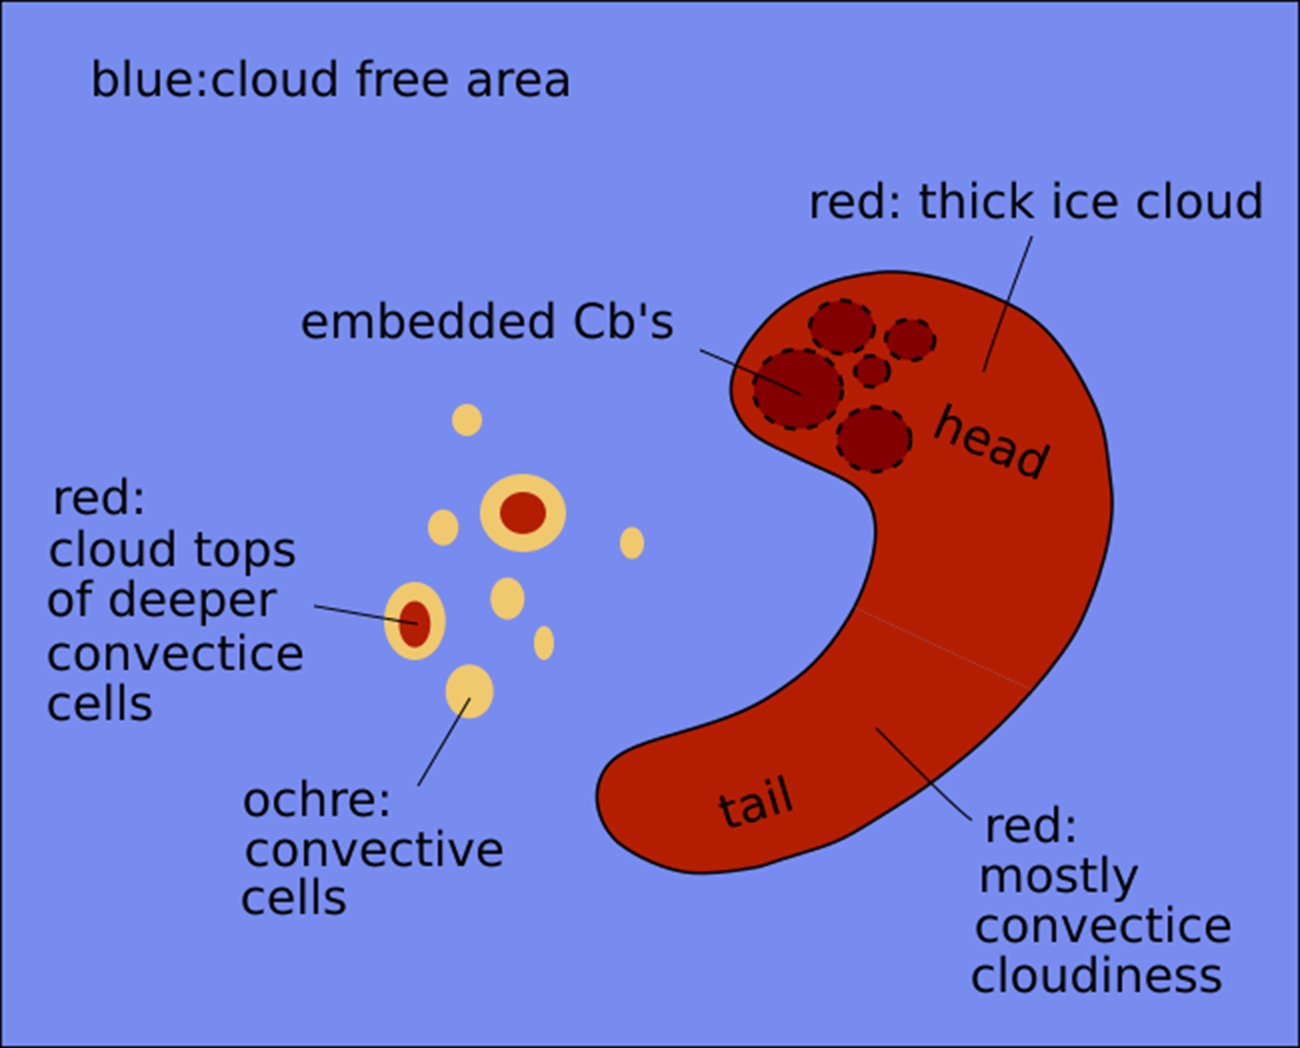
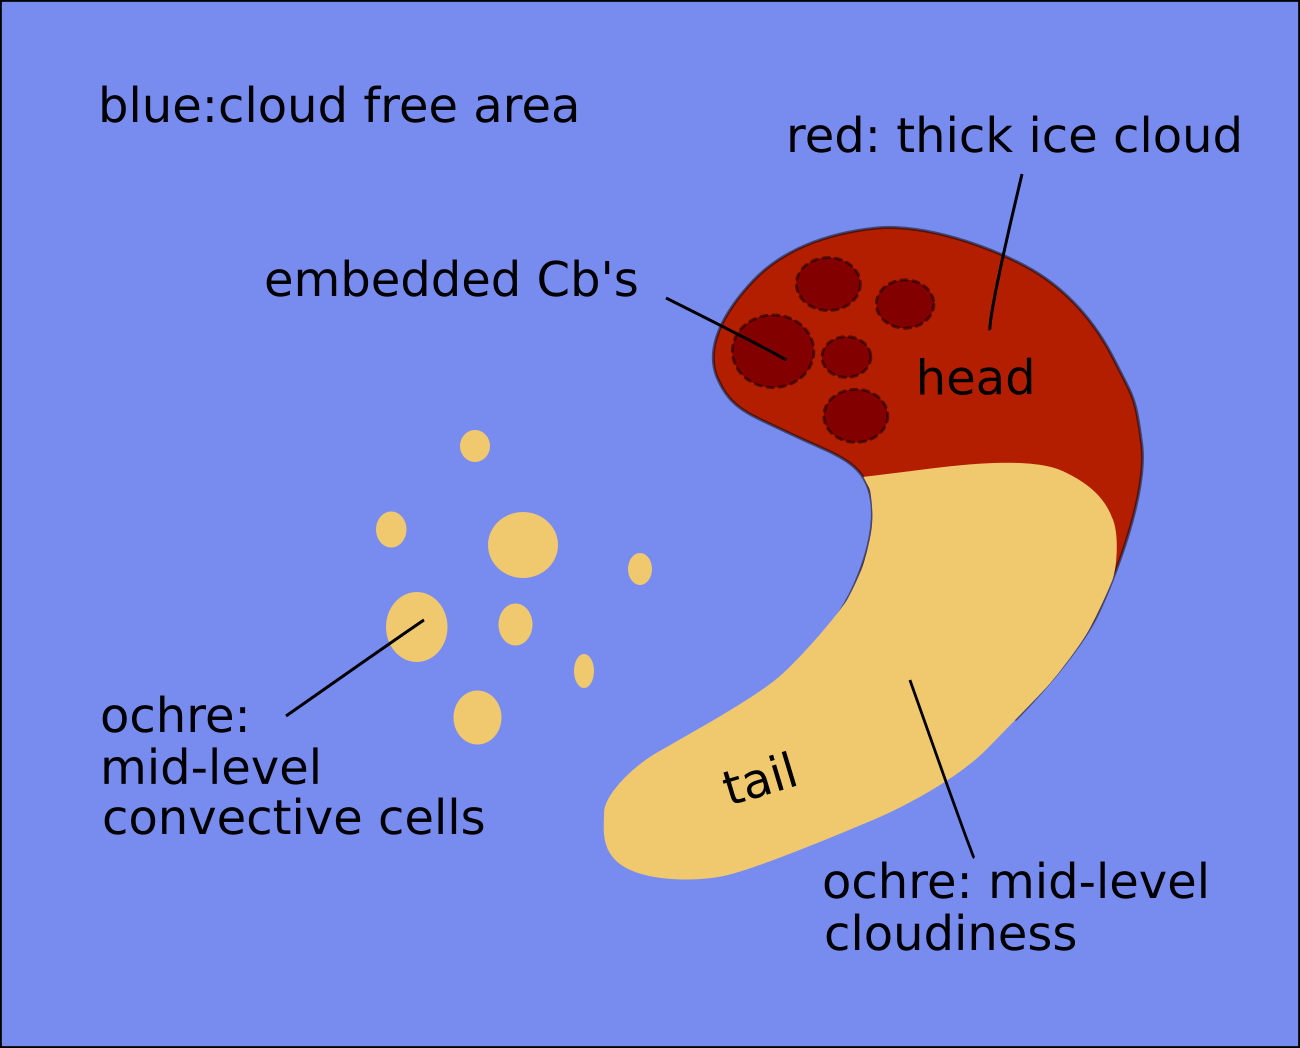
Unlike for other cloud configuration types, the Dust RGB shows blue or pinkish blue colours, representing cloud-free areas. Very often there is low cloud, which shows up as ochre colours.
The comma cloud consists of the dark red areas, representing the thicker and convective cloud parts; this very often includes the comma tail but there are also cases with lower cloud in the comma tail represented by ochre colours.
 |
|
 |
 |
Basic RGBs schematics. U. row: Airmass RGB
l.l.: Dust RGB for comma with thick cloud in head and tail; l.r.: Dust RGB for comma with lower cloud in the tail.
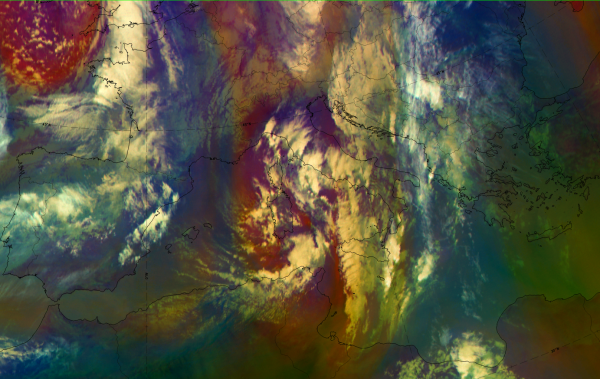
Data from 9 November 2019 at 12 show a mesoscale cloud spiral over northern Tunisia and the adjacent Mediterranean Sea.
|
|
||||||
|
|
||||||
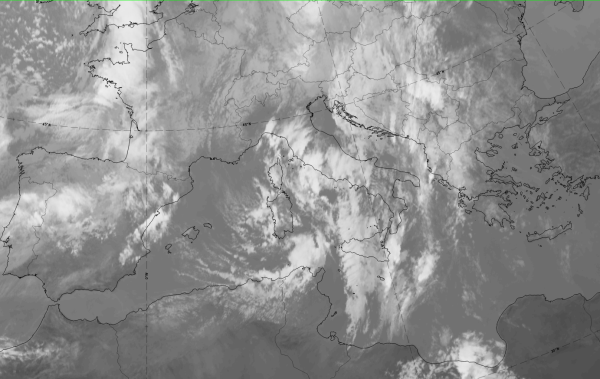
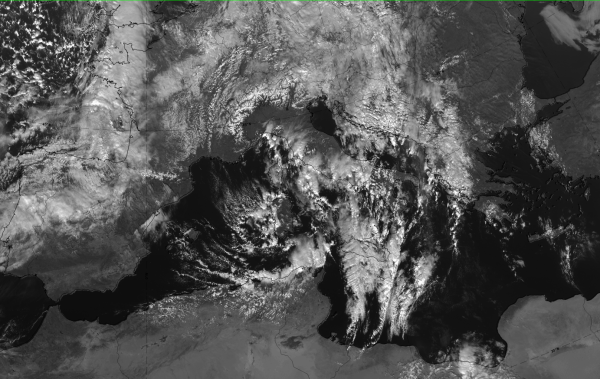
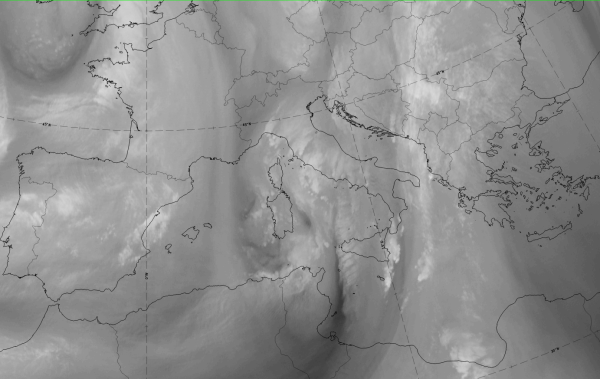
| IR | White with embedded Cbs in head and tail; grey areas at the leading part of the comma tail. |
| HRV | White with embedded Cbs; in comma tail only the Cbs are visible. |
| WV | Light grey with a dark stripe on the rear side approaching from the north. |
| Airmass RGB | Dark brown representing dry air to the front and rear of the comma; comma cloudiness is similar to IR but with a brownish "shade" indicating overflowing dry air. |
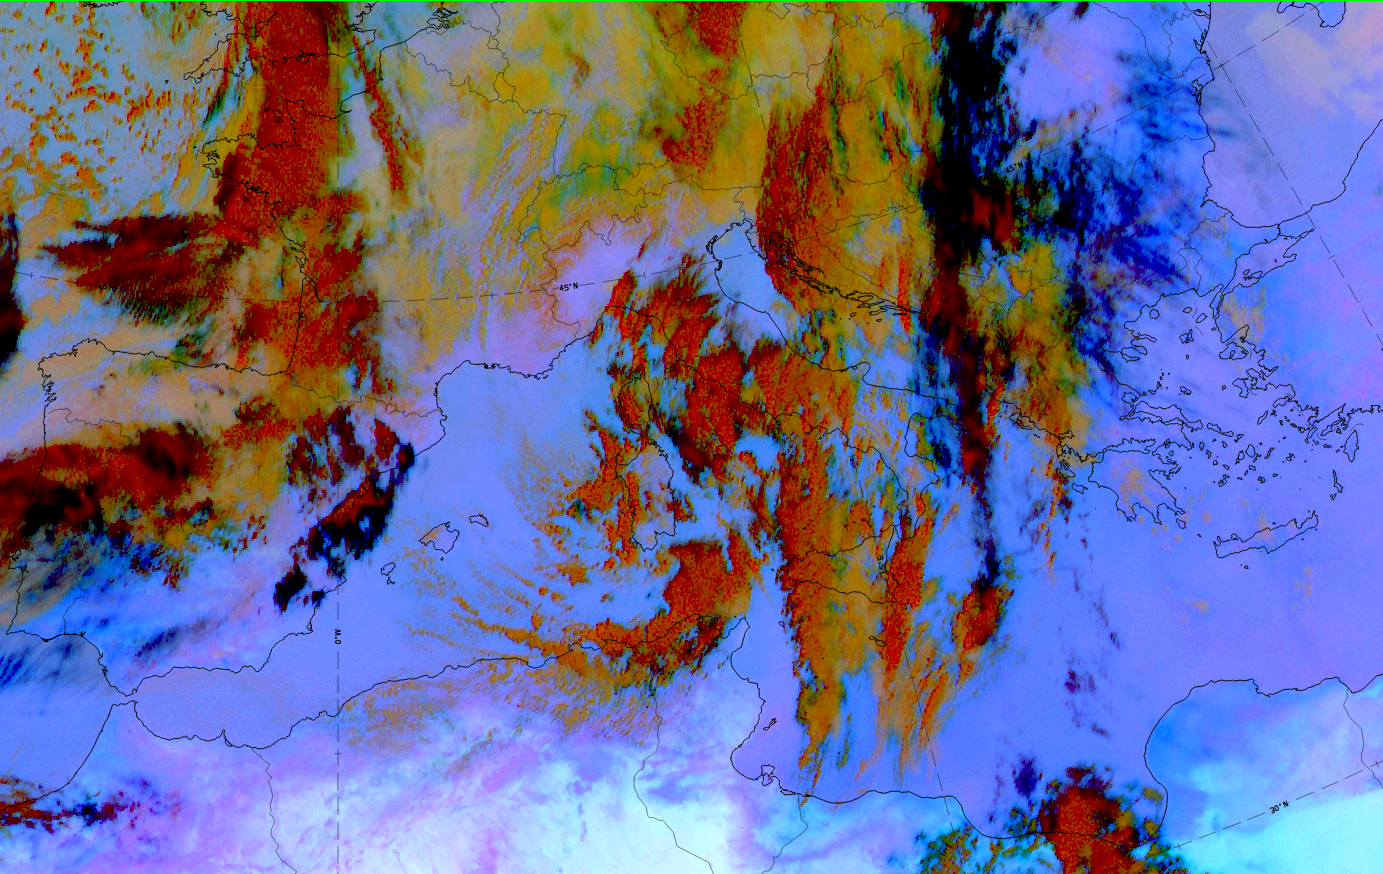
| Dust RGB | Dark red in the biggest part of the comma representing thick ice cloud; rather ochre colours in some parts of the comma tail representing mid-level water cloud. |
 |
 |
 |
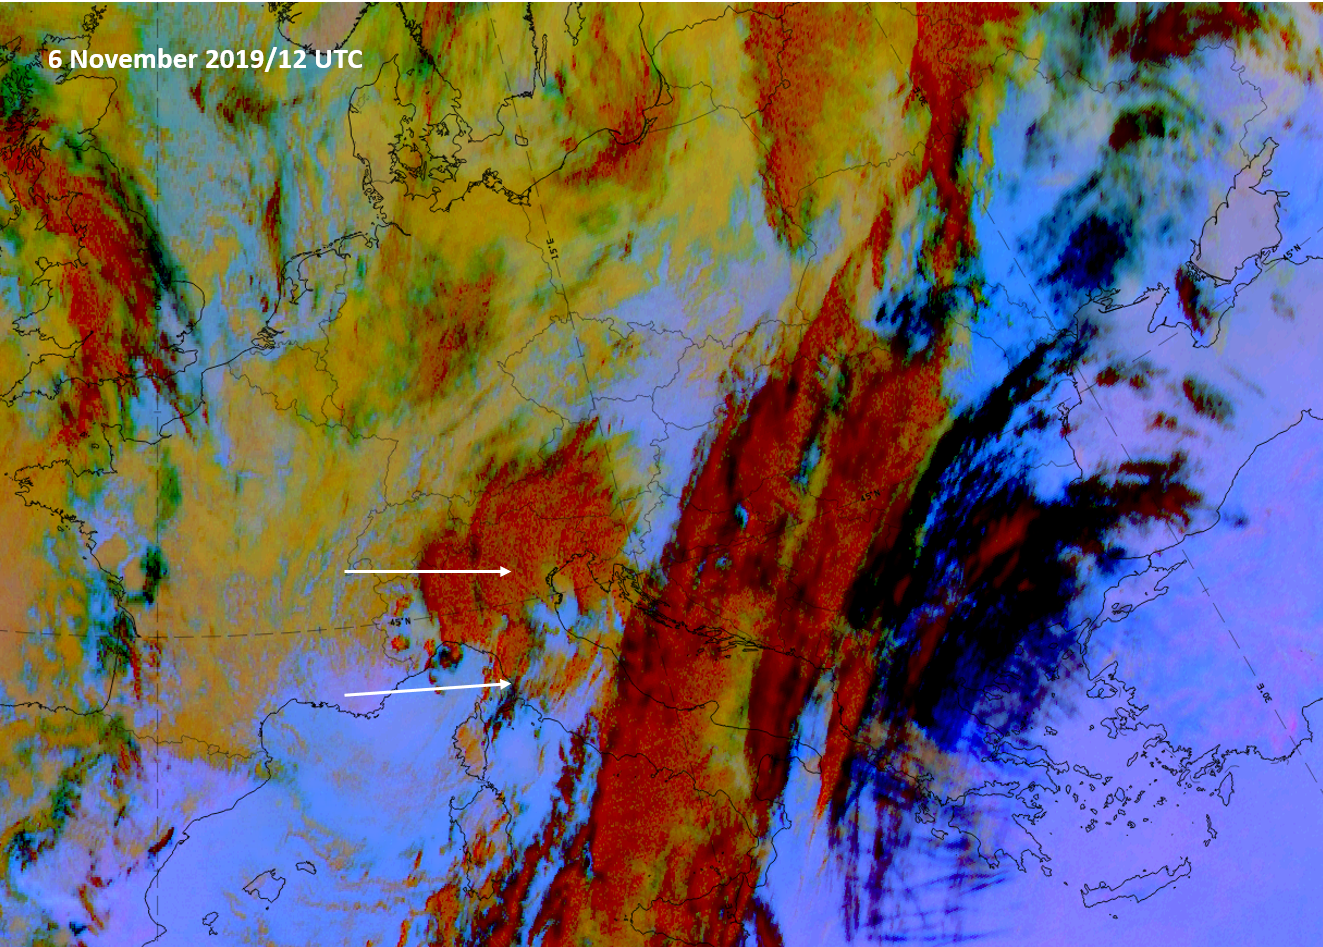 |
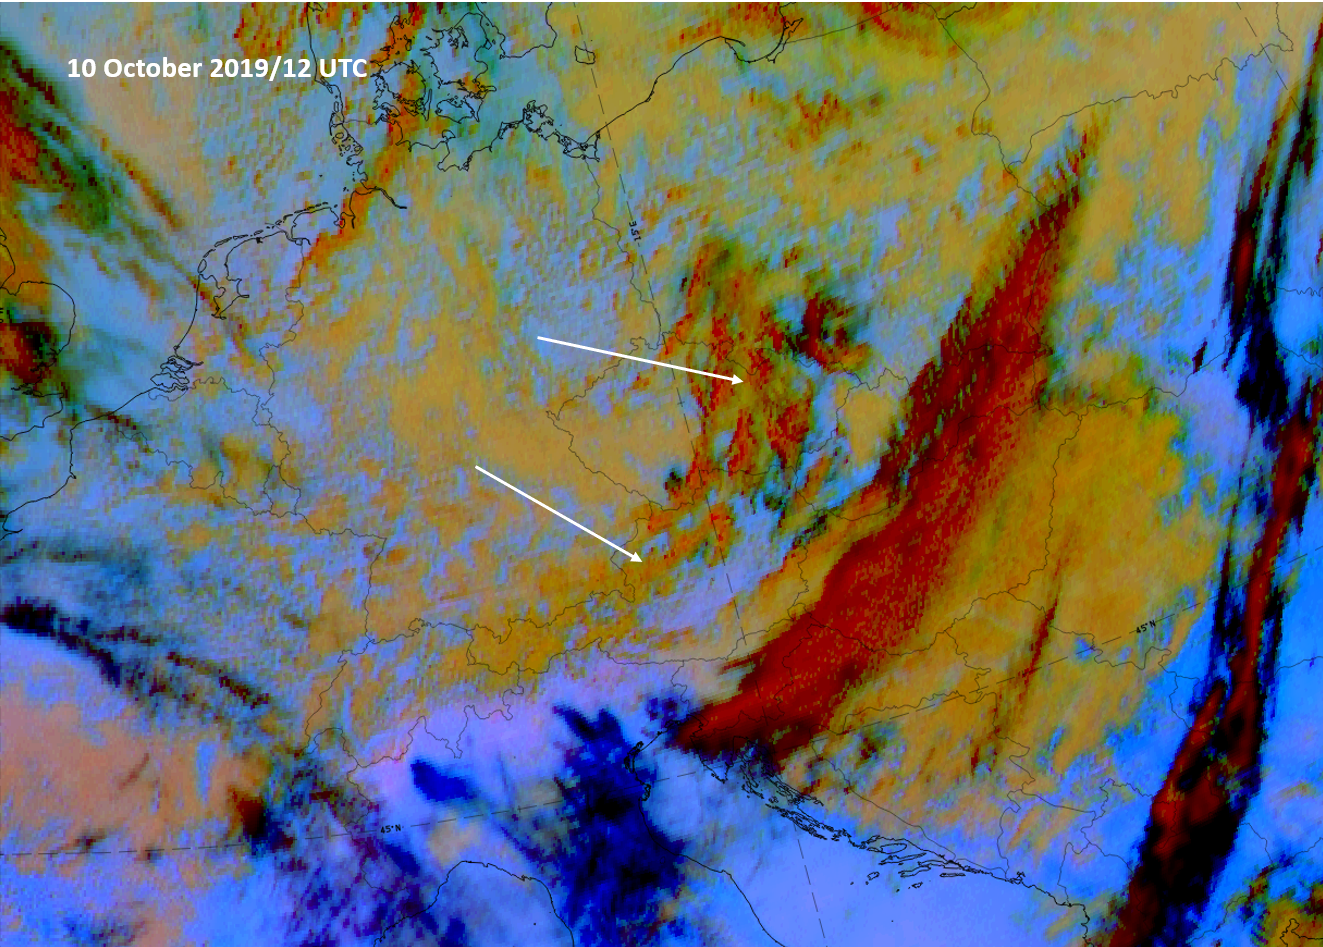
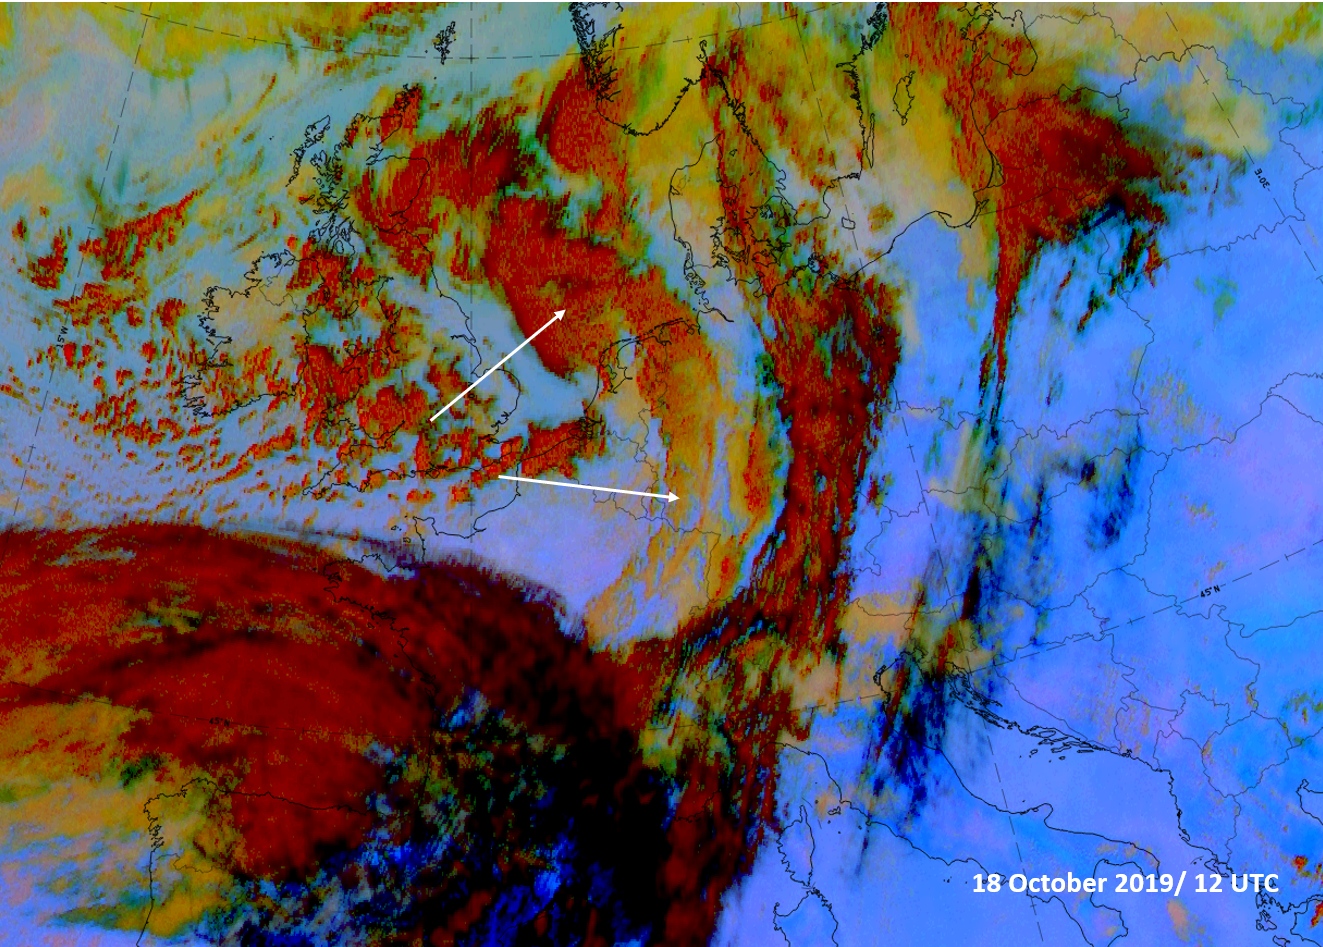
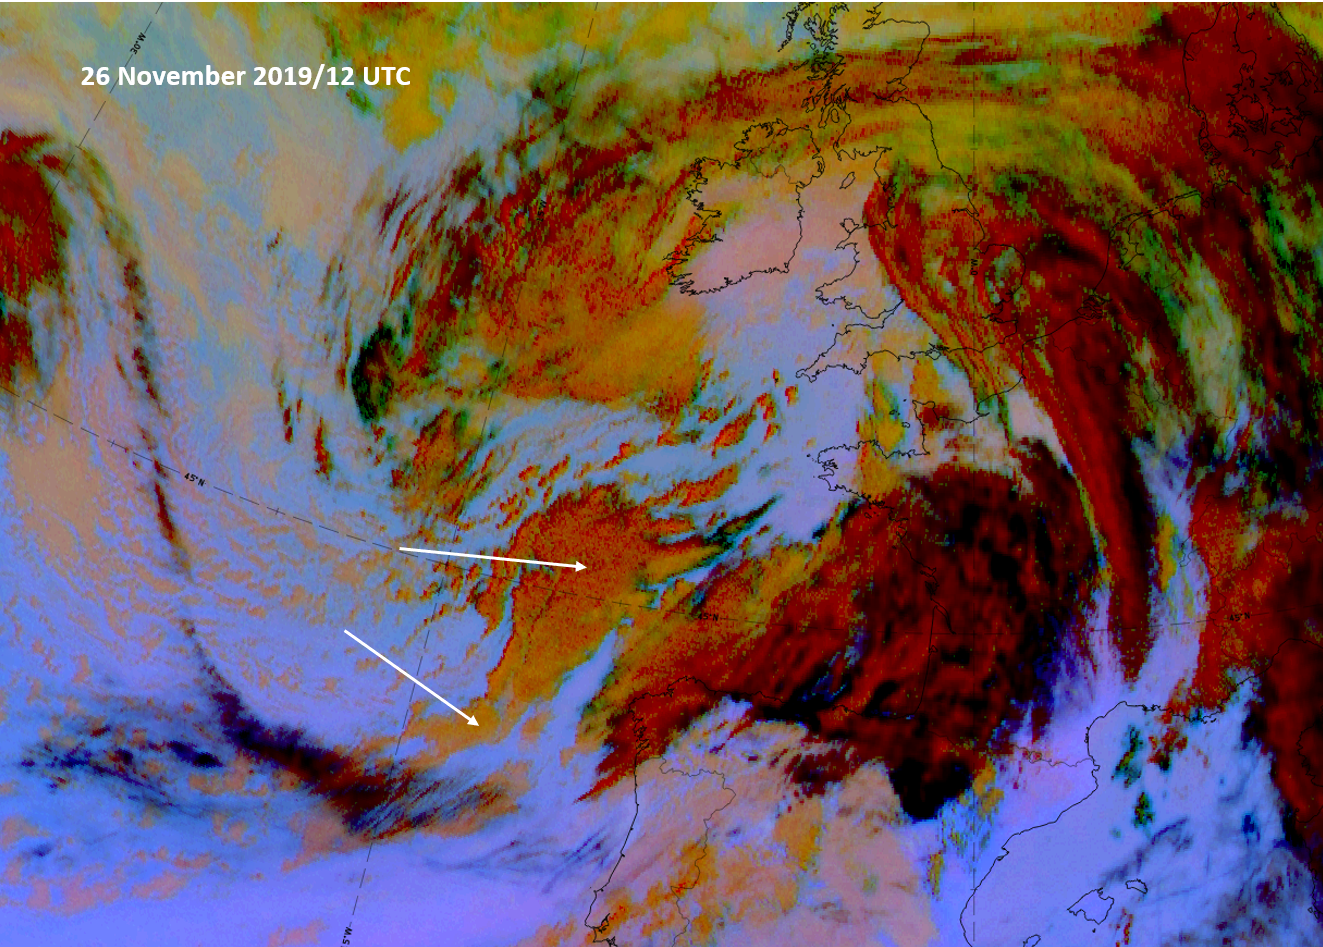
Examples of 4 different comma types; Dust RGB.
*Note: click on the image to access the image gallery (navigate using arrows on keyboard)
As mentioned in the introduction of this chapter, commas show a large variety of different configurations and structures; above are some examples which illustrate this. The case on 10th October (u.l.) forms a cyclonic spiral but consists of rather weak cloud with some small cells in the comma head and mid-level cloud in the comma tail. The case of 18 October (u.r.) is the opposite of this, showing a comma head with extended thick ice cloud on a scale already close to that of a fully developed stage of a "cold air development". The well-defined cloud spiral from 26 November (l.l.) on the cyclonic side of the jet axis (black cloud stripe) also shows the differentiation between a comma head under thick cloud and a cloud comma tail consisting of mid-level cloud while, in contrast to this, the case on 6 November (l.r.) shows developing and thick cells also in the comma tail, over Italy.
Meteorological Physical Background
Commas are quite frequent phenomena and whilst they can occur during the whole year they are slightly more common in winter time. Commas are often found over the Atlantic and Western Europe, but are rare in Central and Eastern Europe as they tend to weaken and dissolve over the continent. The usual areas for the development of Commas are higher latitudes which are also typical areas for the development of polar lows. Commas have also been observed on several occasions in the Mediterranean.
The typical horizontal scale of Commas is 200 to 1000 km and their duration can range from several hours to two days.
Here are different types of Comma development:
- Within cold air either
- as further development of Enhanced Cumulus cloudiness or
- as Polar Lows
- As a cut off from a mature and well developed Occlusion spiral
- There are a few other developments from Cold Air Development (CAD) and Baroclinic Boundaries. They are regarded as exceptions and are not addressed further here.
Development of Commas within cold air
The classical development within cold air masses is the most common. A typical life cycle is shown below using a sequence of satellite images (interval one hour).
The development starts from Enhanced Cumulus cloudiness (see Enhanced Cumulus ) which is increasing and, under the influence of vorticity, and finally forms into the typical Comma spiral shape with a Comma head and a Comma tail. This happens mostly in the cold air behind a frontal cloud band under the influence of vorticity and positive vorticity advection.
|
A maximum of CVA is connected with upward motion in the preferred areas in front of an upper level trough (curvature vorticity) and in the left exit region of a jet streak (shear vorticity)
|
25 April 2005/00.00 UTC - Meteosat 8 IR 10.8 image; red: vorticity advection 500 hPa
|
25 April 2005/03.00 UTC - Meteosat 8 IR 10.8 image
|
|

|
|
25 April 2005/06.00 UTC - Meteosat 8 IR 10.8 image
|
|
|
There are different theories relating to the forcing mechanisms leading to Comma development.
Baroclinic instability
One theory focuses on baroclinic instability. Although baroclinic instability is regarded as a larger scale phenomenon, it can also be used for explaining smaller systems.
Baroclinic waves with a wave length of about 3000 to 4000 km usually show a rapid rate of growth. If parameters such as vertical wind shear (large horizontal temperature gradient) and static stability are taken into account, disturbances with much shorter wave length can also grow rapidly if a jet streak is involved. (For more details see Reed, 1979)
Many case studies of Commas made at ZAMG (more than 50) showed baroclinity at high levels which would support this theory. One example is shown below.
|
25 April 2005/06.00 UTC - Meteosat 8 IR 10.8 image; position of vertical cross section indicated
|
25 April 2005/06.00 UTC - Vertical cross section; black: isentropes (ThetaE), blue: relative humidity, orange thin: IR pixel
values, orange thick: WV pixel values
|
|

|
The image shows a Comma feature extending west of Ireland, 53N25W. In the vertical cross section (right) a frontal zone at middle levels (500 - 700 hPa) can be detected.
Barotropic instability
Barotropic instability should also be taken into account when considering a Comma formation. Commas develop on the left side of the polar jet axis. The problem with this theory is the scale: The wavelength of maximum instability is about four times the half-width of the jet. If a Comma (Polar Low) is assumed to have a wavelength of 1000 km the jet would not normally be broader than 250 km in half-width, which is unrealistically small. (For more details see Reed, 1979).
Case studies found in the literature, as well as the ones studied at ZAMG, support this theory with respect to the location of the Comma on the left (cyclonic) side of the jet.
So both theories can explain some features of Comma development but are not totally satisfactory.
CISK mechanism
Another theory is Conditional Instability of the Second Kind (CISK) which focuses on the unstable convective characteristic of the Comma phenomenon. The underlying assumption of this theory states that cumulonimbus convection alone cannot maintain the low-level convergence necessary for the development of clouds. Therefore large scale convergence is also essential. If an air parcel rises in a conditionally unstable, unsaturated air mass, it will give rise to cumulonimbus convection because of the release of latent heat. The vertical distribution of the wind field (low level convergence and high level divergence) results in a convergence of moisture in the boundary layer and an increase of cyclonic vorticity. As a consequence vertical velocity will increase at the top of the Ekman layer. Now a positive feed-back loop is established which amplifies convection as well as the large-scale convergence. This theory was developed for tropical cyclones as the atmosphere normally is (conditionally) unstable at lower latitudes. In several aspects this process is also true for other regions, e.g. if cold polar air streams over a relative warm sea surface.
This theory is supported by those cases where a Comma develops from an EC area far behind the frontal cloud band.
Potential vorticity
Another interesting point of view is the role of potential vorticity (PV). If there is an upper tropospheric PV maximum rising motion occurs at the leading edge - assuming the PV maximum is sinking. There is also a region of reduced static stability there. If a major incursion of high PV overruns a region of moist air and strong baroclinity it leads to cyclogenesis, especially if the induced upward motion ahead of the PV anomaly becomes moist and diabatic effects are involved. (For more details see Browning, 1993)
This theory is supported in the case studies by the fact that a very large number of Commas are associated with a PV anomaly, represented by a very low height of the PV=2 surface, which corresponds to the transition between tropospheric and stratospheric air.
|
07 December 2004/18.00 UTC - Meteosat 8 IR 10.8 image; magenta: Height of PV=2 units
|
|

|

|
The case from 07 December 2004 shows a lowering of the tropopause just behind the Comma to around 500 hPa. In the Comma itself a relatively high tropopause can be found.
Further development
Commas, once developed, can be involved in or can be the starting point of other conceptual models such as Instant Occlusion (see Instant Occlusion ) or Cold Air Development (see Cold Air Development ).
Development of Commas from Occlusion spirals
If an Occlusion is accompanied by a very intensive, pronounced cloud spiral the innermost part can become separated, i.e. the connection between the Occlusion spiral and the rest of the cloud spiral becomes an area of only shallow cloudiness and finally disappears so that the remaining Comma cloud becomes a separate feature. Sometimes the innermost part of the Occlusion cloud band disappears and a Comma develops in the cloud-free area. Nevertheless its origin is the Occlusion spiral.
The area where this separation happens is the north-western part of the Occlusion cloud band which disappears as a result of negative vorticity advection and divergence in lower levels. This happens to the rear of the upper level low or trough. In contrast, the innermost part of the Occlusion cloud spiral lies in an area with positive vorticity advection and sometimes within an area of convective activity. Therefore, this is an area where cloudiness can become enhanced.
A Comma which is generated by an Occlusion is shown by the following sequence of satellite images (interval six hours). Such a development is less frequent than the development of Commas within cold air mentioned above.
|
07 December 2004/06.00 UTC - Meteosat 8 WV 6.2 image
|
07 December 2004/12.00 UTC - Meteosat 8 WV 6.2 image
|
|
|

|

|
|
07 December 2004/18.00 UTC - Meteosat 8 WV 6.2 image
|
08 December 2004/00.00 UTC - Meteosat 8 WV 6.2 image
|
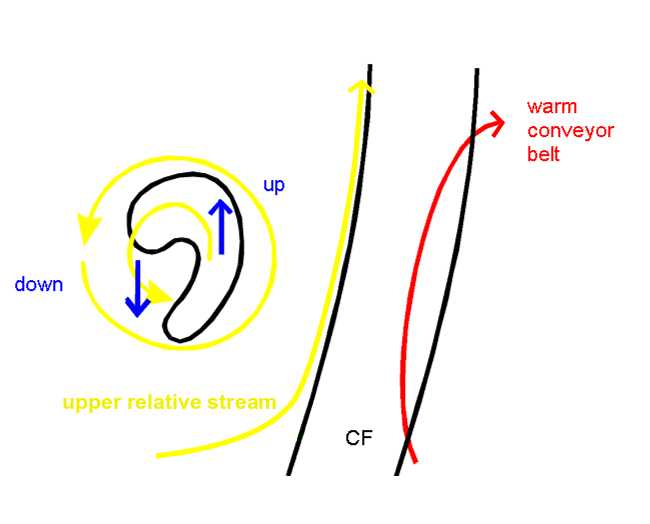
Relative streams and Commas
From the viewpoint of conveyor belt theory, Commas usually lie within one single air mass, the dry intrusion.
Relative streams related to Commas show a characteristic pattern, namely, an isolated cyclonic circulation around the cloud spiral with upward motion within the cloudiness and descending motion behind. This circulation can be observed at all levels above the unstable air mass, up to the tropopause and does not change much between different levels. Only vertical motion is decreasing with height. In the case of Commas without specific circulation, a pronounced cyclonic curvature of the streamlines can usually be found.
|
|
|
29 March 1999/06.00 UTC - Meteosat IR image; magenta: relative streams 282K - system velocity: 247° 16 m/s, yellow: isobars
282K
|
29 March 1999/06.00 UTC - Meteosat IR image; magenta: relative streams 300K - system velocity: 247° 16 m/s, yellow: isobars
300K
|

|
|
Key Parameters
- Height Contours 500 and 1000 hPa:
show a marked trough, sometimes even an isolated low. The Comma is situated at the leading edge of or near the trough line. Commas are situated at the cyclonic side of the polar jet. There may also be a left exit region of a jet streak (see below). - Temperature advection:
Since Commas are cold air features they are mainly situated in cold advection. Commas which are also partly in Warm Advection have higher baroclinic instability and show a higher probability for further development into Instant Occlusion and Cold Air Development (see Instant Occlusion and Cold Air Development ) - Instability indices:
Commas are characterised by a rather unstable air mass. The typical range of the Showalter index with Commas is 0 to (max) 9, but mostly around 3. But strong instability is rarely seen in the Showalter field even though there can be heavy precipitation. The unstable air mass extends from the surface to about 800 - 700 hPa (see Typical appearance in vertical cross sections), a layer which is probably too low to be fully resolved by the Showalter index (which starts at 850 hPa). The Boyden index shows values that exceed 95. - Relative vorticity at 500 hPa:
is always positive, i.e. cyclonic. The maximum can be found to the rear of the cloud spiral. Both components (curvature and shear vorticity) are positive. Curvature vorticity dominates in the majority of cases, but shear vorticity is also important, especially at 300 hPa and if the Comma is situated in the left exit region of a jet streak (see further below). - PVA at 500 hPa:
has its maximum above the Comma cloud or sometimes shifted to the south. At a level of 300 hPa the maximum is not so pronounced although absolute values are not smaller. There is also a correlation between the two levels: If there is no or only a weak maximum at 500 hPa the probability of a pronounced maximum at 300 hPa is quite small; a left exit region of a jet streak can lead to higher values at 300 hPa. - Isotachs at 300 hPa:
Cyclonic vorticity and PVA at 300 hPa can also be the reason for the position of a Comma in a left exit region of a jet streak. But, in these situations shear vorticity dominates curvature vorticity and the Comma spiral structures are rather weak. - Potential vorticity:
The height of PV=2 units shows a maximum to the rear of the cloud spiral which is equivalent to a lowering of the tropopause there to around 400 hPa. This is significantly lower than at the corresponding frontal cloud bands. Behind a Cold Front a low height of the PV can be observed in a rather large area parallel to the front, but for the Comma a characteristic maximum can be observed (lowest level in the troposphere).
Height Contours 1000 hPa/Surface Pressure
|
|
25 April 2005/00.00 UTC - Meteosat 8 IR 10.8 image; magenta: height contours 1000 hPa
|

|

|
Height Contours 500 hPa/Surface Pressure
|
|
25 April 2005/00.00 UTC - Meteosat 8 IR 10.8 image; magenta: height contours 500 hPa
|

|
|
Temperature Advection
|
|
25 April 2005/00.00 UTC - Meteosat 8 IR 10.8 image; red: Temperature Advection 1000-500 hPa
|
|

|
Boyden Index
|
|
25 April 2005/00.00 UTC - Meteosat 8 IR 10.8 image; red: Boyden Index
|
|

|
Relative Vorticity 500 hPa
|
|
24 April 2005/18.00 UTC - Meteosat 8 IR 10.8 image; cyan: relative vorticity 500 hPa
|
|

|
Positive Vorticity Advection 500 hPa
|
|
25 April 2005/00.00 UTC - Meteosat 8 IR 10.8 image; red: positive vorticity advection 500 hPa
|
|

|
Isotachs 300 hPa
|
|
24 April 2005/18.00 UTC - Meteosat 8 IR 10.8 image; yellow: Isotachs 300 hPa
|

|

|
Height of PV=2 units/Height of tropopause
|
|
25 April 2005/00.00 UTC - Meteosat 8 IR 10.8 image; magenta: Height of PV=2 units
|

|

|
Typical Appearance In Vertical Cross Sections
- ThetaW:
One of the most characteristic properties of Commas is the instability in lower and middle levels. The unstable air mass is indicated by the distribution of the isentropes up to 800 - 700 hPa. In most cases no frontal character can be seen in the lower troposphere, but in upper levels (above 500 or 600 hPa) sometimes one can see a downward inclination of the isentropes leading to a higher gradient. The peak belonging to the Comma feature under consideration is the one in the right half of the cross section (52.5N/24W). The more western peaks belong to convective areas in the centre of the Comma spiral. - Relative Vorticity:
Commas exist in areas of positive relative vorticity throughout the whole vertical cross section. The maximum lies to the rear at about 400 hPa (never below 500 hPa and not higher than 300 hPa). - Vorticity Advection (PVA/NVA):
Vertical cross sections show PVA above the cloudy area with its maximum in the upper troposphere, in advance of the corresponding vorticity maximum. There can be both PVA and NVA behind and in front of the Comma. - Omega:
Commas are often associated with upward motion throughout the whole atmosphere. - Temperature Advection:
The profile of temperature advection usually shows cold advection in the lower levels trough out the whole area of the Comma. In middle and upper-levels some warm advection can be found over the cloudy area, and cold advection behind the Comma. - Divergence:
The vertical distribution of divergence shows convergence in lower levels often decreasing with height; that can result in divergence in upper levels. This is consistent with upwards motion (see above). Convergence is generally found near the cloudy area but may sometimes be present in the surrounding areas. Convergence is occurring in this case in a thick layer from the surface up to 700 hPa.
As shown below the appearance of a Comma in a vertical cross section is best described by a cross section taken south of the Comma head.
|
25 April 2005/06.00 UTC - Meteosat 8 IR 10.8 image; position of vertical cross section indicated
|
|

|
ThetaW
|
|
25 April 2005/06.00 UTC - Vertical cross section; black: isentropes (ThetaE), orange thin: IR pixel values, orange thick: WV pixel
values
|

|
|
Relative Vorticity
|
|
25 April 2005/06.00 UTC - Vertical cross section; black: isentropes (ThetaE), blue: relative vorticity, orange thin: IR pixel
values, orange thick: WV pixel values
|

|

|
Vorticity Advection (PVA/NVA)
|
|
25 April 2005/06.00 UTC - Vertical cross section; black: isentropes (ThetaE), green thick: vorticity advection - PVA, green thin:
vorticity advection - NVA, orange thin: IR pixel values, orange thick: WV pixel values
|
|

|
Vertical Motion (Omega)
|
|
25 April 2005/06.00 UTC - Vertical cross section; black: isentropes (ThetaE), cyan thick: vertical motion (omega) - upward motion,
cyan thin: vertical motion (omega) - downward motion, orange thin: IR pixel values, orange thick: WV pixel values
|

|

|
Temperature Advection
|
|
25 April 2005/06.00 UTC - Vertical cross section; black: isentropes (ThetaE), red thick: temperature advection - WA, red thin:
temperature advection - CA, orange thin: IR pixel values, orange thick: WV pixel values
|

|

|
Divergence
|
|
25 April 2005/06.00 UTC - Vertical cross section; black: isentropes (ThetaE), magenta thin: divergence, magenta thick: convergence,
orange thin: IR pixel values, orange thick: WV pixel values
|

|

|
Weather Events
Commas can be split into a head and a tail, whereby the head clouds are layered, with dynamical precipitation and the tail clouds are more convective, with showery precipitation.
| Parameter | Description |
| Precipitation (incl. thunder) |
|
| Temperature |
|
| Wind (incl. gusts) |
|
| Other relevant information |
|
These features are best illustrated using data from 18 October 2019 at 12 UTC, when a huge comma occurred, with its head over the North Sea and its tail extending from the Netherlands into France. The comma head shows with the dark red colour thick ice cloud with a lumpy structure in dark red, while the tail consists mostly of mid-level cloud represented by the ochre colours.
18 October 2019,12 UTC; Dust RGB.
|
|
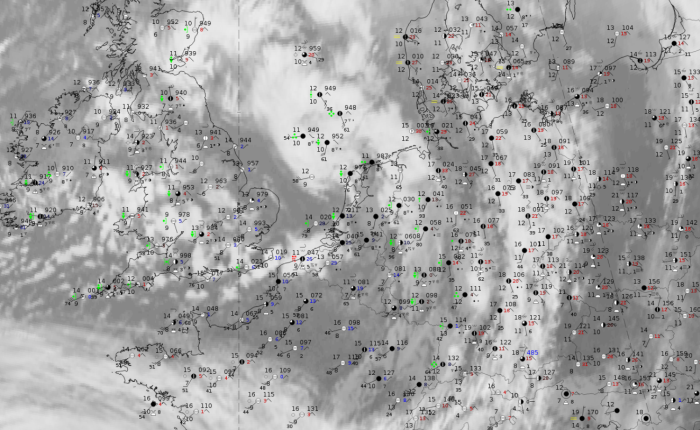
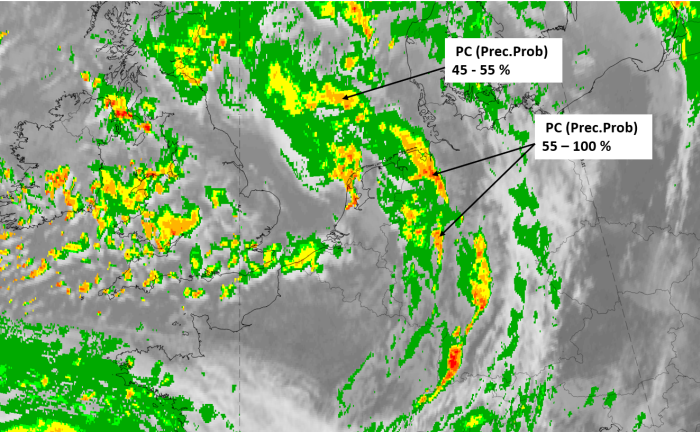
18 October 2019, 12UTC: IR + synoptic measurements (above) + probability of moderate rain (Precipitting clouds PC - NWCSAF).
Note: for a larger SYNOP image click this link.
There where wide-spread precipitation reports based on the synoptic measurements, with more intensity in the comma head than in the comma tail. The probabilities of precipitation from the NWCSAF show values of more than 55-65 % represented by orange and red colours in parts of the comma head.
|
|
|
|
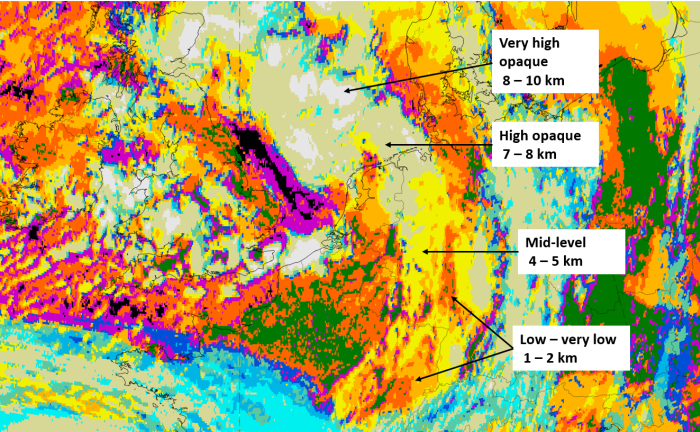
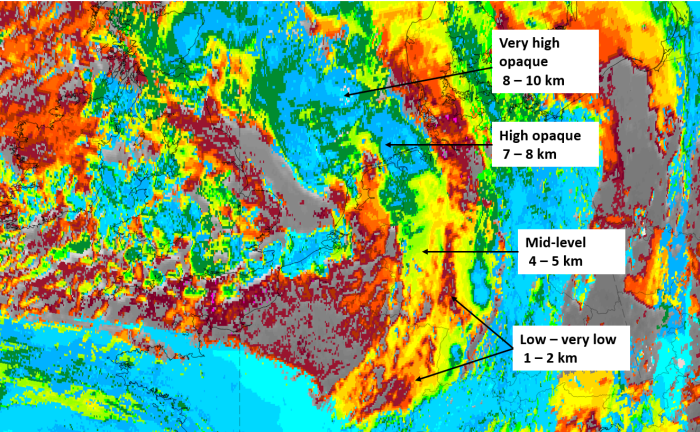
18 October 2019, 12 UTC, IR; superimposed:
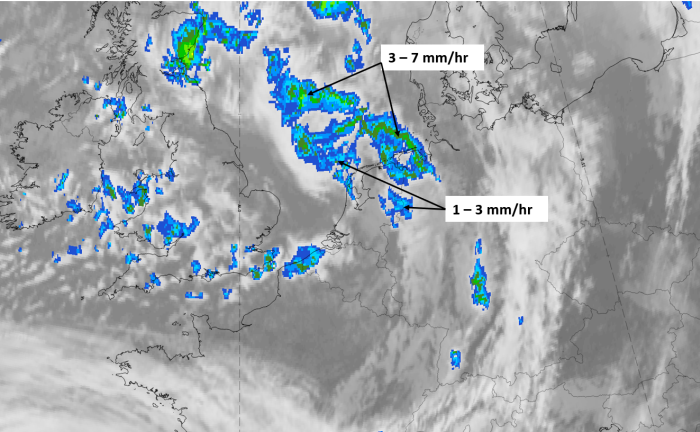
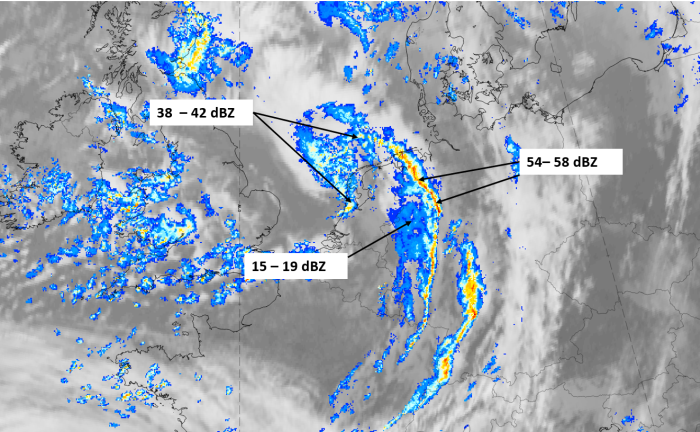
1st row: Cloud Type (CT NWCSAF) (above) + Cloud Top Height (CTTH - NWCSAF) (below); 2nd row: Convective Rainfall Rate (CRR NWCSAF) (above) + Radar intensities from Opera radar system (below).
For identifying values for Cloud type (CT), Cloud type height (CTTH), precipitating clouds (PC), and Opera radar for any pixel in the images look into the legends. (link)
References
General Meteorology and Basics
- FORBES, LOTTES (1985): Classification of Mesoscale Vortices in Polar Airstreams and the Influence of the Large-scale Environment on their Evolutions, Tellus, 37A, 132 - 155
- RASMUSSEN (1979): The Polar Low as an Extratropical CISK Disturbance, Quart. J. Royal Meteor. Soc., 105, 531-549
- REED (1979): Cyclogenesis in Polar Air Streams, Monthly Weather Review, 107, 38-52
- TURNER, LACHLAN-COPE, THOMAS (1993): A Comparison of Arctic and Antarctic Mesoscale Vortices, J. Geophysical Research, 98, D7, 13019-13034
General Satellite Meteorology
- CARLETON, CARPENTER (1989): Satellite climatology of Polar Lows and Broadscale Climatic Associations for the Southern Hemisphere, Int. J. Climatology, 10 (3), 219-246
- CLAUD ET AL (1993): Satellite Observations of a Polar Low over the Norwegian Sea by Special Sensor Microwave Imager, Geosat, and TIOS-N Operational Vertical Sounder, J. Geophysical Research, 98, C8, 14487-14506
Specific Satellite Meteorology
- BROWNING (1993): Evolution of a Mesoscale Upper Tropospheric Vorticity Maximum and Comma Cloud from a Cloud-free Two-dimensional Potential Vorticity Anomaly, Quar. J. Meteor. Soc., 119, 513, 883-906
- CRAIG (1992): A Study of Two Cases of Comma-Cloud Cyclogenesis Using a Semigeostrophic Model, Monthly Weather Review, 2942-2961
- REED (1979): A Case study of Comma Cloud Development, Monthly Weather Review, 114, 1681-1695
- REED (1979): A Further Case study of Comma Cloud Development, Monthly Weather Review, 114, 1696 -17
Special investigation: Comma spirals in the Mediterranean
Introduction and problem
Commas are mesoscale cloud spirals; they usually develop in the cold air behind large-scale frontal systems, within an upper-level trough. Their dynamical background is typically characterised by anomalies in numerical parameters such as CVA (Cyclonic Vorticity Advection), often in the left exit region of a jet streak, and PV (Potential Vorticity) . They are mostly very active cloud systems.
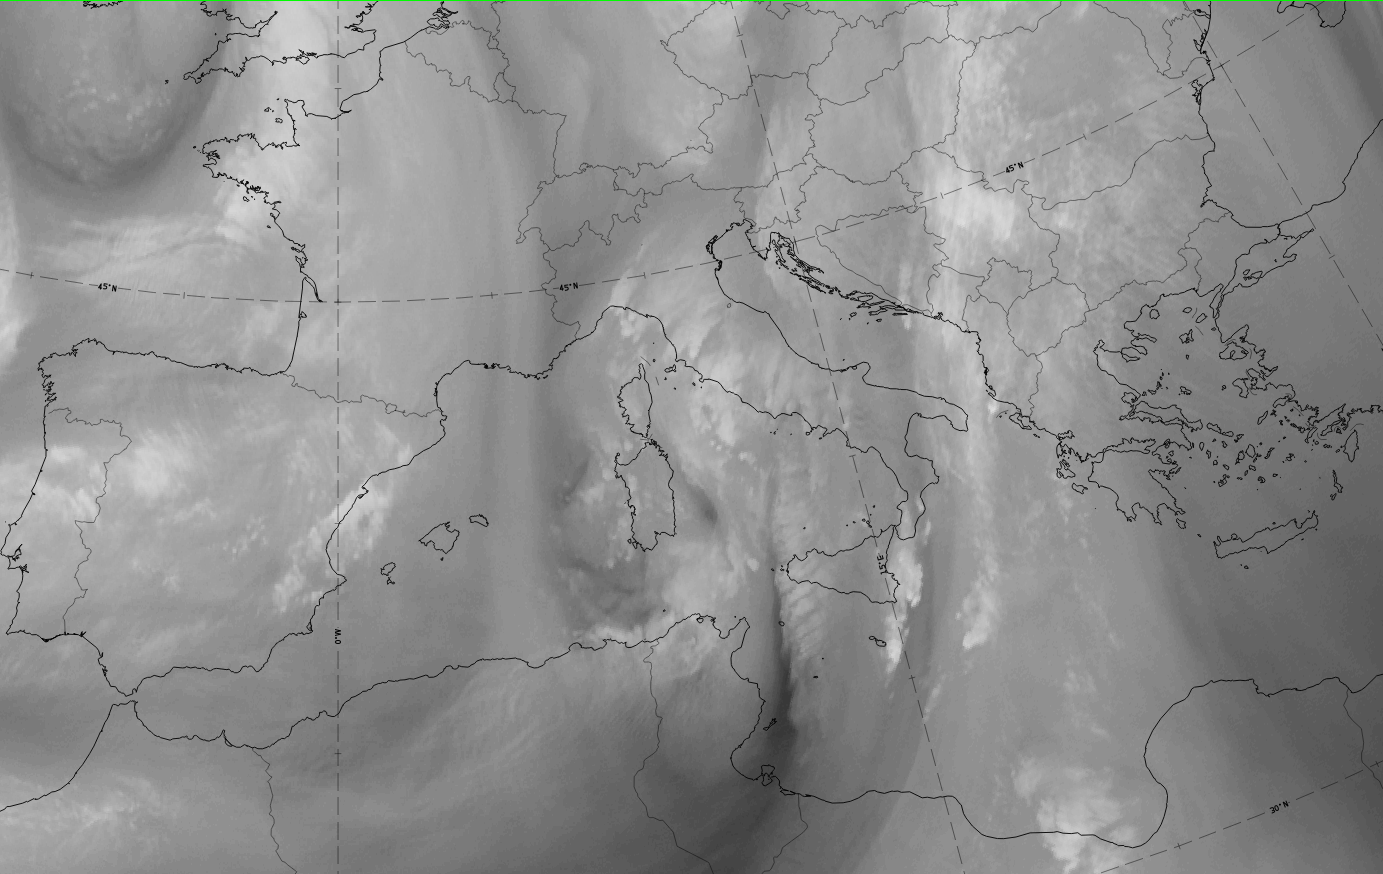
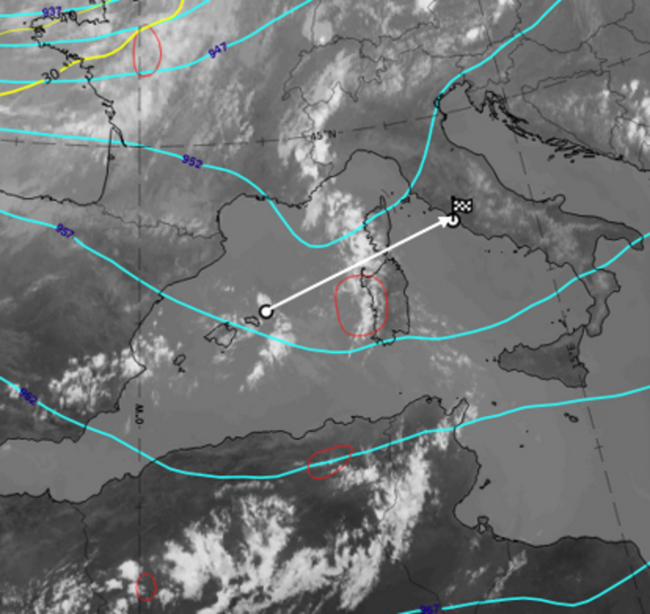
These weather systems occur from time to time over the Mediterranean, with intensive cold fronts, representing the polar front, and comma cloud spirals behind. An example of this is shown in the image below from 02 March 2020 at 12:00 UTC. The cold front cloudiness stretches from the Alps southward to northern Africa. The comma is close behind, extending from the Pyrenees to the Balearic Islands.

However, these situations occur relatively rarely. In many more cases mesoscale cloud spirals without any frontal cloud band in front of them can be observed in the Mediterranean area.
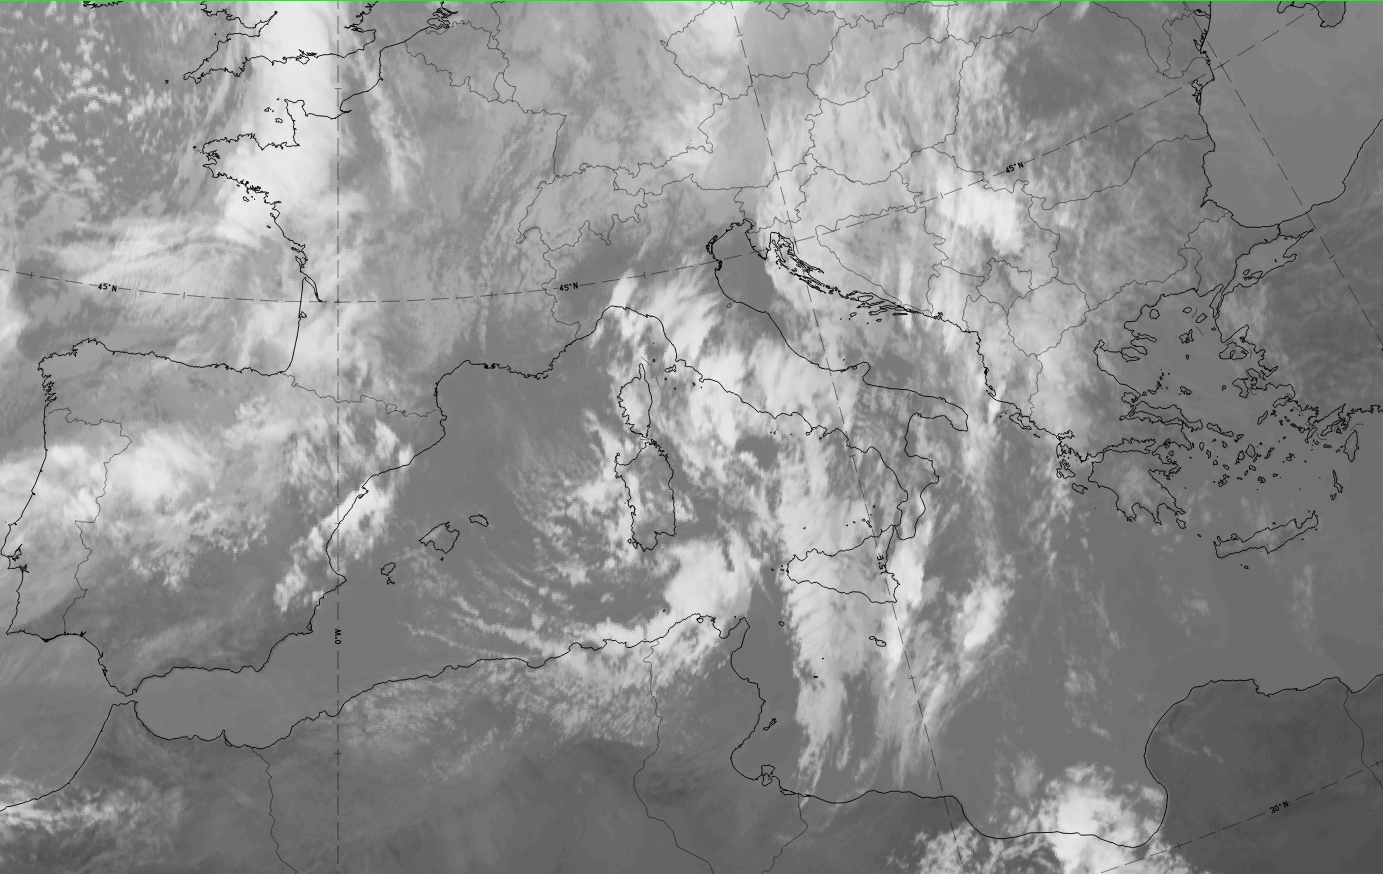
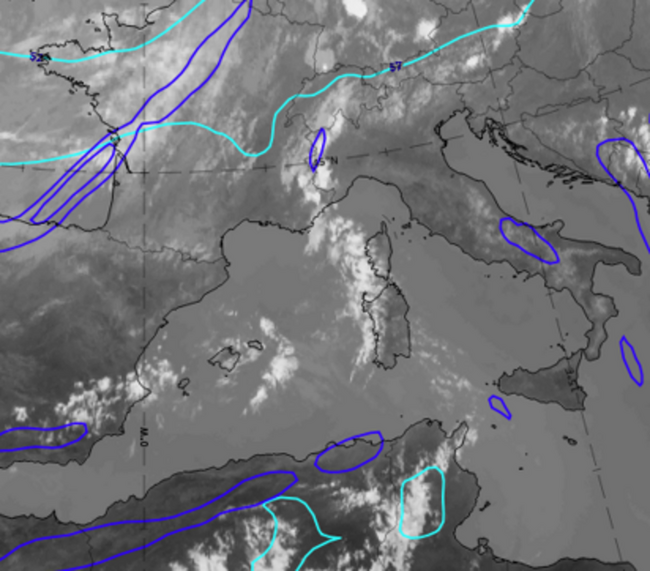
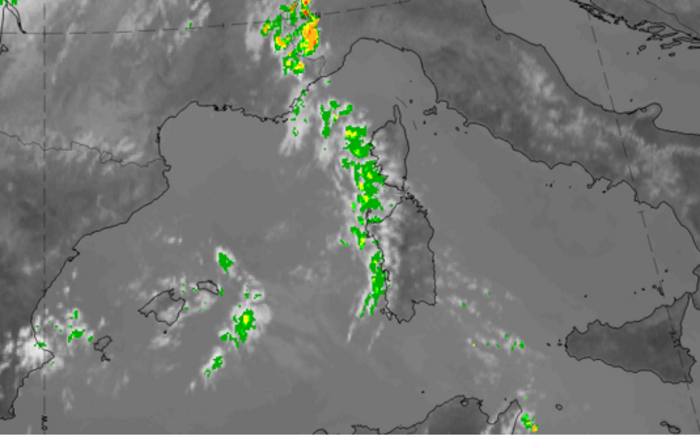
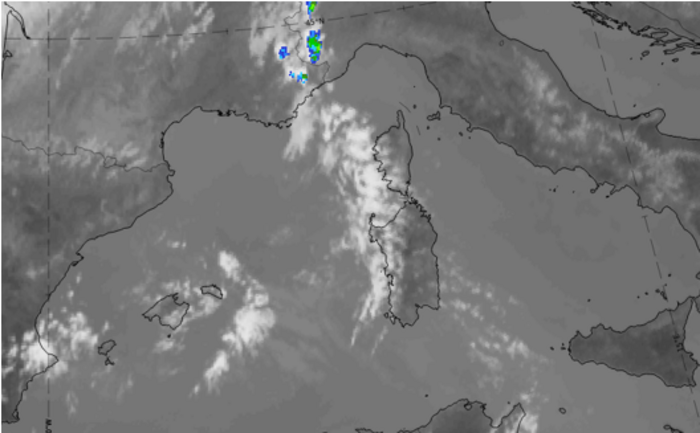
The case below from 14 November 2020 at 12:00 UTC shows two such spirals, one over Italy and Sardinia and one over western Turkey and the Aegean Sea.

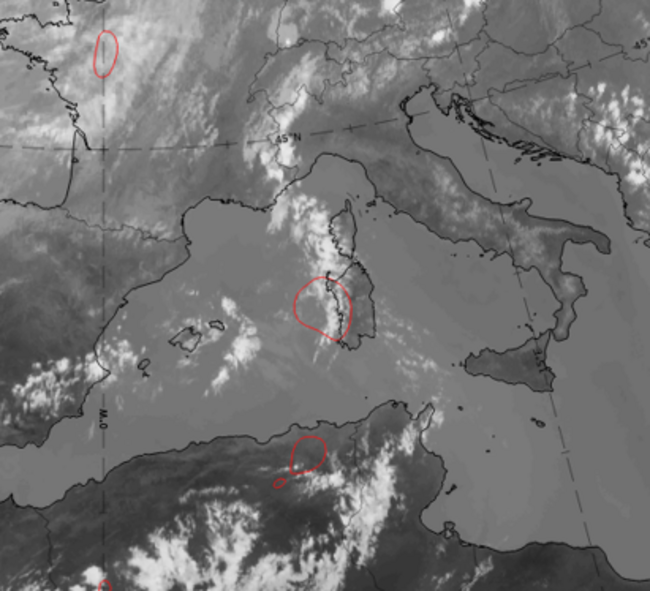
Even more cases show mesoscale cloud spirals with mostly weak spiral heads and rather thin clouds, as can be seen over northern Africa (Tunisia and Morocco) in the image below from 25 May 2020 at 12:00 UTC.

This special investigation seeks answers to two questions:
- Do the Mediterranean cloud spirals really correspond to the "Comma" Conceptual Model (CM)?
- A typical cloud configuration in satellite images is only then a representative of a special CM if a typical physical-theoretical background also exists and is the driving force for the development of the cloud configuration.
- Are the weaker comma cloud spirals a result of a different or even a new CM?
To answer these, all mesoscale cloud spirals observed in the Mediterranean in one year (2020) have been investigated using satellite images and model parameters.
The criteria for the selection of a cloud spiral being included in this study were:
- A spiral form, even if the spiral is weak.
- A size between approximately 200 and 600 km.
- The cloud spiral should not be accompanied by a substantial large-scale Thermal Front Parameter (TFP): this means that there should not be any large-scale frontal conditions.
For the year 2020, 145 mesoscale spirals similar to commas were detected and evaluated. During the investigation process this was somewhat reduced so that in the end 120 cases were under consideration.
Investigation of numerical parameters for the selected commas
In the first investigation step, the structure of the comma cloud feature in terms of the following basic numerical parameters is determined:
- the upper-level (300-hPa) height: the configuration and scale of the height contours is determined;
- the relative position of the classical polar front: to distinguish between comma spirals being cold or warm air phenomena.
- the low-level (950-hPa) height: configurations of height contours are evaluated in respect to a strong or weak low or a flat distribution close to the surface. This provides some information about the thickness of the detected weather system in connection with the comma cloud;
- all numerical parameters essential for the CM "comma": CVA, PV, omega (vertical speed in pressure coordinates) and humidity, on levels and in vertical cross sections.
In the second step, the following basic and derived numerical parameters are investigated:
Categorisation of comma clouds in terms of typical configurations of upper-level (300-hPa) height contours
In this first investigations step, the configuration of typical "weather systems" (typical configurations of height contours) in upper levels are investigated. The scales of the upper-level height systems are also categorised into synoptic, meso- and small scales.
| Comma type | Typical Upper-level height contour configuration | Number of cases in 2020 (out of 145) |
| 1 | Upper-level troughs behind fronts (classical situation) | 15 (10 %) |
| 2 | Synoptic-scale upper-level troughs | 32 (22%) |
| 3 | Cut off lows | 44 (30 %) |
| 4 | Small-scale upper-level troughs within a cutoff low | 6 (4 %) |
| 5 | Small-scale upper-level troughs within a zonal stream | 25 (17%) |
| 6 | Small-scale secondary cutoff lows within large-scale cut off lows | 11 (12%) |
| 7 | Split off from large-scale occlusion spirals (classical situations) | 6 (4%) |
| 8 | CAD (cold air development)-like | 2 (1%) |
| 9 | Instant-occlusion-like | 4 (2%) |
Nine different types of upper-level height configurations were identified, with very large variability in frequency of occurrence.
Examples of the most important types in the table above are provided below. Each IR image is superimposed by 300-hPa height contours.

This is an example of type 1:
The classical comma behind a cold front cloud band.

These two are examples of:
Type 3: a meso- to synoptic scale cutoff low over Turkey Type 5: a meso- to small scale upper-level trough over Corsica and Sardinia

This is an example of type 4: a small-scale upper-level trough within a large-scale cutoff low
Schematics of upper-level height contour configurations for the most important comma types are shown below.

Schematic of 6 comma types in terms of upper-level height configurations.
From the table above and the examples some of these comma types can be summarized as follows:
The types 1, 2, 3 and 7 represent the classical configurations of commas in synoptic scale upper-level environments, such as troughs behind cold fronts or cutoff lows.
A second group can be summarized as follows:
The types 4, 5 and 6 represent comma spirals in connection with small-scale upper-level features which are also mainly troughs or cut off lows but at distinctly smaller scales, embedded within the synoptic scales mentioned above.
The types 8 (CAD-like) and 9 (instant-occlusion-like) represent cases which are similar to typical developments in connection with commas, but as they represent a very small number of cases, they are not discussed further in this study.
Locations of commas in the Mediterranean relative to the classical polar front
Classical commas are cold air phenomena; they appear behind the polar front, in cold air. For the commas diagnosed in the Mediterranean the question is whether they develop in the cold air behind the polar front or in the warm air ahead of it, and how this relates to the upper-level height types analysed before.
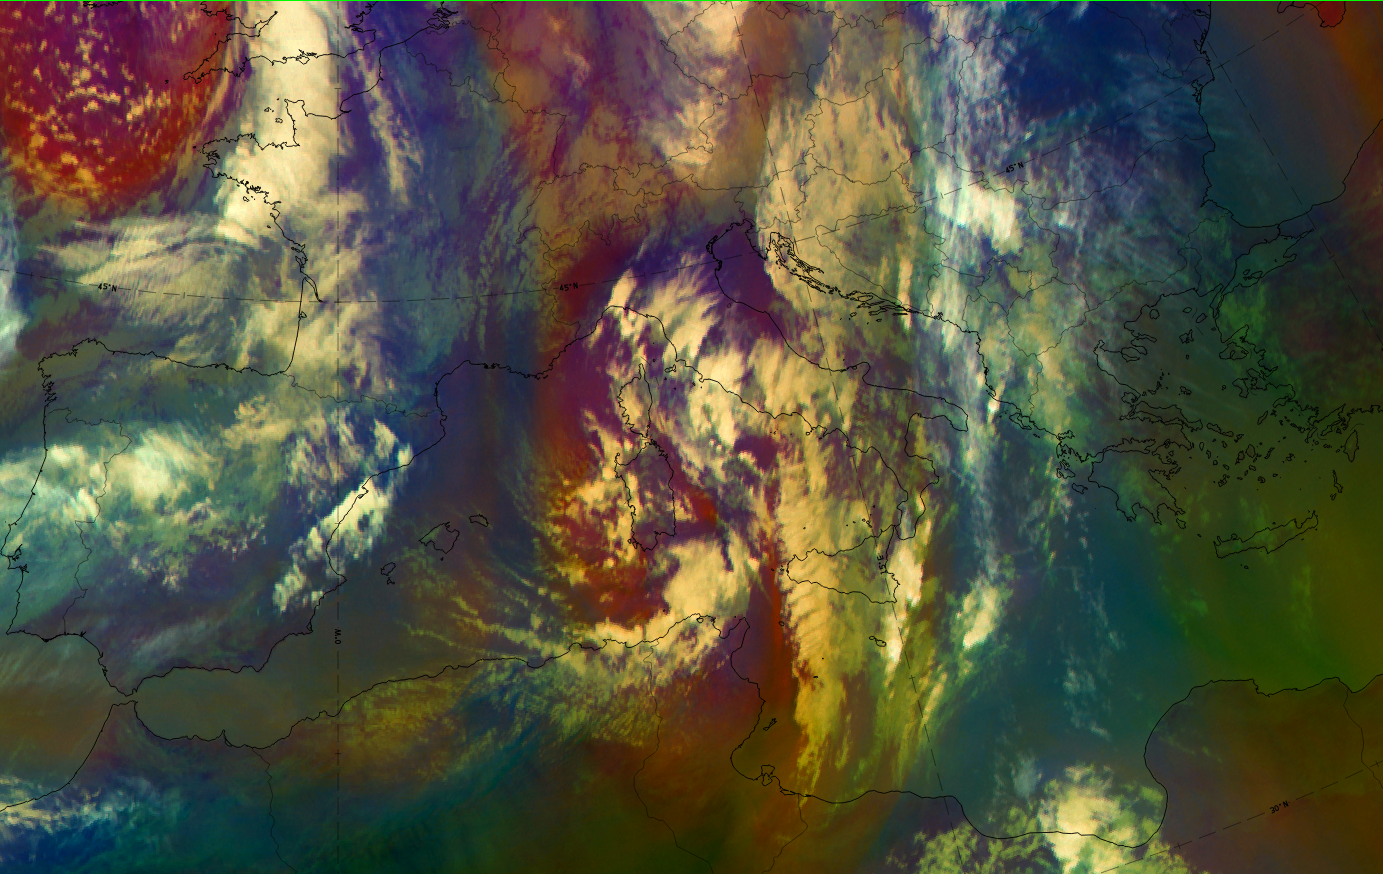
To identify the polar fronts, the main source used was the "Weerkaarten archif Europa" from KNMI. This was supported by using Air Mass RGBs, which were inspected in respect to the green, blue and brown colours representing warmer, colder and dry air, respectively.


The case from 02 March is described above as being an example of a classical comma situation, and this investigation step provides evidence to support this classification. A polar front accompanies the broad frontal cloud band in the western Mediterranean and the comma cloud behind it is, according to the Airmass RGB, in cold and very dry air.


Both commas occurring on 14 November, the western one over Corsica and Sardinia representing Type 5 and the eastern one over western Turkey and the Aegean Sea representing type 3, are located far ahead of the main polar front, which extends from the Atlantic to western Europe. They are therefore, according to the usual interpretation, in warm air. However, as can be seen from the previous part of the investigation, they are also in connection with a cutoff low and a trough in upper levels; these are either remnants of previous systems or small-scale developments (or both).


The small-scale comma over Tunisia and Algeria seen on 25 May, representing comma type 4, is far ahead of the polar front (which extends from the western Atlantic northward to Iceland) but nevertheless within a band of colder air represented by the blue colour in the Airmass RGB. As is shown before, the comma cloud is in front of a small-scale upper-level trough.
From these examples and all the other cases that were investigated, it can be concluded that the overwhelming majority of comma configurations in the Mediterranean are situated ahead of the main polar front. This means on the one hand that they are in warm air (compared to the cold air outbreaks behind the polar front) but on the other hand that there are indeed upper-level weather systems in the Mediterranean ahead of the polar front. Those weather systems are mainly reflected by lows and troughs in upper levels and can appear on different scales:
Synoptic-scale:
These are mostly upper-level troughs or cutoff lows from older systems which reach from the north into the Mediterranean;
Mesoscale:
Mostly cutoff lows located in the Mediterranean;
Small-scale:
Developing within larger scale weather systems reaching from the north into the Mediterranean or within a zonal stream of geopotential.
Up to here only the height configurations in upper levels and the location relative to the polar front have been investigated. The next investigation step focuses on comma configurations ahead of the main polar front.
Combination of results from the first investigation step with lower-level (900-hPa) height contour configurations and scales
In the next step, the height configurations very close to the surface are evaluated; this can be used along with the upper-level heights to define the thickness of the weather system. The systems are separated according to lower-level height into the categories "distinct lows", "weak lows" and "flat distribution".
Combining all the information gathered so far and concentrating on commas ahead of the main polar front, the number of Mediterranean comma categories can be reduced from the 9 types, based only on upper-level contour features, to 3 classes, based on upper and low-level contour features as well as distance ahead of the main polar front.
Class 1:
Represents commas ahead of the polar front but in relation to synoptic or meso-scale weather systems in a thick layer. This class contains mainly types 1, 2 and 3 and corresponds to 37 cases.
Class 2:
Represents commas ahead of the polar front but in relation to synoptic or meso-scale weather systems only in high levels. This class contains mainly types 2 and 3 and corresponds to 29 cases.
Class 3:
Represents commas ahead of the polar front in relation to small-scale weather systems only in high levels. This class contains mainly types 4, 5 and 6 and corresponds to 28 cases.
Summary of typical characteristics of the three main classes of commas in the Mediterranean
| Class 1 | Class 2 | Class 3 | ||||
| Relative location | In the warm air ahead of the main polar front | |||||
| Upper level |
|
|
|
|||
| Lower level |
|
|
|
|||
Typical weather events which can be expected for the classical comma situation and commas belonging to classes 1, 2 and 3
Commas of the classical type, behind the polar front in cold air, are usually very active meteorologically. There is upward motion, cyclonic vorticity advection and instability, leading to the possibility of heavy rain and thunderstorms. But is this also true for the Mediterranean commas treated in this investigation? And are there differences between the three classes 1, 2 and 3 that occur ahead of the polar front?
All cases were investigated using weather observations, the European radar system OPERA and the Nowcasting SAF products Precipitating Clouds (PC) and Convective Rainfall Rate (CRR). However, these materials were not available for all cases for two reasons: firstly, commas on meso- and small scales can have cloud configurations located entirely over ocean areas where no synoptic stations are available and secondly, OPERA does not exist in the more eastern and the southern parts of the Mediterranean. Nowcasting SAF parameters do not have these geographic restrictions but are of course of lower quality. Further has to be taken into account that types or classes of the Mediterranean commas cannot be compared easily if they occur in different seasons.
Having taken these restrictions into account, the commas presented here and below are reliable representative examples.
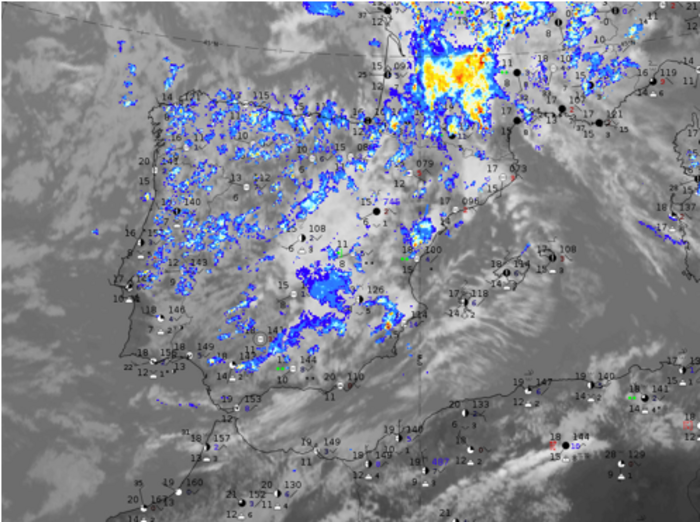
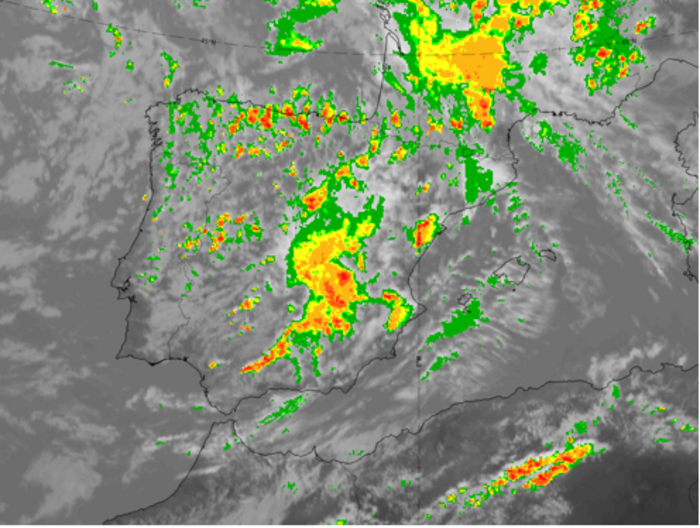
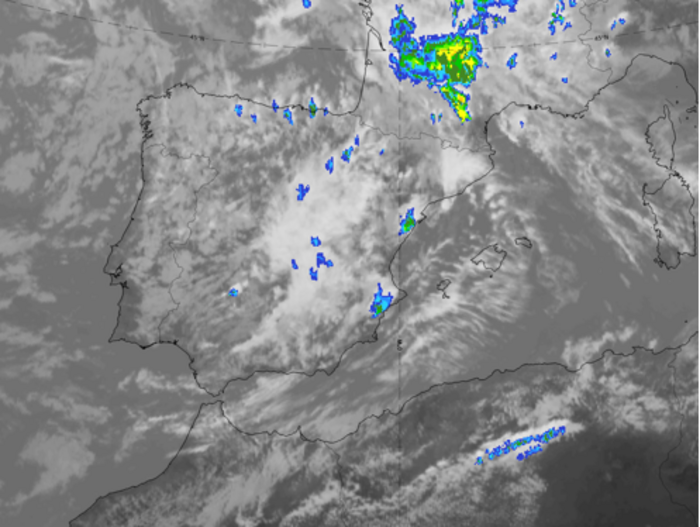
In this subchapter the typical weather situation for the type 1 commas, those in a classical environment behind a polar front, is first demonstrated. A case from 18 September 2020 at 12 UTC was chosen because in the case of 02 March 2020 at 12 UTC, studied the first chapter, the comma is located exactly over the Gulf of Lyon where no weather measurements are available.


18 September 2020, 12 UTC; type 1 classical comma environment behind a polar front
u.l.: IR + synoptic reports; u.r.: IR + synoptic reports + radar from OPERA; l.l.: IR + PC (precipitating clouds) + CRR (convective rainfall rate)
The cold front clouds are to the east of Spain and the comma behind lies directly over Spain (there are two commas but we concentrate here on the eastern one).
Cb (cumulonimbus) and shower reports can be seen from available stations and the radar, PC and CRR values are all very high. Therefore, this example reflects the expected high meteorological activity characteristic of a classical comma.
Investigations of complete Set of key parameter sets for the representatives of the three classes
Individual case studies from each of the three classes were investigated, looking at all the key parameters described in the Conceptual Model "Comma", including height contours, vorticity advection and PV, both on horizontal surfaces and in vertical cross sections.
A case from class 1
Class 1 represents commas ahead of the polar front but in relation to synoptic or meso-scale weather systems in a thick layer. It contains mainly types 1, 2 and 3; 37 cases were found in the investigation for 2020 described above.
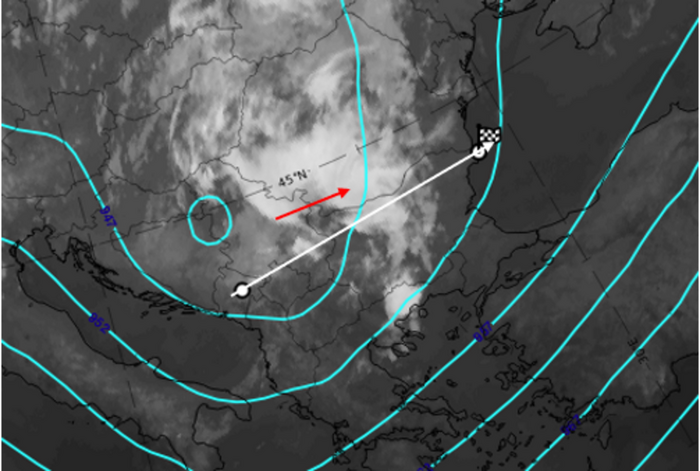
The case for class 1 case shown here is from 27 April 2020 at 15 UTC and represents type 3 – a comma within a synoptic scale upper-level trough.
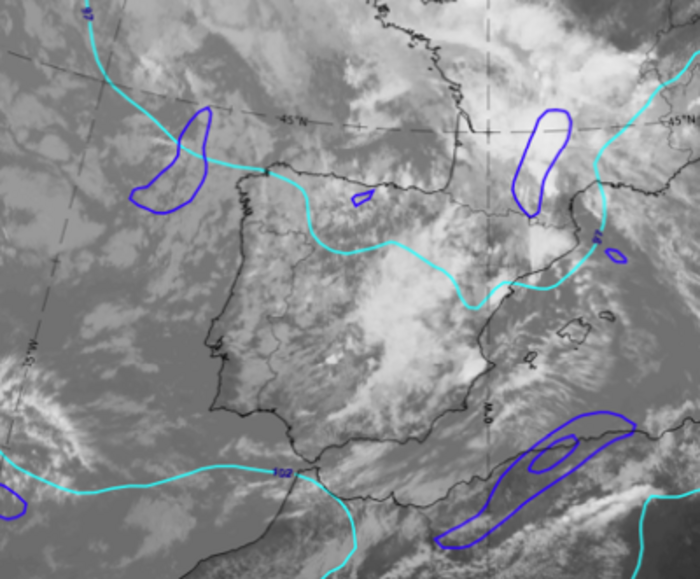
27 April 2020/ 15 UTC; type 2 comma
u.l.: 300-hpa height contours and VCS (vertical cross section) line; u.r.: TFP (thermal front parameter); l.l.: Contours of CVA (cyclonic vorticity advection) 300-hPa; l.r.: Contours of height at which PV = 2 units

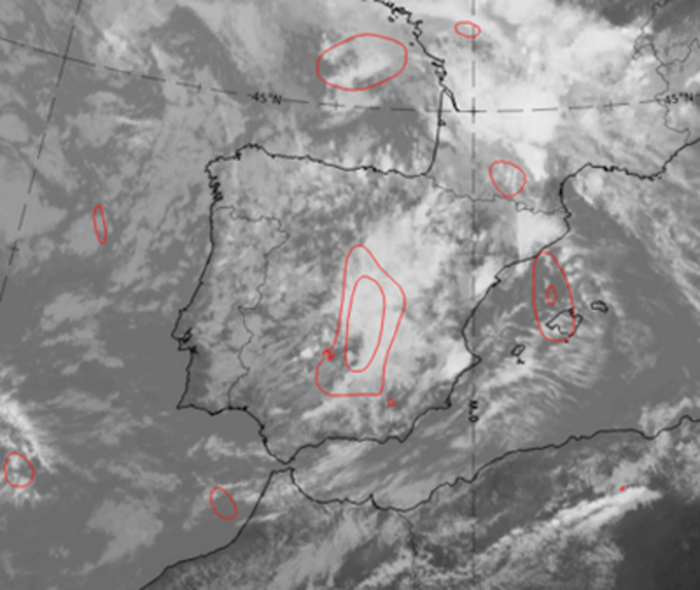
27 April 2020, 18 UTC;
Fronts, trough lines, convection lines, High and Low centres;
The red line at the east coast of Spain indicates a convection line connected to the comma.
The main polar front is located far to the west over the Atlantic


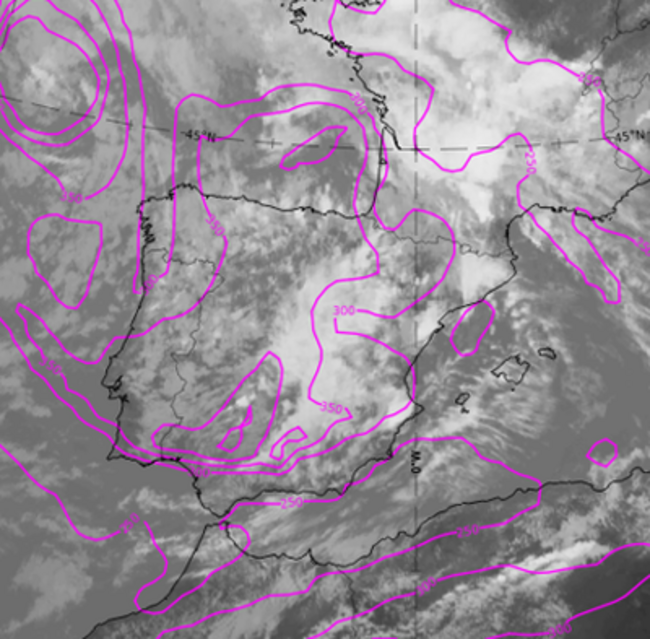
27 April 2020, 15 UTC: horizontal cross-sections
u.l.: isentropes and PV > 1 unit; u. r: isentropes and vorticity advection: anticyclones in blue and cyclones in red l.l: omega: upward motion in res and downward motion in blue.
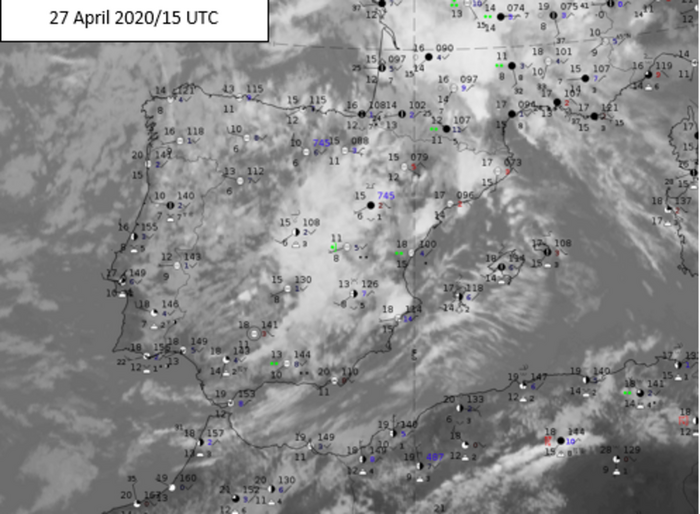
27 April 2020, 15 UTC; class 1 comma
u.l.: IR + synoptic reports; u.r.: IR + synoptic reports + radar from OPERA; l.l.: IR + PC (precipitating clouds) + CRR (convective rainfall rate)
The weather situation in this case is representative of the class 1 cases: these commas are generally meteorologically active and, in many cases, Cbs, showers, thunderstorms and rain of varying intensity are contained in the comma cloud.
The case from 27 April 2020 at 15 UTC shows a very distinct and meteorologically active comma spiral over Spain, which appears at the leading side of a synoptic scale trough and a very weak low-level trough. According to the TFP it does not have the character and dimensions of a frontal system. It is connected to a distinct maximum in CVA of and shows a PV anomaly at its rear side. This is reflected very clearly in the vertical cross sections, with a large downward-inclined zone of strong isentrope gradients. This "crowding zone" can be detected from about 350 hPa down to 800 hPa. The maximum in cyclonic vorticity at high levels is very strong and in front of an emerging PV anomaly. At middle and high levels, the omega field indicates upward motion.
From investigating all cases of this class, the schematic below summarizes the most important qualities, it can be concluded that for the class 1 the comma cloud spiral is mostly very distinct and develops behind a frontal system or within upper-level troughs or cutoff lows. Those fronts and weather systems do not represent the actual polar front but rather old systems. They are connected to a downward-inclined crowding zone of isentropes, which starts below the tropopause and reaches into middle and even low levels. If a class 1 comma develops behind a cold front cloud band, two downward-inclined zones can also be observed in the vertical cross section, belonging to the front and to the comma. In most cases there is a PV anomaly below the crowding zone, and maxima in CVA, upward motion and humidity do occur.

A case from class 2
Class 2 represents commas ahead of the polar front but in relation to synoptic or mesoscale weather systems only in high levels. This class contains mainly types 2 and 3; 29 cases were found in the investigation for 2020.
The class 2 case shown here is from 25 July 2020 at 21 UTC and is situated in a mesoscale cutoff low.
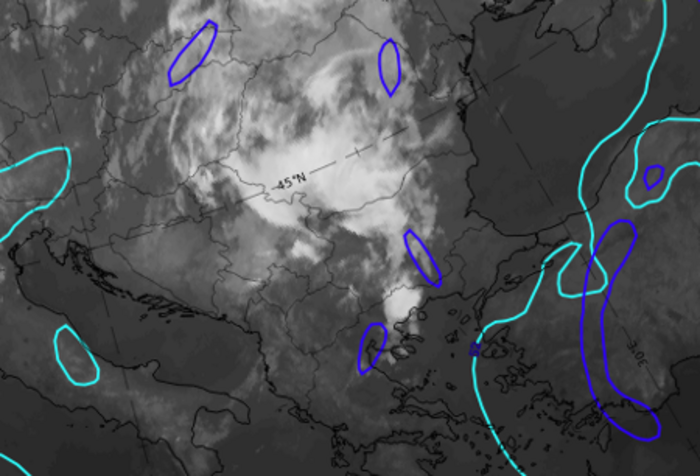
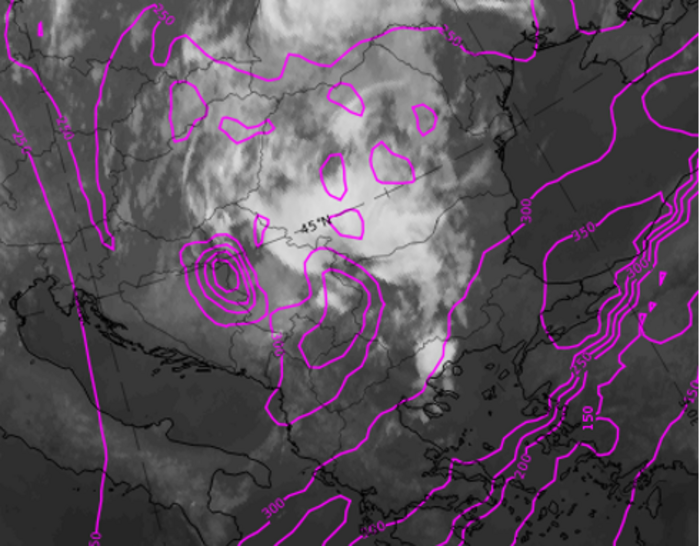
25 July 2020, 21 UTC; type 3
u.l.: 300-hPa height contours and VCS line; u.r.: TFP and 950-hPa height; l.l.: height contours of CVA 300-hPa; l.r.: contours of height at which PV = 2 units
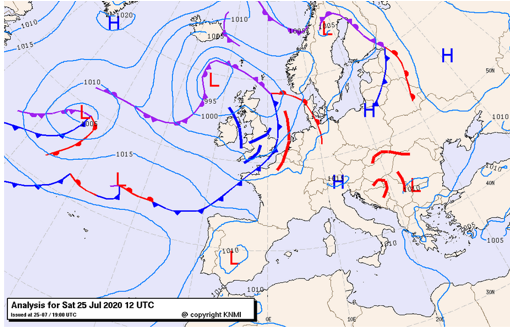
25 July 2020, 18 UTC;
Fronts, trough lines, convection lines, High and Low centres;
The red curved line over the Balkan Peninsula indicates a convection line connected to the comma.
The main polar front is located from the Atlantic northeastward to western and northern Europe


25 July 2020, 21 UTC: Horizontal cross sections, type 3
left: isentropes and PV > 1 unit; right: isentropes and vorticity advection: anticyclonic in blue and cyclonic in red
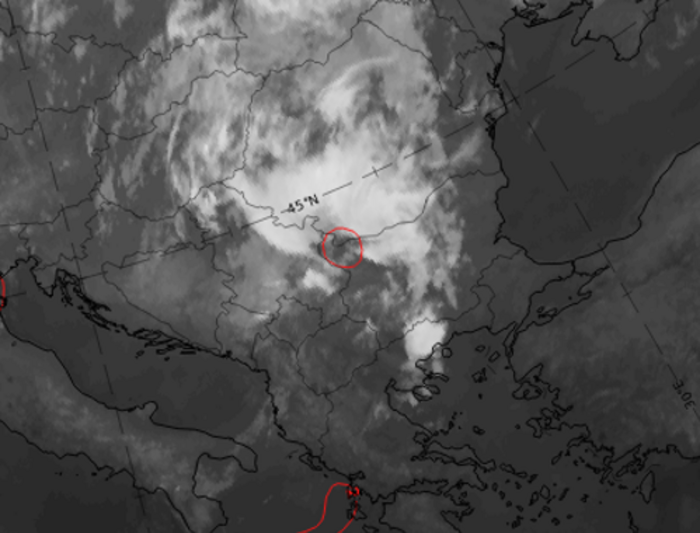
25 July 2020, 21 UTC; class 2
u.l.: IR + synoptic reports; u.r.: IR + synoptic reports + radar from OPERA; l.l.: IR + PC (precipitating clouds) + CRR (convective rainfall rate)
This class 2 case also includes very active weather events. In nearly all cases investigated of this class, there were showers, Cbs and sometimes also thunderstorms reported.
Based on the cases shown here for classes 1 and 2, then, no clear difference in weather activity can be seen compared with a classical comma. In particular, it cannot be definitely stated that class 1 or class 2 commas are less meteorologically active.
The case from 25 July 2020 at 21 UTC shows an intensive comma spiral over the Balkan Peninsula which is very active. It is on the leading side of what is a deep upper-level trough or already a cutoff low. However, there are no continuous frontal features, as can be seen from the TFP, and the geopotential lines close to the surface have a very flat distribution. This is typical for a comma belonging to the class 2. At 300 hPa there is only a weak maximum in cyclonic vorticity advection but a distinct PV anomaly behind the comma cloud. In the vertical cross sections, the most striking feature is instability reaching very high levels. Above this unstable column there is a downward-inclined zone of isentropes between about 300 and 550 hPa, which is also accompanied by a PV anomaly below the inclined isolines and a maximum of CVA which is much stronger, as could be seen on the 300 hPa level alone. This comma configuration is therefore accompanied by most of the important key parameters features of a comma in the highest zone of the troposphere.
A schematic summary of the qualities of key parameters for the "class 2" is shown below.


As in class 1, in class 2 the comma configurations are distinct and appear in connection with upper-level troughs or cutoff lows at synoptic- or mesoscales; but in contrast to class 1, there is only a flat distribution of height contours at low levels, meaning that it is only an upper-level system.
There are two sub-groups of environments which can best be seen in the vertical cross sections: one sub-group is accompanied by a rather thin downward-inclined crowding zone from below the tropopause reaching into mid-levels; another subgroup has a very low tropopause and the downward-inclined crowding zone only occurs in a shallow layer. Examples of these two subgroups can be seen in a chapter after the end of this investigation, which contains a selection of more cases. (under construction)
A case from class 3
Class 3 represents commas ahead of the polar front in relation to small-scale weather systems only at high levels. This class contains mainly types 4, 5 and 6; 28 cases were identified for 2020.
The examples of this class are the most interesting as they are accompanied by weak comma spirals and therefore it can be called into question whether they belong to the CM "comma".
In this investigation a case from 27 June has been chosen as an example of class 3.
27 June 2020/ 12 UTC; type 5
u.l.: 300-hPa height contours and VCS line; u.r.:TFP and 950-hPa height;; l.l.: CVA units 300 hPa; l.r.: contours of height at which PV = 2 units

27 June 2020, 12 UTC;
Fronts, trough lines, convection lines, High and Low centres;
The main polar front is located over the Atlantic extending to western Europe.


27 June 2020, 12 UTC; type 5
left: isentropes and PV > 1 unit, right: isentropes and vorticity advection: anticyclones in blue and cyclonesin red
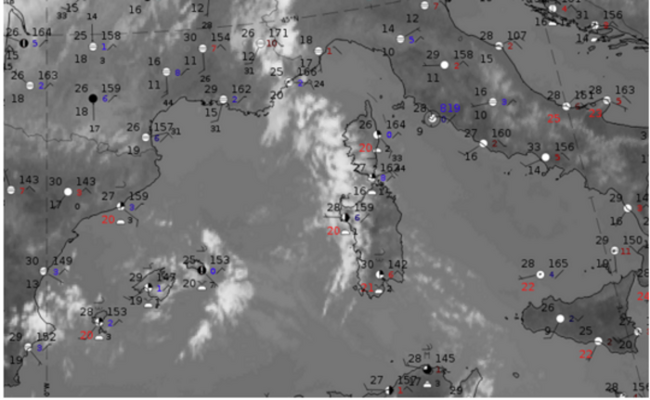
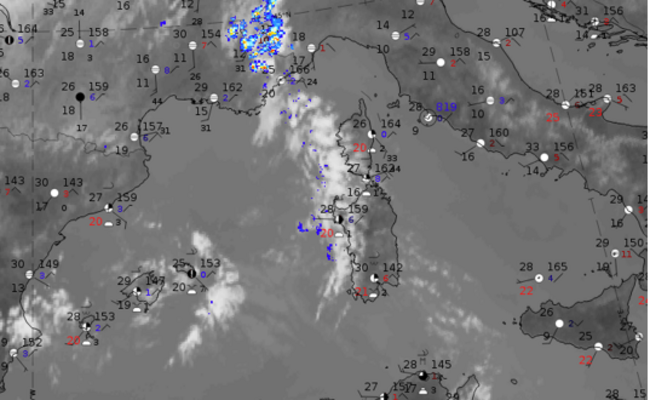
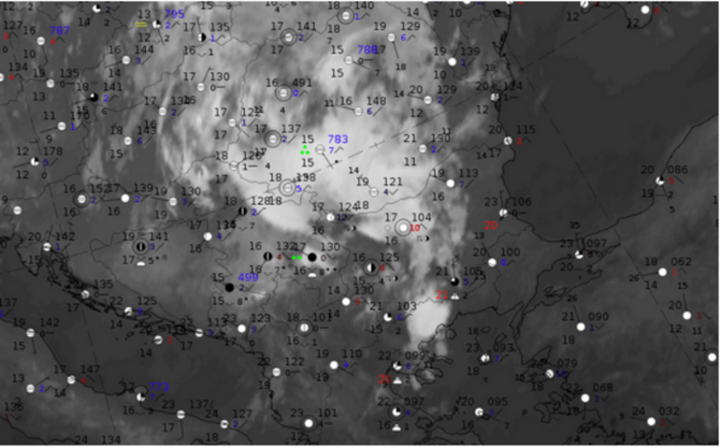
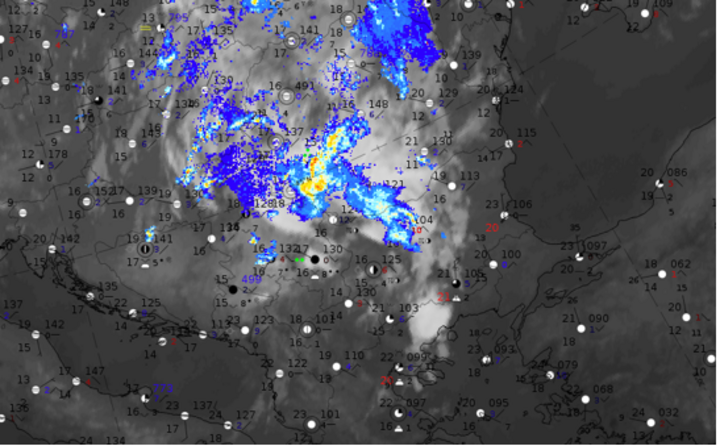
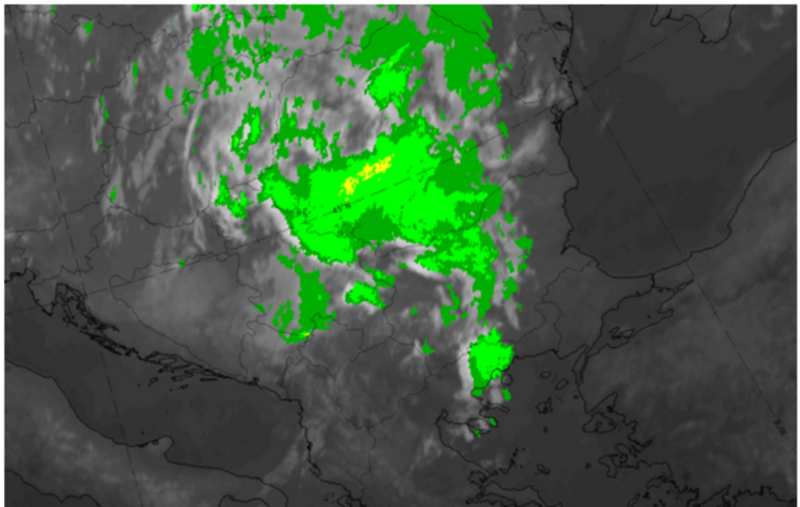
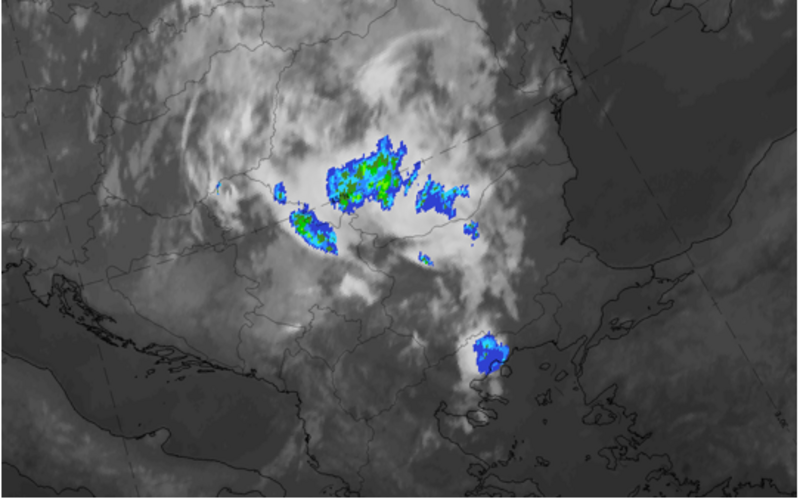
27 June 2020, 12 UTC; class 3
u.l.: IR + synoptic reports; u.r.: IR + synoptic reports + radar from OPERA; l.l.: IR + PC (precipitating clouds) + CRR (convective rainfall rate)
Class 3 commas differ distinctly from those of classes 1 and 2 as they contain (including for the case detailed here) cumulus cloud, very often superimposed with high cloud. Mostly no rain or rain showers are reported, however, there is some probability of rain and one or two light rain reports can be seen in some cases of this class.
The case from 27 June 2020 at 12 UTC is typical of comma cloud spirals that are rather small-scale and involve of less intensive cloud and weather events. Nevertheless, they occur in front of a small-scale upper-level trough, which is reflected in cyclonic vorticity advection and a weak PV anomaly. This can be seen much more clearly in the vertical cross sections.with a small scale downward inclined zone between 300 and 400-hPa as well as a PV anomaly, with the PV=2 line bending downward below the tropopause; there is also a weak maximum of cyclonic vorticity advection larger than 2 units in this layer.
Summarising these key parameter features, it can be concluded that this example of a class 3 comma does follow the behaviour of the most important key parameters for the CM "Comma" and can therefore be classified as such.
A schematic summary of the key parameters for class 3 is shown below.

The main difference compared to classes 1 and 2 is the small scale of the upper-level height configuration: in the vertical cross section the downward-inclined zone of isentropes connected to a PV anomaly is immediately below the tropopause and rather thin. The PV anomaly is also right below the tropopause but the strengths of the CVA maxima at those heights connected to the cloud spiral of the comma can vary in intensity; usually they are stronger for small-scale upper-level cutoff systems than for small-scale upper-level troughs.
Summary
- In the Mediterranean classical comma configurations occur within the cold air behind the polar front. However, they form the minority of comma configurations, with only 10% of all comma events (in an investigation over the Mediterranean for the year 2020) in this category.
- Therefore about 90 % of Mediterranean mesoscale cloud spirals occur within a warm airmass ahead of or far away from the classical polar front.
- All these commas are related to low-pressure systems at high levels but on very different scales and configurations; they can be divided in 6 types.
- These upper-level height systems are either the remnants of older weather systems or develop directly within upper-level troughs, cutoff lows or the zonal stream ahead of the main polar front.
- Based on the height configurations at low levels the commas can be divided into three classes according to scale and thickness of the system:
- Class 1 are distinct and large commas in synoptic- to mesoscale environments in upper and lower levels;
- Class 2 are also in a synoptic- or (more often) in mesoscale upper-level environments; the height contours follow a flat distribution in low levels;
- Class 3 are small-scale commas consisting of weak clouds in synoptic-scale environments only in upper levels, while the low levels are flat.
- Evaluating the typical key numerical parameters of the Conceptual Model "Comma" shows that the Mediterranean commas have corresponding for at least the most important dynamic parameters and therefore belong to this conceptual model.
- The group of small and less meteorologically active comma configurations (class 3), for which there was the largest doubt as to whether they are indeed "Comma"s, show typical "Comma" configurations of the key parameters CVA and PV only in high levels close to the tropopause.
- A deeper investigation of the weather features within the comma configuration shows (apart from differences in weather based on commas in different seasons, localities and times of day) that class 1 and 2 commas can be accompanied by intense weather events including thunderstorms and heavy rain, making them similar to active classical commas. Class 3, however, is different in that it is associated mostly with cumulus cloud accompanied by high cloud above, and no intense weather events would be expected to occur, although for these cases the occurrence of isolated rain events cannot be excluded.
If you are interested in more cases for you own investigation, please click on the button below: