Table of Contents
The MSG channels
MSG uses its SEVIRI instrument to measure electromagnetic radiation on 12 channels, which are summarised in table 1 and later, with some additional content, in table 2. The graphics in figures 1 and 2 show the various channels' basic properties regarding the measurement of radiation from the Earth and the Sun, as well as of the most important absorbing gases in the troposphere. More information about these topics can be found in the Basics chapter "References to General Literature about Satellite Meteorology".
In SatManu "Central wave length" is used as a channel name. Nevertheless, channel numbers are widely used - especially in technical literature - so that both "channel number" and "central wave length" are used in this introductory chapter.
Table 1: MSG channels, Abbreviations: VIS: visible, IR: infrared, NIR: near-IR; WV: Water vapor.
| Channel number | Central wave length | Additional characterization |
|---|---|---|
| 01 | 0,6 µm | VIS: window |
| 02 | 0,8 µm | VIS: window |
| 03 | 1,6 µm | NIR: window |
| 04 | 3,9 µm | IR |
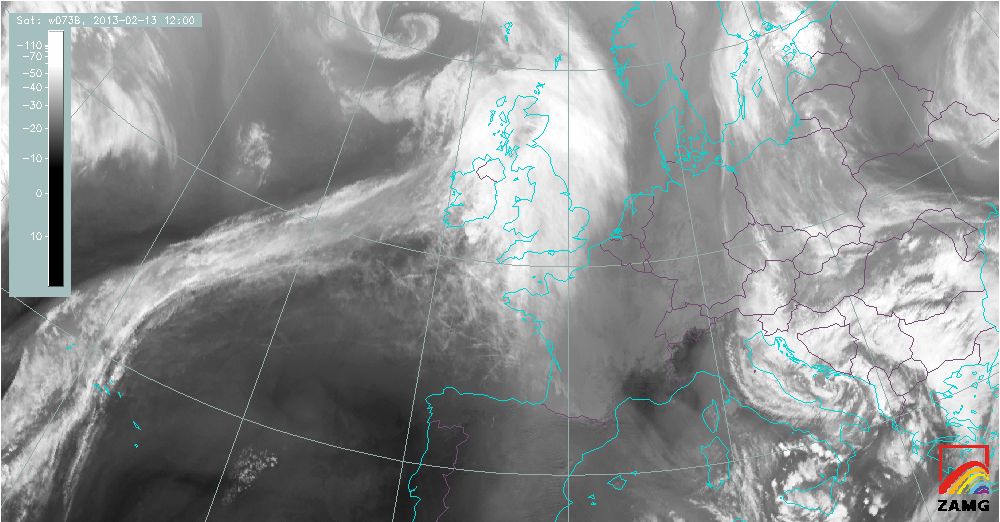
| 05 | 6,2 µm | WV Absorption band |
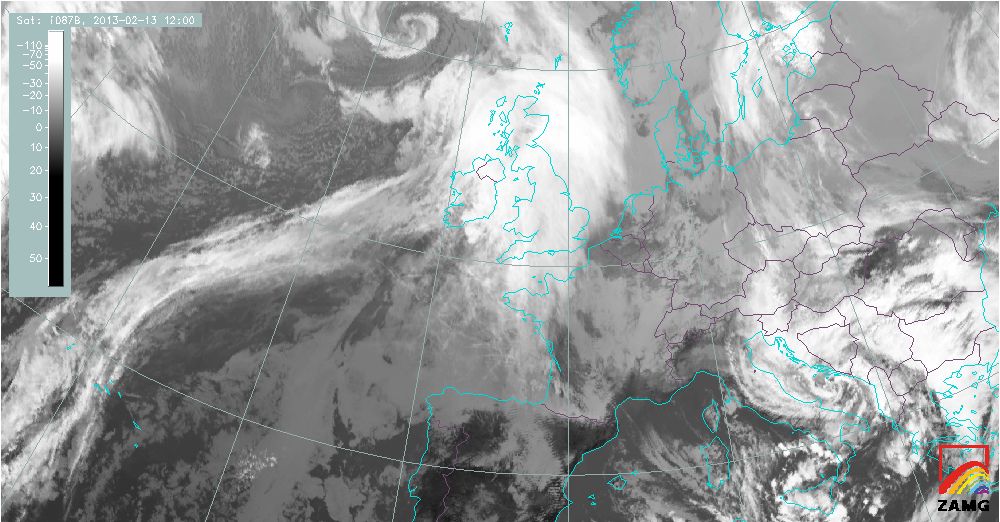
| 06 | 7,3 µm | WV Absorption band |
| 07 | 8,7 µm | IR |
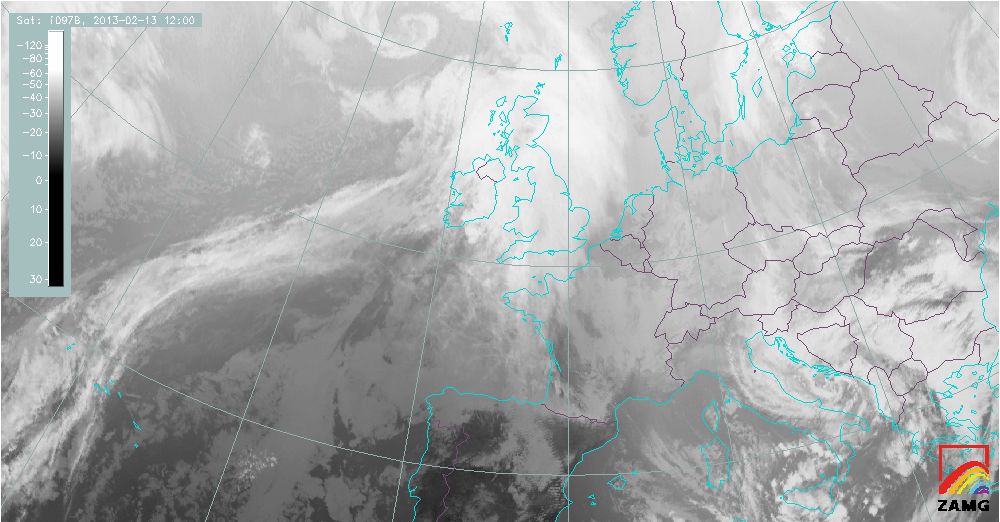
| 08 | 9,7 µm | Ozone Absorption band |
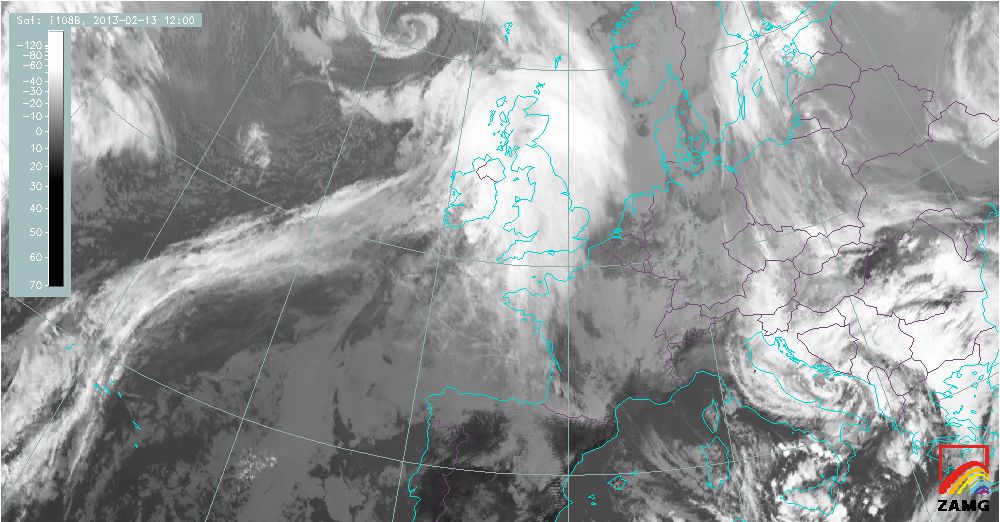
| 09 | 10,8 µm | IR |
| 10 | 12 µm | IR |
| 11 | 13,4 µm | CO2 Absorption band |
| 12 | Broad band: 0,3 - 1 µm | High resolution visible |
Measuring radiation with different channels
Figure 1: The Sun and Earth's emittance on the MSG channels
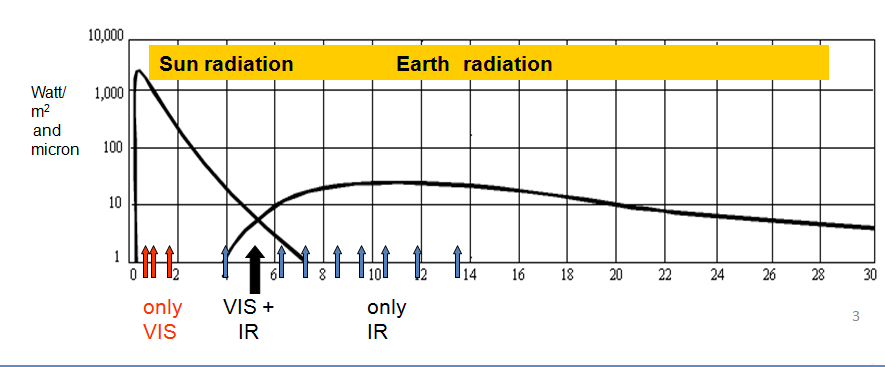
The main radiation source for wavelengths 0,4-5 µm is the Sun; the VIS and NIR channels measure radiation reflected from clouds or the Earth. For wavelengths between 5 and 15 µm, the main radiation source is the Earth. In this range the satellite measures thermal radiation emitted by the Earth, clouds and gases, following the Planck Law. The IR channels 05 - 11 operate in this range. Between the visual and infrared ranges there is channel 4, which measures both the reflected sunlight and the emitted thermal radiation in daytime.
Figure 2: The MSG channels and three of the most important absorption gases and their absorption bands: ozone, carbon dioxide
and water vapor
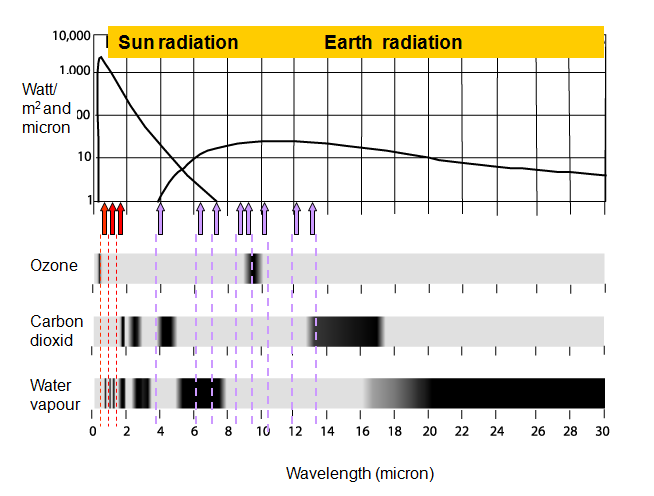
The MSG channels can be divided into two groups on the basis of this figure: the window and absorption channels.
The Window Channels
The absorption by atmospheric gases is negligible in window channels. The most important products of window channel measurements are the visual and infrared images.
- Window channels in the visible wavelengths
In the visible and near infrared range the window wavelenghts lie between 0,4 µm and 1,6 µm. The two VIS channels 01 - 02 and the NIR channel 03 fall in this range. The satellite measures the sunlight reflected off the ground or cloud tops in these channels. This means that the information contained in the grey shades of these channels' images is a measure of the reflectance, the albedo. These three channels have been chosen within this window because they have different sensitivities delivering different information to the user - this is described in more detail below. It has to be noted that there are also small WV absorption bands in this range which might lead to slightly erroneous results in interpretation. - Window channels in the infrared wavelengths
The most prominent infrared window lies between 10 and 12 µm. The IR channels 09 and 10 are within this range. There is also a second window around 9 µm, in which channel 07 falls. This is the area of the IR channels 09 and 10. Within the IR Window the satellite measures thermal radiation emitted by the surface or clouds. The measurement gives the temperature of the emitting object according to the Planck Law, the Wien's Law and the Kirchhoff Law. This means that the information contained in the grey shades of these channels' images gives the temperature of the surface or clouds. As described in more detail below, there are two channels in this range, because the sensitivity is different for different channels, and they provide different information.
The Absorption Channels
In absorption band wavelenghts the radiation emmited by the surface and clouds isattenuated by tropospheric gases. The gases absorb the radiation from below partly or wholly, and emit further they own radiation as per Kirchhoff's second law. Consequently, the grey shades of the images provide information about the temperature at the level of the absorbing gas, as well as the concentration of this gas there.
The most prominent products of absorption channel measurements are the vertical profiles of temperature and humidity as well as gas concentration charts. However, for some absorbing gases, such as water vapor, also the grey-shade image itself is also significant.
- Channels in the water vapour absorption band
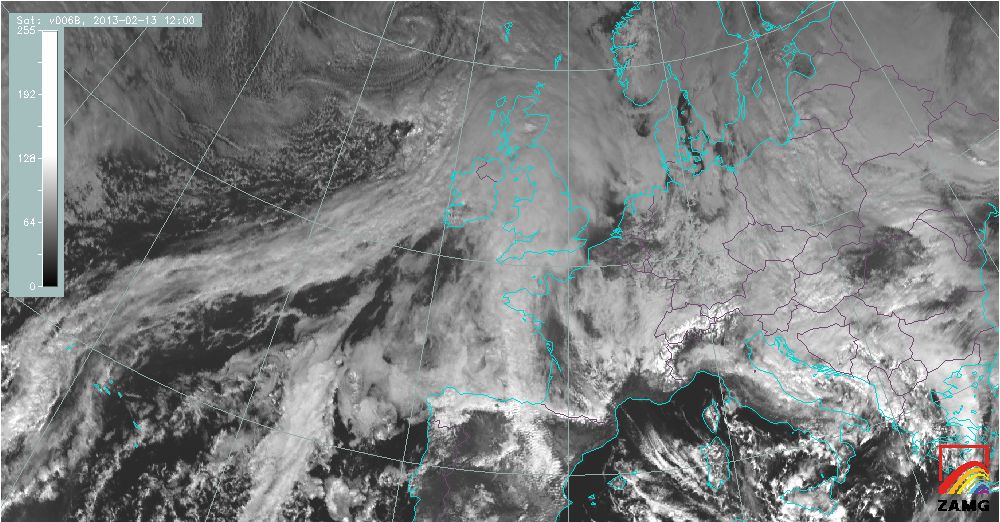
The WV absorption band is around 6 - 7 µm. The channels 05 and 06 fall in this range. The radiation in these channels represents the temperature and amount of water vapour in the middle and upper troposphere. The radiation measured in these wavelenghts comes from tropospheric layers, rather than from single levels, as in VIS and IR ranges. The higher up there is moist air, the lower the temperature of the layer is, and the lighter the gray shades of the image are.
The two channels 05 and 06 differ in the height ranges from which they receive the radiation:- Ch05 is close to the centre of the water vapour absorption band. Therefore, in this channel, the water vapour is absorbed more easily than in Ch06, and the satellite receives radiation only from the high layers; the sensitivity is at maximum around 350 hPa.
- Ch06 is near the edge of the the absorption band, and water vapour is absorbed less easily than in Ch05. Consequently, radiation also reaches the satellite from the middle layers; the sensitivity is at maximum around 500 hPa.
- Channel 08 in the ozone absorption band
Channel 08 is located in the center of the ozone absorption band; besides radiation originating from the lower levels, which is not so significant, these wavelenghts are sensitive also for radiation originating from stratosphere, where the ozone affects it. Consequently, the gray shades of a channel 08 image relieve information not only about the temperature, but also about the ozone content. However, as described later, subjective evaluation of ozone features in these images is very difficult, so this channel is used mostly for quantitative applications of ozone concentration. - Channel 11 in the CO2 absorption band
The absorption band around 15 µm has been in use since the time of launching the first polar-orbiting satellites for the derivation of temperature profiles. Channel 11 (13,4 µm) lies on the edge of the CO2 absorption band and is most sensitive for radiation from the layer between 900 and 800 hPa. Also this channel is not as important for image interpretation as it is for the quantitative applications.
The Mixed Channel
Channel 04 (3,9 µm) does not fit in the straightforward classification of "window" and "absorption" channels. It is
technically a window channel, but as it is very close to the CO2 absorption band, the CO2 concentration has an influence on the measured
temperatures. Basically, high CO2 concentration results in cooler temperatures, but it depends on the prevailing conditions. A more detailed
explanation of this can be found in literature.
The importance of the Mixed Channel channel is the fact that both the reflected sunlight and the emitted thermal radiation from the Earth and
clouds are combined in this channel in daytime. This leads to numerous applications, which are summarized in the following table.
Table of channels, their applications and image examples
Table 2: channel number, central wavelenght, characteristics and typical applications, Abbreviations: VIS: visible, IR: infrared, NIR: near IR, MIR: middle IR, WV: Water Vapour
The fourth column of the table lists the RGB (Red-Green-Blue) combinations of different channels in which the respective channels are used. The RGB's are discussed in detail in the next chapter.
| Channel number | Central wave length | Additional characterization | Typical application areas |
|---|---|---|---|
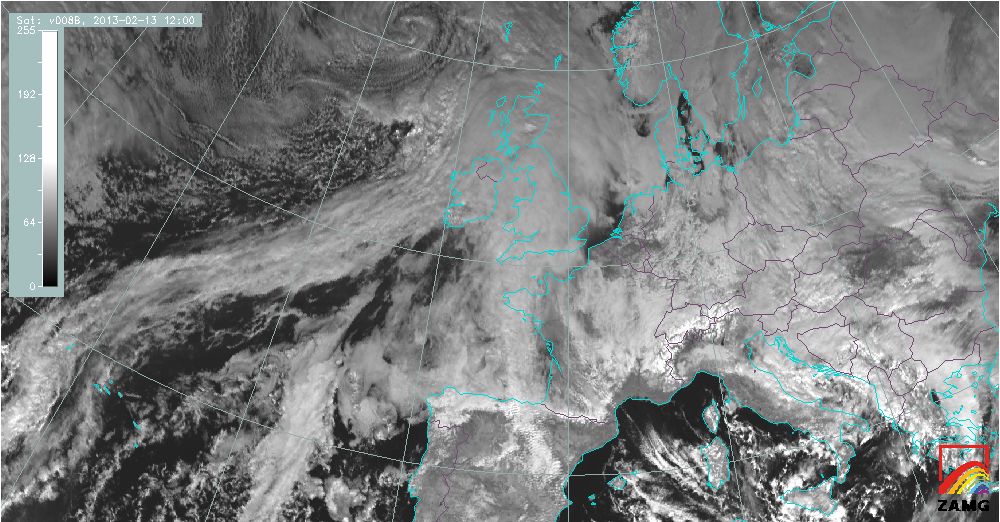
| 01 | 0,6 µm | VIS: window
Gray shades represent: different values of albedo |
|
| Channel number | Central wave length | Additional characterization | Typical application areas |
|---|---|---|---|
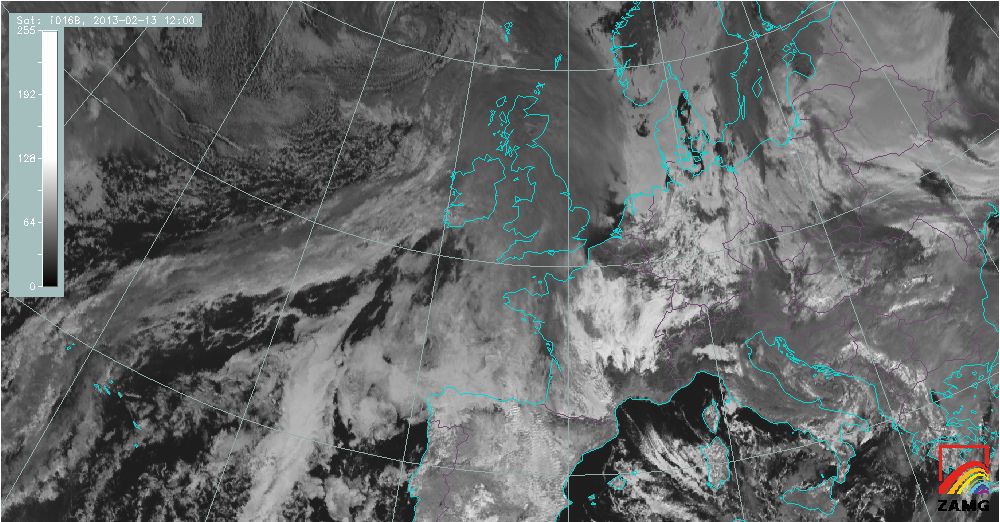
| 02 | 0,8 µm | VIS: window
Gray shades represent: different values of albedo; high sensitivity for soil and vegetation |
|
| Channel number | Central wave length | Additional characterization | Typical application areas |
|---|---|---|---|
| 03 | 1,6 µm | NIR: window
Gray shades represent: different values of albedo; different reflectivity of ice and water clouds |
|
| Channel number | Central wave length | Additional characterization | Typical application areas |
|---|---|---|---|
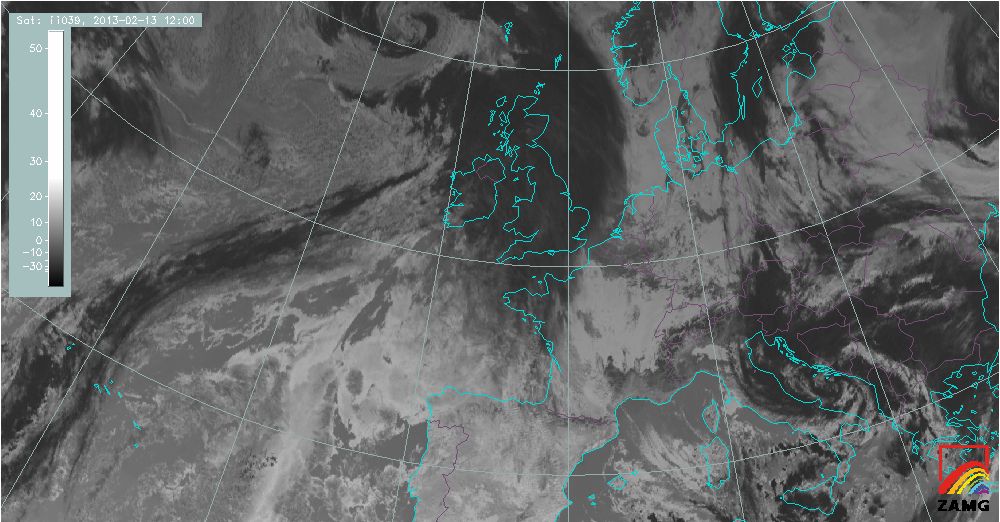
| 04 | 3,9 µm | IR
Gray shades represent:
|
|
| Channel number | Central wave length | Additional characterization | Typical application areas |
|---|---|---|---|
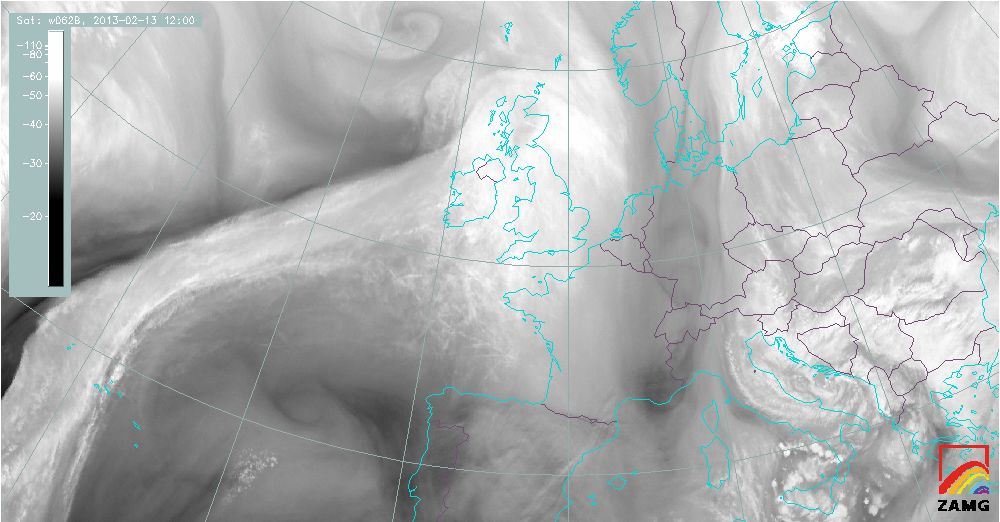
| 05 | 6,2 µm | WV Absorption band
Gray shades represent: Different WV content in high layers |
Channel regularly used in SatManu |
| Channel number | Central wave length | Additional characterization | Typical application areas |
|---|---|---|---|
| 06 | 7,3 µm | WV Absorption band
Gray shades represent: The amount of WV in high and middle layers |
|
| Channel number | Central wave length | Additional characterization | Typical application areas |
|---|---|---|---|
| 07 | 8,7 µm | IR
Gray shades represent: Surface/cloud top temperatures; sensitivity to high, thin Cirrus |
|
| Channel number | Central wave length | Additional characterization | Typical application areas |
|---|---|---|---|
| 08 | 9,7 µm | Ozone Absorption band
Gray shades represent: Surface/cloud top temperatures; Sensitivity to ozone content |
|
| Channel number | Central wave length | Additional characterization | Typical application areas |
|---|---|---|---|
| 09 | 10,8 µm | IR
Gray shades represent: Surface/cloud top temperatures; |
Channel regularly used in SatManu |
| Channel number | Central wave length | Additional characterization | Typical application areas |
|---|---|---|---|
| 10 | 12 µm | IR
Gray shades represent: Surface/cloud top temperatures; sensitivity to high thin Cirrus |
|

| Channel number | Central wave length | Additional characterization | Typical application areas |
|---|---|---|---|
| 11 | 13,4 µm | CO2 absorption band
Gray shades represent: Surface/cloud top temperatures; sensitivity to CO2 absorption |
|
| Channel number | Central wave length | Additional characterization | Typical application areas |
|---|---|---|---|
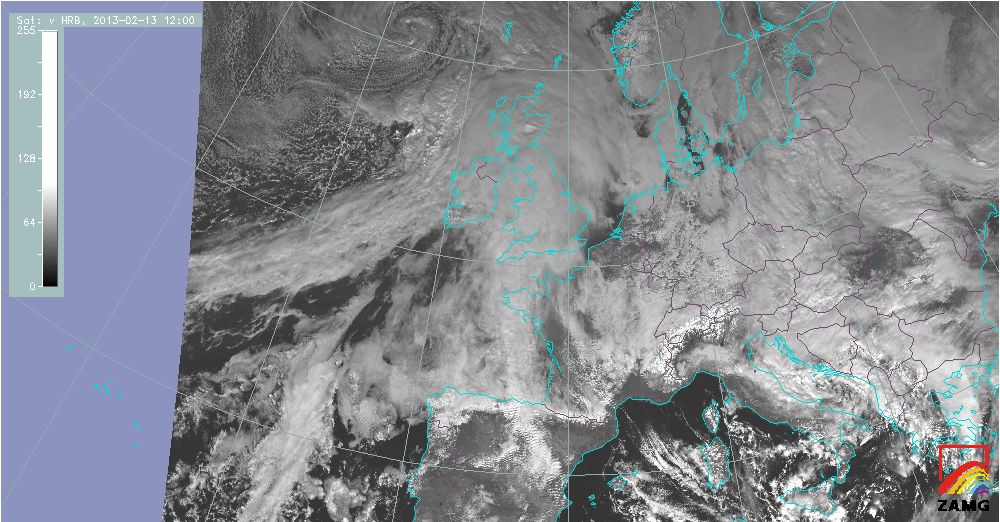
| 12 | Broad band: 0,3 - 1 µm | High resolution Visible
Resolution at nadir = 1 km Gray shades represent: Different values of albedo |
|