10. March 2010
Due to advection of cold continental air from northeast and warm air from southwest a strong temperature gradient (15K/100km) between the atmosphere over the Adriatic Sea and the Adriatic mainland was build up (Fig 3.19). Due to this fact, and assisted by the close up of the Mediterranean low a very significant pressure gradient of about 15hPa was build up over the Dinaric Alps (Fig 3.20). The result is a strong katabic storm called Bora with mid wind at 6UTC of about 45kt (Fig 3.18). The Bora mostly occurs in winter and blows in gusts. The strongest gust during this event was measured in Trieste with 102kt (source: http://www.zamg.ac.at). The cold down-slope wind cools the coast areas and makes also in these regions snowfall possible. This is verified in Fig 3.18: snowfall (pink symbols) was reported in large areas of the east Adriatic region, also down to the coastlines.
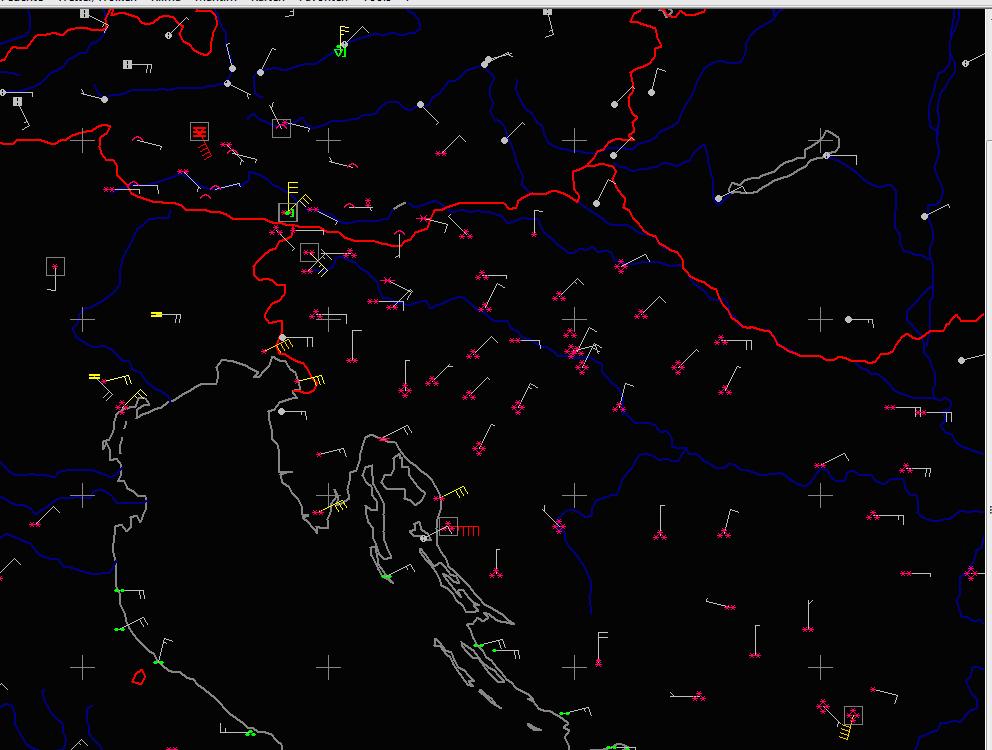
Figure 3.18: 10.3.2010 6UTC - Synop ww; Mean Wind;
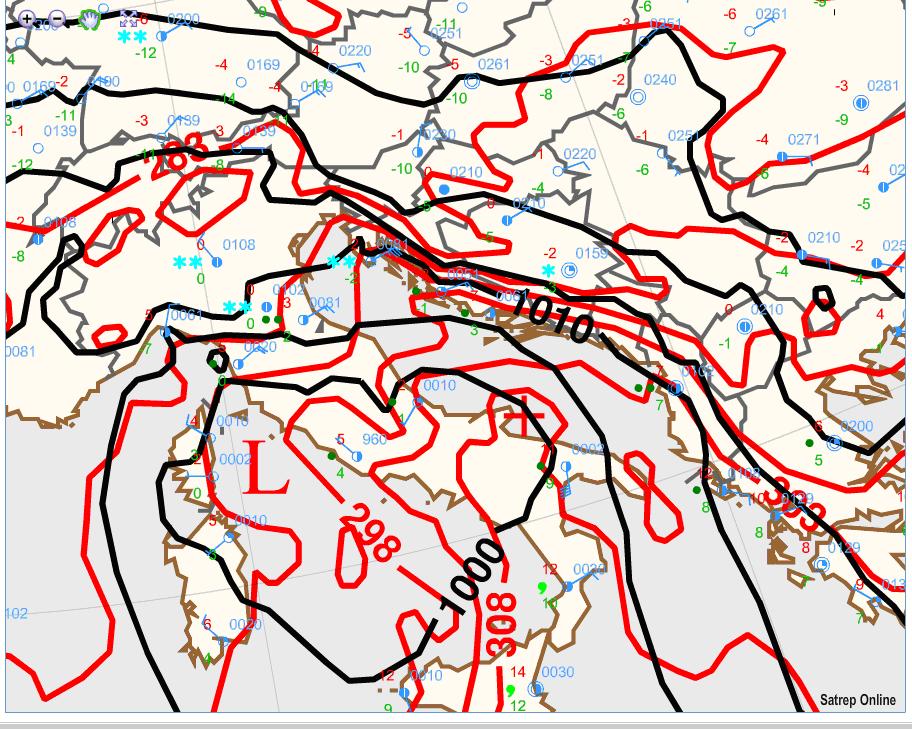
Figure 3.19: 10.3.2010 0UTC - Synop reports; red lines: ECMWF ThetaE in 850hPa [5K]; black lines: ECMWF MSLP [5hPa]
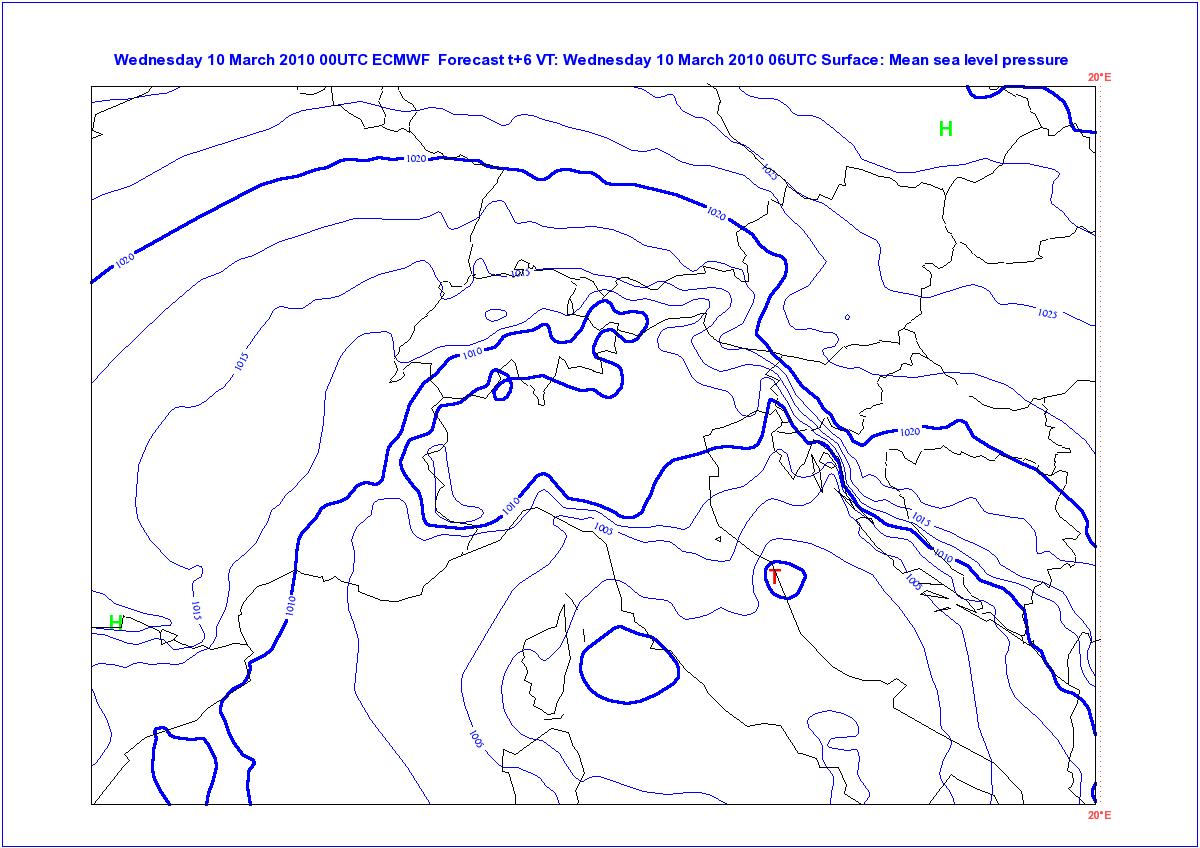
Figure 3.20: 10.3.2010 0UTC - blue lines: ECMWF MSLP [2.5hPa]
Figure 3.21: 10.3.2010 6UTC sounding Udine (Italy); (http://weather.uwyo.edu)
The strong Bora storm is also shown on the TEMP Sounding from Udine 10.3.2010 6UTC with mean wind of 55kt in ground near level (Fig 3.21). Two other interesting things we can see on this TEMP: the two front areas from the occlusion between 850hPa and 700hPa; the precipitable water content (PWAT [mm]) of about 12mm; In the night to the 10.3.2010 the occlusion reaches the north and east Adriatic coast (Fig 3.22). Together with the strong wind, heavy snowfall in Croatia and Slovenia generates partly critic situations. In the south of Austria it also begins to snow.
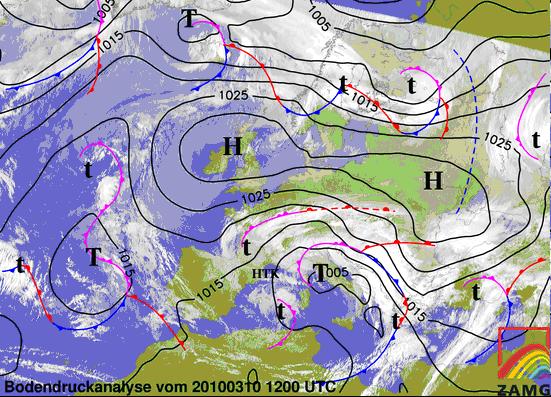
Figure 3.22: 10.3.2010 12UTC - MSG IR; black lines: MSLP; Surface Frontal Analysis
The 300hPa Geopotential height and the Isotachs show, that the region around the Adriatic Sea is in the left exit area of the jet (Fig 3.23). Thereby strong horizontal divergence in 300hPa (Fig 3.24) supports the lifting processes and the resulting precipitations.
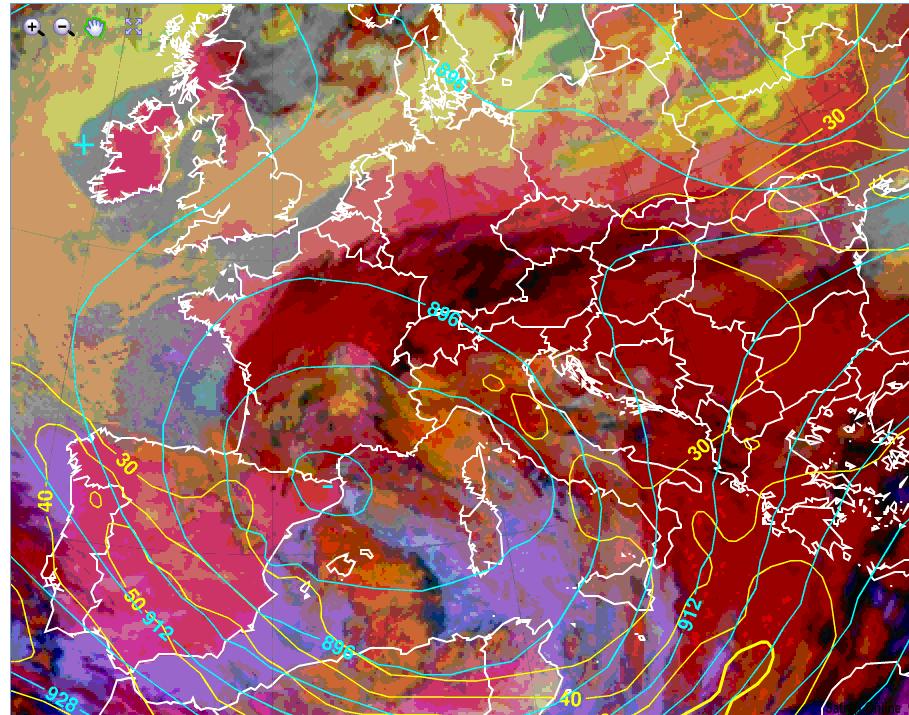
Figure 3.23: 10.3.2010 6UTC - MSG Microphysics RGB; turquoise lines: ECMWF ATP300; yellow lines: ECMWF Isotachs in 300hPa;
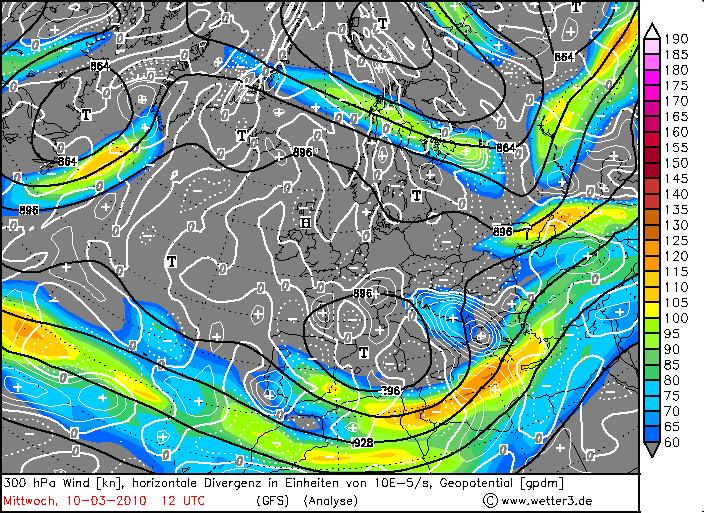
Figure 3.24: 10.3.2010 12UTC GFS - black lines: ATP300; white lines: horizontal divergence in 300hPa; coloured areas: 300hPa Wind
On the 10 March 12UTC the occlusion is located just in the south of the Alps (Fig 3.25) In the vertical cross section (Fig 3.26) on the left side we can see the frontal zone. The very high temperature gradient of this occlusion is a hint for the big influence on the weather in this region. In Fig 3.27 (next chapter) we see, that in the area of the frontal system a great PVA maximum is embedded. This also supports the lifting processes.
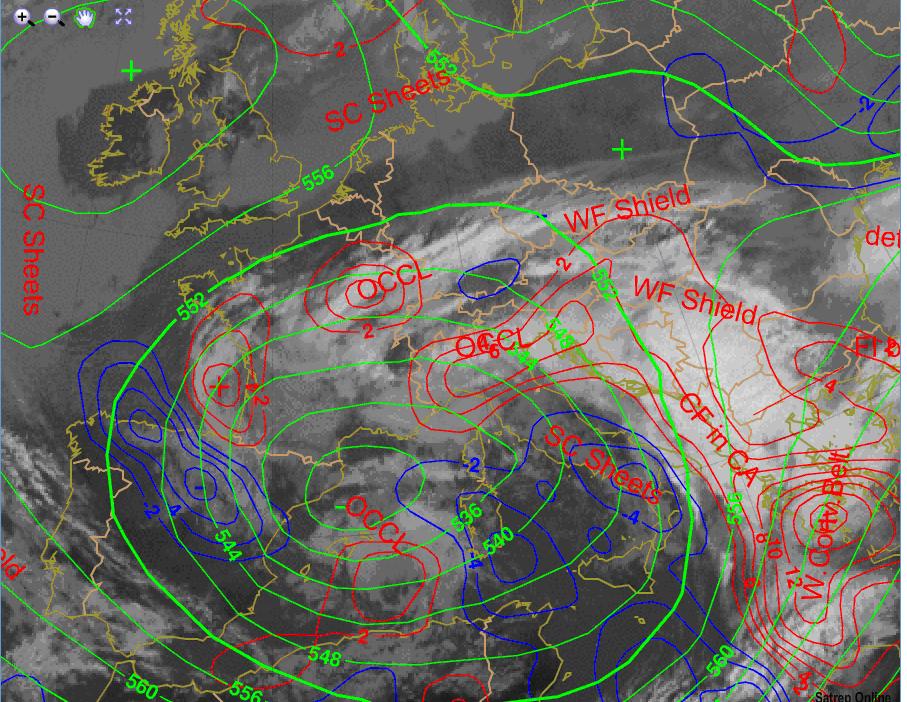
Figure 3.25: 10.3.2010 12UTC - MSG IR.10.8 with overlay SatRep; green lines: ECMWF ATP500; red/blue lines: ECMWF TA in 700hPa
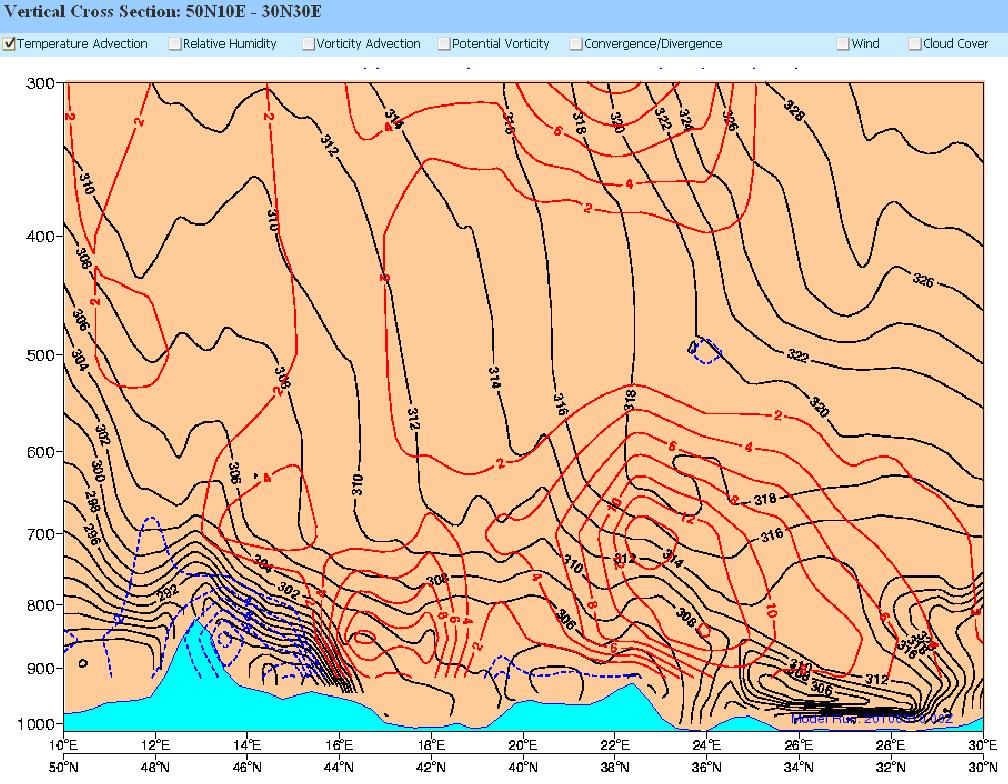
Figure 3.26: 7.3.2010 12 UTC - Vertical Cross Section 50N10E - 30N30E; black lines: ECMWF isentropes; blue/red lines: TA