9. March 2010
On the Airmass RGB (Fig 3.10) as reddish band and on the WV6.2 (Fig 3.12 and 3.13) as dark band we can see a deformation band across Europe. The low over the Mediterranean Sea is still provided by cold dry stratospheric air with high Potential Vorticity (Fig 3.11). In the region of a deformation band frontogenesis occurs when the angle between the axis of dilatation and the isentropes is smaller than b=45° (Fig 3.9). Because this is the case (Fig 3.13), the temperature gradient in the relevant region increases. Two other deformation zones (Fig 3.12) can bee seen over the Mediterranean and the Adriatic Sea.
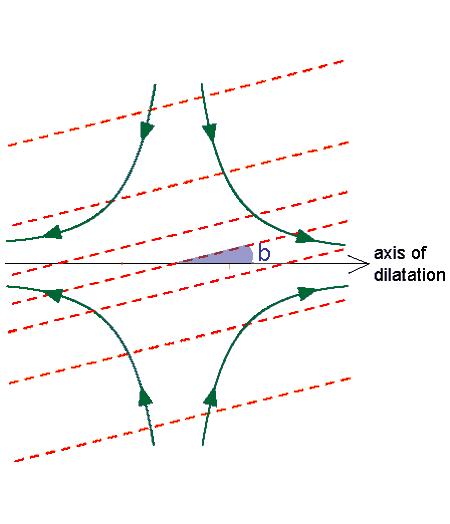
Figure 3.9: frontogenetic active deformation zone; green lines: streamlines; red lines: isentropes;
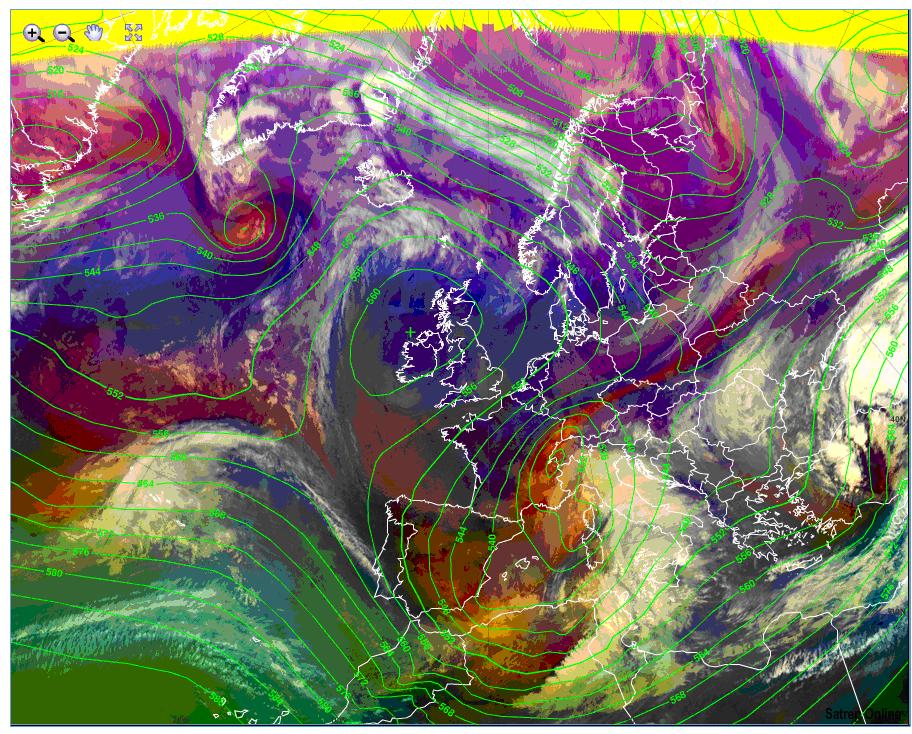
Figure 3.10: 9 March 2010 12UTC - MSG Airmass RGB; green lines: ECMWF ATP500
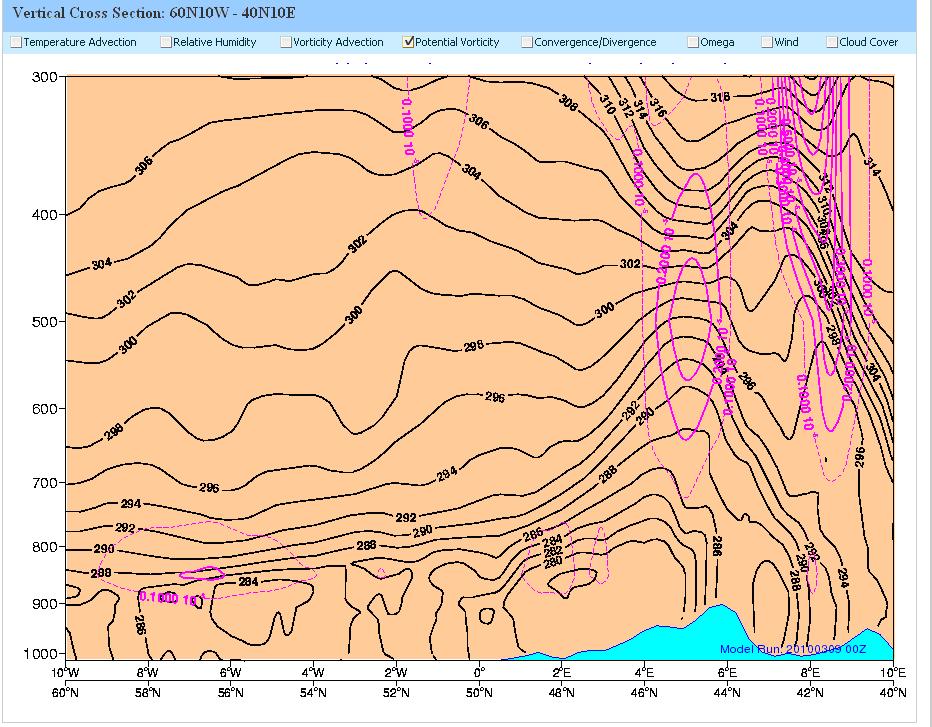
Figure 3.11: 9 March 2010 12UTC - Vertical Cross Section 60N 10W - 40N 10E; black lines: ECMWF isentropes; purple lines: ECMWF Potential Vorticity
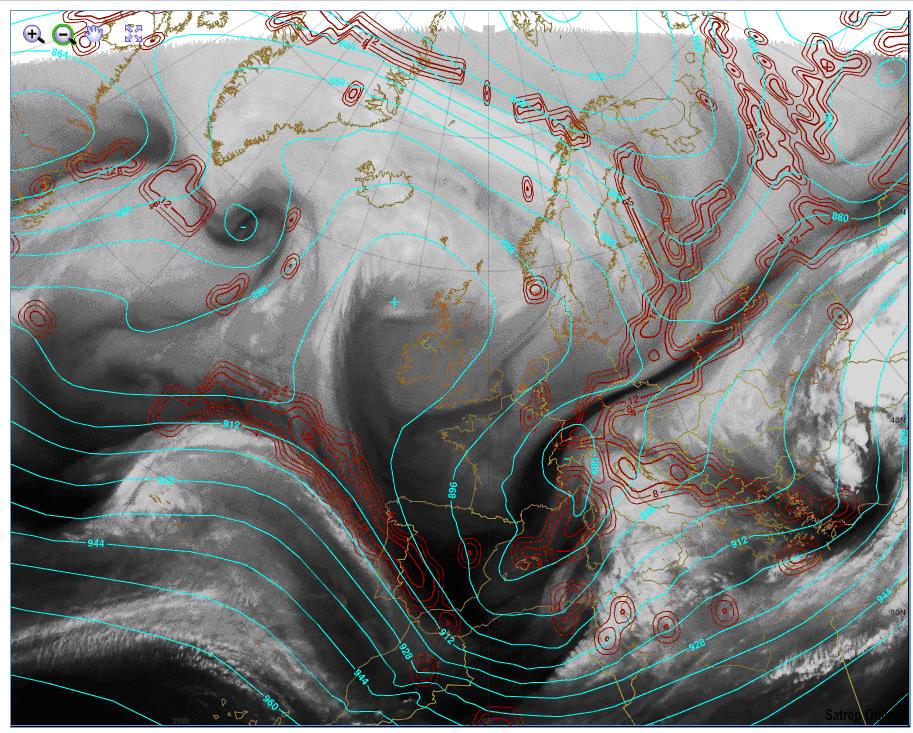
Figure 3.12: 9 March 2010 12UTC - MSG WV6.2; cyan lines: ECMWF ATP300; red lines: ECMWF Total Deformation at 300hPa
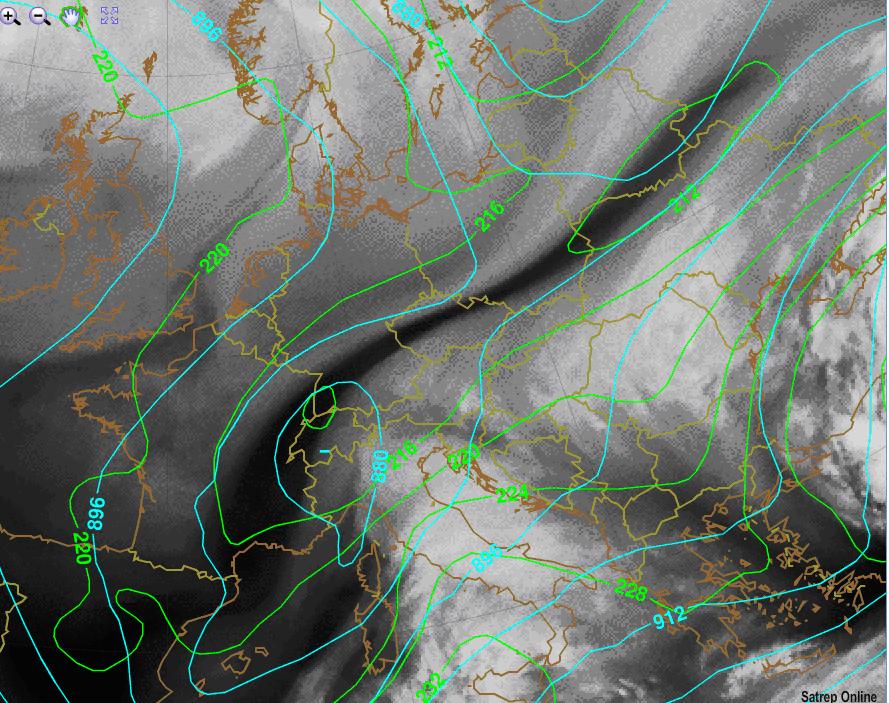
Figure 3.13: 9 March 2010 12UTC - MSG WV6.2; cyan lines: ECMWF ATP300; green lines: ECMWF Equivalent Thickness
The system gets more and more energy from the Mediterranean Sea. On the 9th of March the occlusion reaches Italy with strong wind and heavy precipitation (Fig 3.15). Heavy snowfall occurs in many regions down in very low heights (Fig 3.14). In the north of Italy ThetaE in 850hPa (Fig 3.16) of about 283K implies that snowfall down to the lowlands is possible. But also in the middle of Italy the potential snowfall limit was very low. ThetaE in 850hPa (Fig 3.16) of around 288K indicates a snowfall limit of about 200m above sea level. This approximation is only suitable if the Atmosphere is mixed enough. The pressure gradient in the discussed area indicates that this should be the case. The surface pressure gradient over the East Coast of the Adriatic Sea is also very high by now - a robust Bora Wind is announcing. More detailed information about this phenomenon follows in the next chapter. Convenient to the synop reports Fig 3.16 based on NWCSAF data shows a very high probability of precipitation over Italy.

Figure 3.14: Heavy Snowfall in Bologna (54m above sea level) (Italy); (APA)

Figure 3.15: 9.3.2010 12UTC - MSG IR; black lines: MSLP; Surface Frontal Analysis

Figure 3.16: 9.3.2010 12UTC - MSG IR 10.8 with overlay NWCSAF Precipitating Clouds; red lines: ECMWF TheataE in 850hPa
In Fig 3.17 an upper air sounding from 9 March 2010 12UTC Zagreb (Croatia) is shown. Temperature and Dew Point jumps indicate two air mass changes. This is a hint to the approaching occlusion. The indication for warm air advection is the clockwise change in wind direction with height.
Figure 3.17: 9.3.2010 12UTC sounding Zagreb (Croatia); (http://weather.uwyo.edu)