8. March 2010
A surface low which first occurs over Spain developed due to intense cyclogenesis as a result of the massive Cold Air approach over the relatively warm (about 13°C) Mediterranean Sea (Fig 3.1). The low has by now a central pressure of about 995 hPa (Fig 3.1). The upper level low and the surface low are geographically displaced. This indicates further evolution of the System. The green to orange fields overlaid the IR10.8 Sat-Image show the probability for precipitation of the detected clouds, based on NWCSAF data. This picture shows good accuracy for precipitation in the region of the frontal System over the south of France and North-East Spain. A second upper level low with cold air has the position over Austria. This cold air will support in the following the cyclogenesis over the Mediterranean Sea.

Figure 3.1: 8.3.2010 - ECMWF SST [°C]
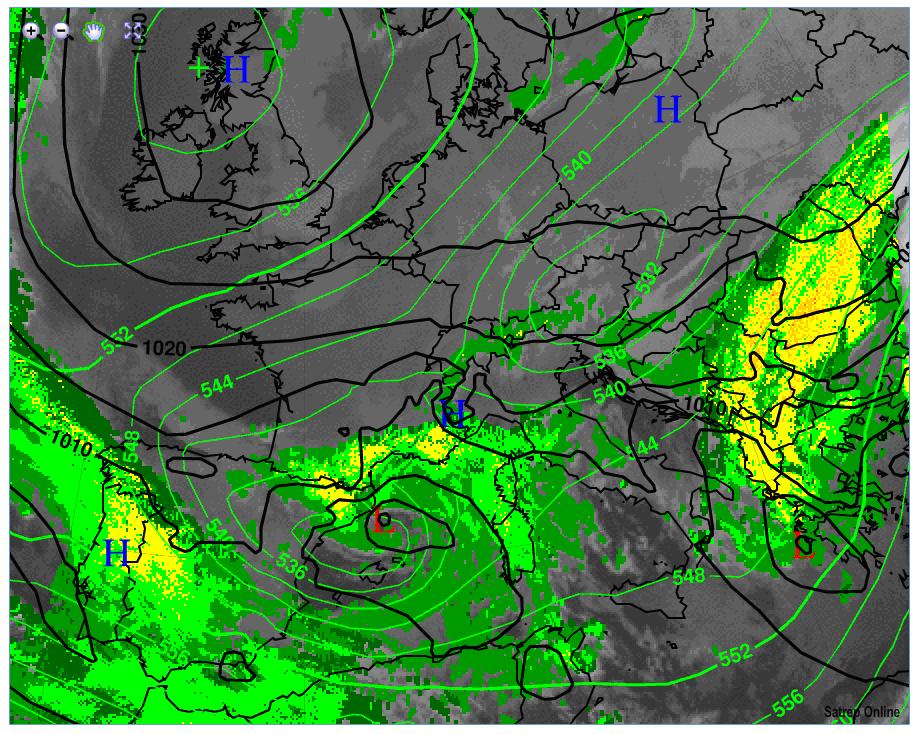
Figure 3.2: 8.3.2010 18UTC - MSG IR 10.8 with overlay NWCSAF Precipitating Clouds; green lines: ECMWF ATP500;
Fig 3.3: The surface chart shows the occluded System over the Mediterranean Sea which tracks eastward to Italy.
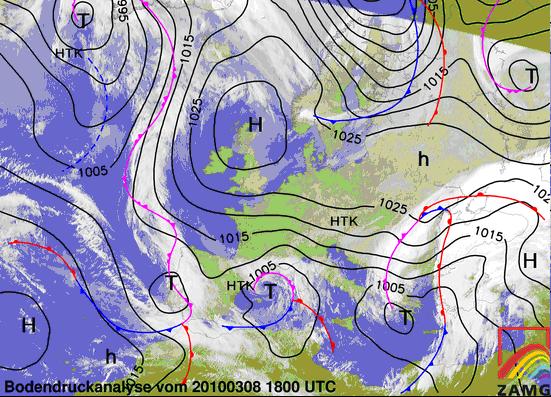
Figure 3.3: 8.3.2010 18UTC - MSG IR; black lines: MSLP; Surface Frontal Analysis
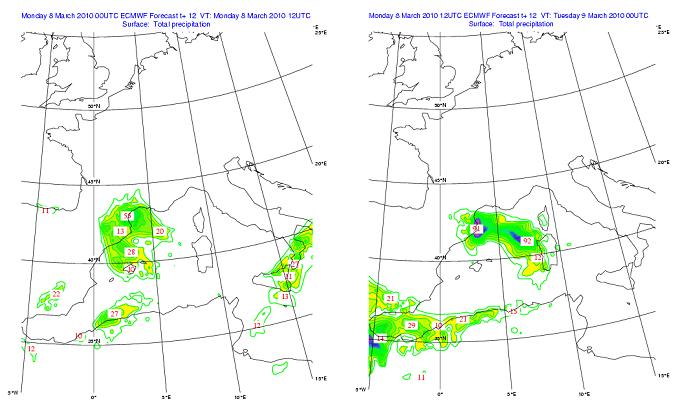
Figure 3.4: ECMWF 12h Precipitation [mm] for 8.3.2010 12UTC and 9.3.2010 0UTC
Fig 3.4: ECMWF Precipitation shows heavy precipitation in the region of the occlusion and the cold front. Meteoalarm (Fig 3.6) has an orange snow warning for France and Spain, because the 850hPa temperature in the regions with precipitation is about 288K. This indicates a potential snowline height of about 200m above sea level. In the region around Barcelona the heaviest snowfall since 25 years occurs (APA). Even in coast regions a light snow cover developed (Fig 3.5). Also directly in Barcelona snowfall was reported (Fig 3.6). Italy has a red warning for strong rain for the next days from the same system.
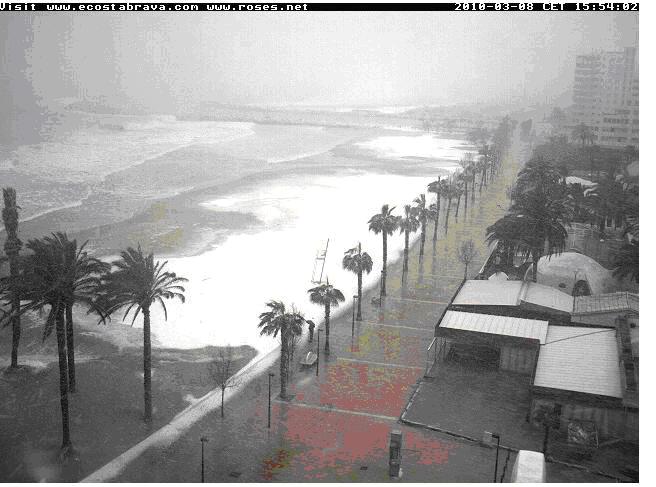
Figure 3.5: 8.3.2010 - Snow Covered Coastline on the Costa Brava (www.roses.net)
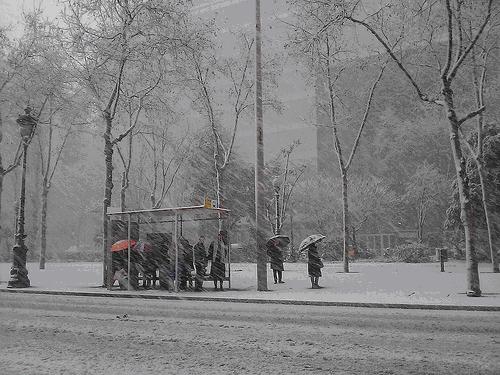
Figure 3.6: 8.3.2010 - Heavy Snowfall in Barcelona (www.diluvi.com)
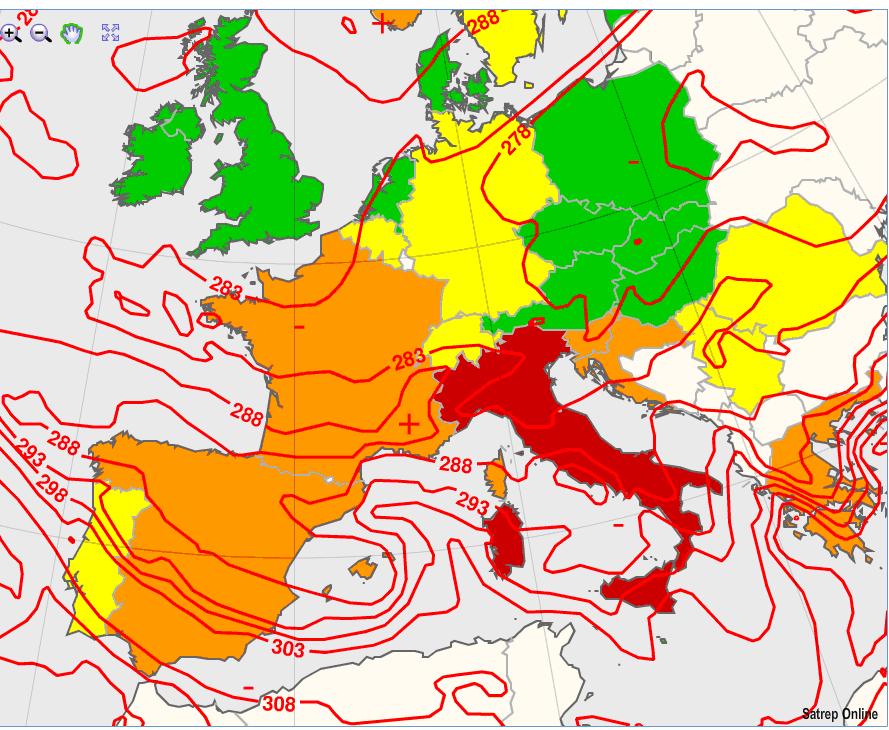
Figure 3.6: 8.3.2010 18UTC - MeteoAlarm (further Information see Text); red lines: ECMWF ThetaE in 850hPa
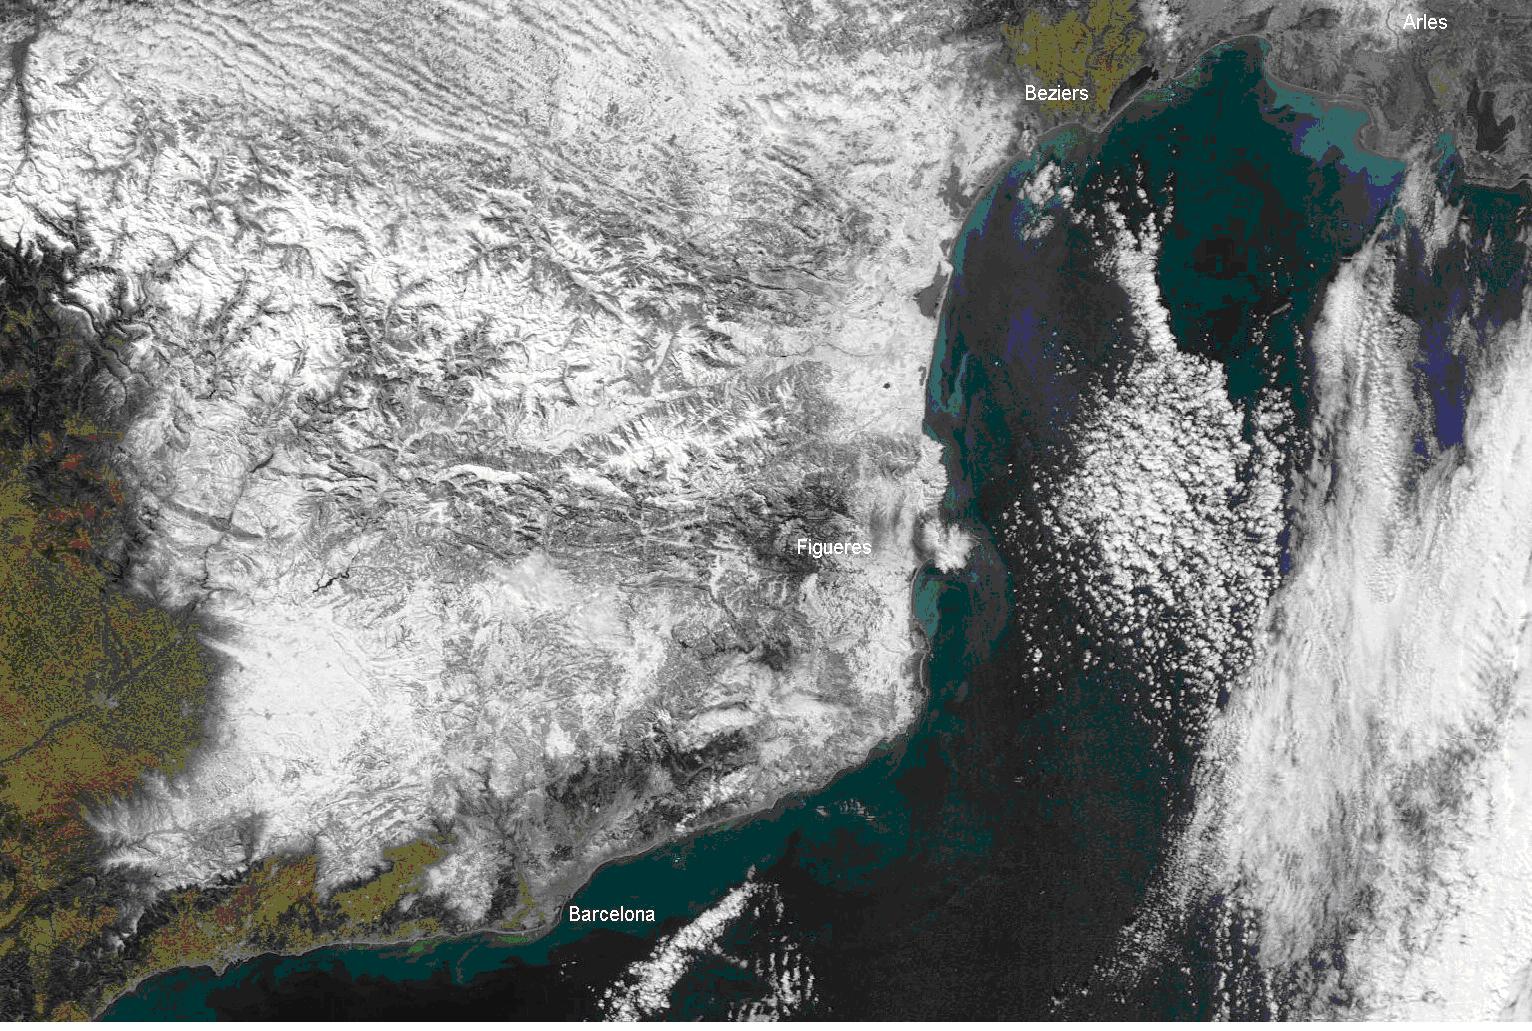
Figure 3.7: 9.3.2010 13UTC - Aqua-Sat Visible Image after the snow event (hrapidfire.sci.gsfc.nasa.gov)
Fig 3.7 shows a visible satellie image from the discussed region after the snow event. To this time the frontal system is alredy moved eastward. Because it is widely cloudfree over the east of the spanish mainland. The white areas over the land demonstrate a snow cover also down to the coast. This is very unusual, especially for March.