Introduction
From 10th to 16th of November 2001 a series of intensive storms moved over the Northern Atlantic and passed through Scandinavia and Finland to the east. A few of the storms were remnants of hurricanes but the one storm that caused extensive damage, at least to Finland, was of a smaller scale. It was named "Janika". The naming "Janika" is not according to international conventions but was introduced by the Finnish Meteorological Institute (FMI). For convenience it is used in this manual for storm identification.
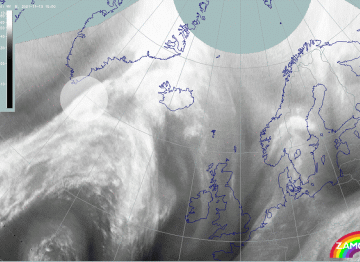
From a satellite meteorology point of view, the storm Janika is an ideal example of Greenland lee cyclogenesis which is a local type of Rapid Cyclogenesis: An old Occlusion was located over the middle and northern parts of Greenland. A Wave (denoted in the loop below with a white circle) travelled from the south of Greenland, from the right side of the jet axis to the left side, and towards the Occlusion point.
|
13 November 2001/15.00 UTC - Meteosat WV image; yellow: isotachs 300 hPa, magenta: height of PV = 2 units; 13/00.00 - 13/21.00 UTC
3-hourly image loop
|
|
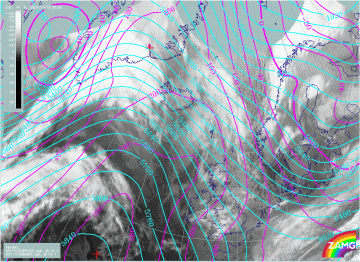
A Dark Stripe, seen in the WV images, grew remarkably to the lee of Greenland. Jet Intensification took place and Rapid Cyclogenesis started. In the next loop a minor low forms near the eastern tip of Greenland. At the same time the upper level flow becomes more westerly and at the surface a sharp ridge of high pressure forms over Greenland.
|
13 November 2001/00.00 UTC - Meteosat IR image; cyan: height contours 500 hPa, magenta: height contours 1000 hPa; 13/00.00 - 15/00.00
UTC 3-hourly image loop
|
|
Janika is also a good case for investigating developments that can cause extremely gusty winds. In Janika the turbulent flows were connected to two broad low level jets, one in the warm advection, the other in the cold pool associated with the Arctic Cold Front. A third phenomenon, a deep tropospheric gravity wave, had an additional impact on wind gusts. Some of the processes started in the Water Vapor Eye region and are related to vorticity fluctuations and the generation of gravity waves. These concepts will be discussed in more detail in the next chapters.
From a forecaster's point of view, the storm will be well remembered, since the associated rise and fall of pressure as the low passed over Finland was large, nearly 16 hPa/3 hours, and very strong wind gusts appeared as organised weather sequences. These are explained by analysing Doppler radar images. Winds became stronger than predicted although forecasts had already indicated the possibility of a severe storm. The destruction caused by Janika was extensive due to the strong wind gusts, many resembling downbursts or F2 scale tornadoes. As a result of storm Janika, FMI and various authorities began to develop better ways for issuing warnings of severe weather events.
This catastophic weather situation addresses Rapid Cyclogenesis, Dark Stripes and Occlusions (see Rapid Cyclogenesis , Dark Stripes and Occlusion: Warm conveyor Belt Type ). The impact of Greenland on Rapid Cyclogenesis, a theory related to gravity waves, and the creation of white arc lines in water vapor images are also presented in this case.

