Table of Contents
The Synoptic Situation
From October 25 till 28 October 2002, a depression moved from the western part of the Atlantic Ocean towards Europe. On 23 October 2002 the depression had developed on the east coast of the United States. On 26 October the system arrived at the British Isles and on October 27 over the mainland of Western Europe. On October 27 at 12.00 UTC the lowest pressure value in the centre of the system, was 973 hPa. Thereafter, the pressure gradually began to rise. The last day of the sequence was October 28, the depression is now decaying and is located above Northeastern Europe.
The Cold Front belonging to this depression is in cold advection during the period. In the beginning it is an Ana Cold Front. On the 26th of October at 18.00 UTC the first signs of a Kata Cold Front could be seen. On October 27 at 06.00 UTC the front is definitely identified as a Kata Cold Front. By the end, on October 28, the Cold Front seems to switch back to an Ana Cold Front, but the indication for this is very weak.
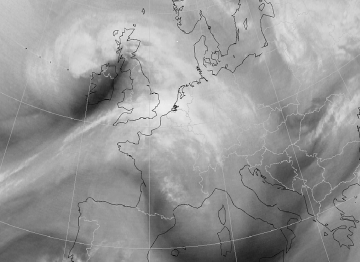
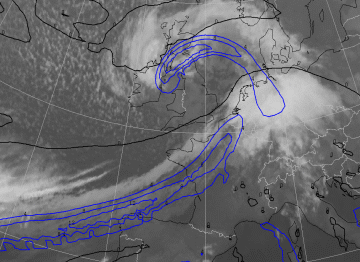
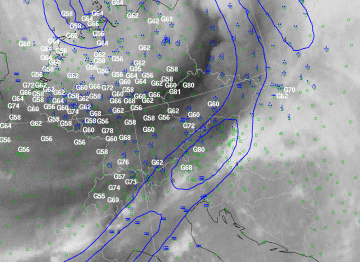
A Dark Stripe in the WV image appears on October 26 at 45°N and 35°E and moves toward Great Britain. At 18.00 UTC the Dark Stripe lies just west of Ireland.
On October 27 at 00.00 UTC the Dark Stripe is located exactly over Ireland. 6 hours later it is situated over Great-Britain and 6 hours later, over the Netherlands. At 18.00 UTC the position of the Dark Stripe is over Poland and Germany. On the last day, October 28th, the Dark Stripe becomes smaller and eventually disappears.
|
27 October 2002/00.00 UTC - Meteosat WV image; 27/00.00 - 28/00.00 UTC 3-hourly image loop
|
|
Theory
The main characteristic of this case is a Dark Stripe in the satellite water vapour image and is marked by a darker colour than its surroundings (see Water Vapour Dark Stripe ). A Dark Stripe indicates the presence of descending dry air, which can be of stratospheric origin. The stripe develops along the cyclonic side of the white water vapour band. Typical places of appearance of Dark Stripes are the rear of Cold Fronts and Occlusions, and the forward sides of Warm Fronts. This case study will concern a Dark Stripe behind a Cold Front.
There is a strong relationship between a Dark Stripe and potential vorticity. The value 2 PVU (potential vorticity units) of the potential vorticity indicates the tropopause. In the literature, values of 1.5 PVU are mentioned (see potential vorticity). A Dark Stripe, as mentioned here, is a PV-anomaly, at an inclined plane, at the rear of a Cold Front.
|
|
|
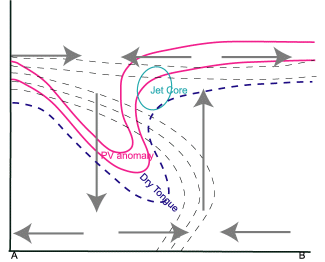
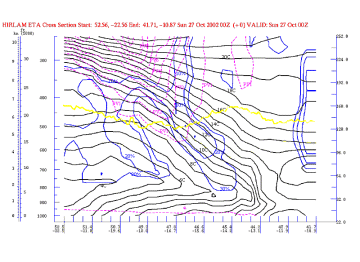
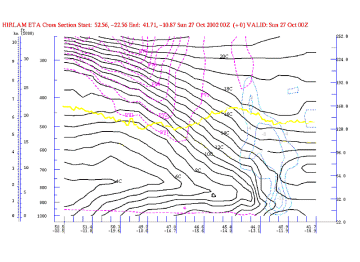
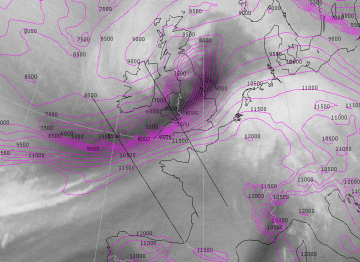
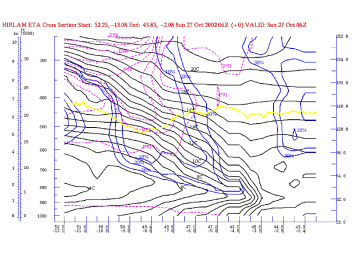
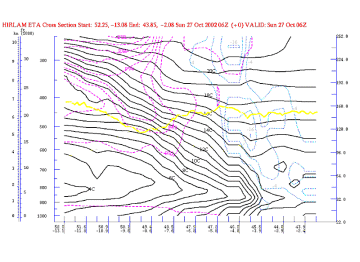
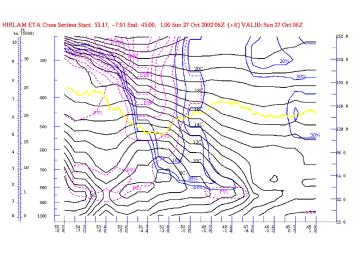
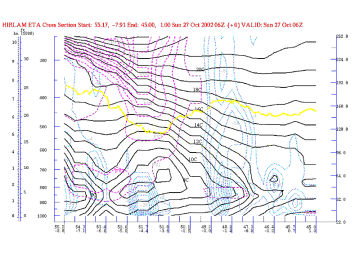
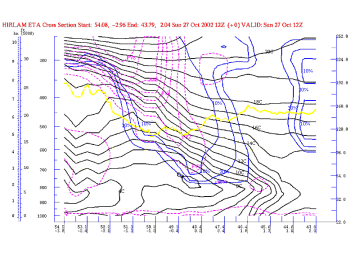
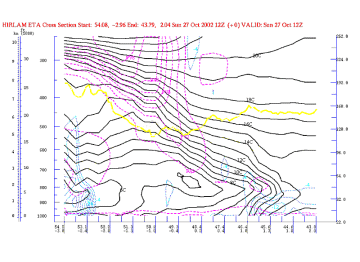
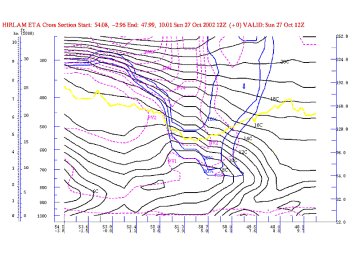
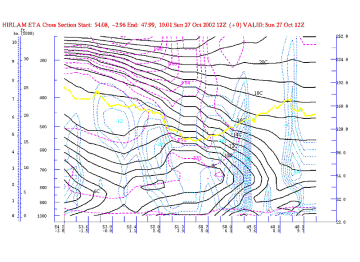
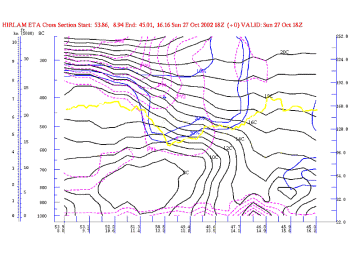
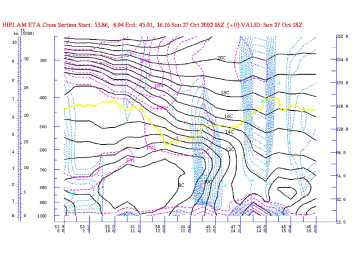
The figure above is a vertical cross section of a Dark Stripe behind a Kata Cold Front. The dashed black lines indicate the isolines of equivalent potential temperature. The lines first bend forward and bend backward at higher levels. This is the classic pattern for a Kata Cold Front.
The red line is potential vorticity with a value of 2 PVU. This line is an indication of the tropopause. High values of potential vorticity drop behind the front plane.
The blue line represents an area of very low relative humidity. Above this line the air is very dry. According to the theory, the position of this extremely dry air is the area where the PV-anomaly is positioned. The jet streak can be found in front of the PV-anomaly and just behind the surface Cold Front.
To the rear of the Cold Front there is cold air, which is related to descent. The descending air mass can be seen at the rear of the PV-anomaly. Ascending air is situated in front of the PV-anomaly.
In order to study the type of Cold Front, two parameters can be used: the thermal front parameter and the zero line of the shear vorticity. The thermal front parameter lies forward of the cloudiness in the case of an Ana Cold Front, and within the cloudiness, to the rear, for a Kata Cold Front. In both cases, the zero line of the shear vorticity can be seen behind the edge of the cloudiness. In the case of an Ana Cold Front it is situated parallel to the clouds; in the case of a Kata Cold Front the zero line lies at an angle to the front.
Of special interest are situations with strong wind fields which are present deep down in the troposphere, this is often the case to the rear of a Cold Front in the dry intrusion of a storm depression (e.g. in the mature stage of Rapid Cyclogenesis). The descending air with high values of PV penetrates into the (potentially) unstable layers in the lower part of the troposphere. PVA in front of the PV-anomalies enhances the convection, the convection could be dry but also moist, resulting in showers. This mechanism causes a strong variation in upward and downward motion near the surface and leads to extremely gusty winds.
Analysis of 27 October 2002
27 October 2002/00.00 UTC
|
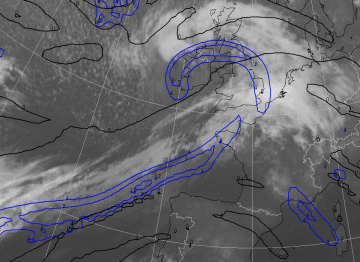
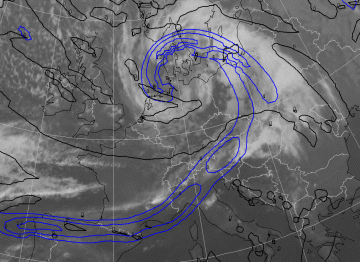
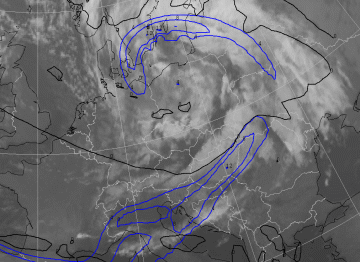
27 October 2002/00.00 UTC - Meteosat IR image; blue: thermal front parameter (TFP) 500/850 hPa, black: zero line of shear vorticity 300
hPa
|
|
The centre of a depression is positioned over Ireland and the system has reached a mature state. The central pressure does not fall any further. The Cold Front is positioned from Great-Britain to 40°N and 20°W over the Atlantic Ocean. The structure of the cloud band is less pronounced than at previous moments in time. On the infra red satellite image above less cloudiness can be seen than before and the cloudiness that is present, is mostly located at low levels in the atmosphere. This has to do with the fact that this Cold Front is in cold air advection all the time.
The thermal front parameter is located in front of the band of cloudiness, which indicates an Ana Cold Front. The zero line of the shear vorticity can be seen behind the clouds and is situated parallel to the front. This is also similar to an Ana front.
|
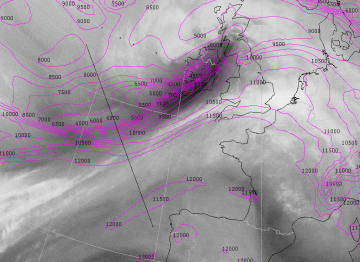
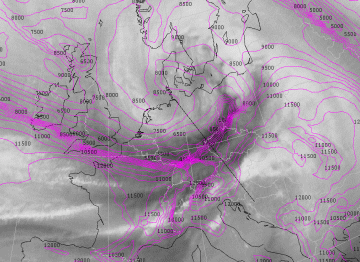
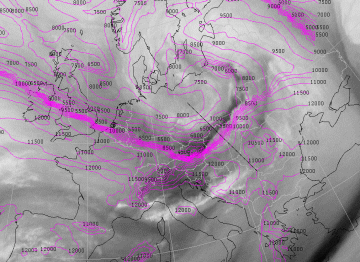
27 October 2002/00.00 UTC - Meteosat WV image; magenta: height of 2 units potential vorticity, position of vertical cross section
indicated
|
|
The height of the value 2 PVU (dynamical tropopause) shows the Dark Stripe with a strong gradient in the isolines of the height contours. The tropopause behind the Cold Front descends from 10000m to 6000m. In comparison with earlier stages of the sequence, the tropopause has sunk deeper into the troposphere.
|
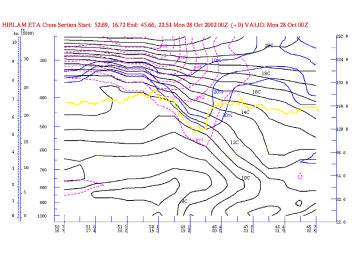
27 October 2002/00.00 UTC - Vertical cross section; section; black: isentropes (ThetaW), magenta: potential vorticity, blue: relative
humidity, yellow: WV pixel values
|
|
The ThetaW lines show the pattern of a Cold Front. Up to 700 hPa the lines go straight upward, so that it seems to be a Kata Cold Front. At previous points in time similar patterns are seen. There is a difference in result between the ThetaW lines and satellite images because there will probably be a change from an Ana to a Kata Cold Front. The ThetaW lines show high potential instability up to about 2km.
The PV-anomaly shows that the tropopause is at a lower level behind the surface Cold Front than in front of it. The PV-anomaly of 2 PVU is down to 450 hPa. This is 50 hPa lower than on the 26th of October at 18.00 UTC. The anomaly also becomes wider.
The PV-anomaly is accompanied by dry air at low levels in the atmosphere. The pattern of the dry air is a little shifted in comparison to the pattern of the potential vorticity: the dry air can be seen somewhat in front of the maximum PV values.
|
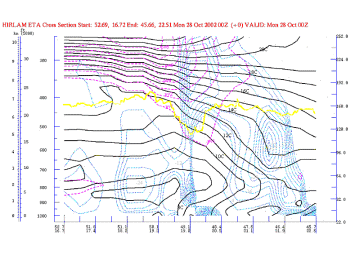
27 October 2002/00.00 UTC - Vertical cross section; section; black: isentropes (ThetaW), magenta: potential vorticity, blue: vertical
motion (omega) - upward motion, yellow: WV pixel values
|
|
Negative values of omega (rising motion) are located in front of and above the surface Cold Front. In the entire area behind the Cold Front the air is descending.
|
27 October 2002/00.00 UTC - Radiosonde Valentia (southwest Ireland)
|
|
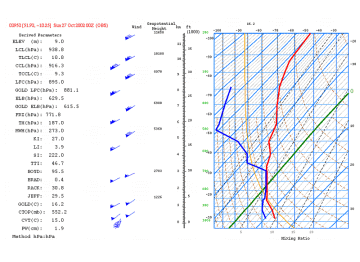
The sounding diagram of station 03953 (Valentia) in southwest Ireland. The air above 700 hPa is dry, this confirms the idea of the descending air behind the Cold Front.
27 October 2002/06.00 UTC
|
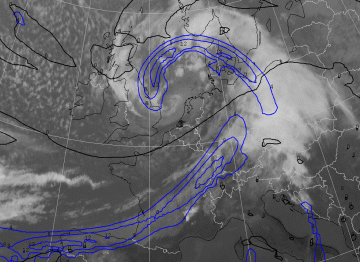
27 October 2002/06.00 UTC - Meteosat IR image; blue: thermal front parameter (TFP) 500/850 hPa, black: zero line of shear vorticity 300
hPa
|
|
The Cold Front is situated between the North Sea and northwest Spain. The frontal zone is a broad band of low level cloudiness, however, to the rear there is some higher level cloudiness. This has the appearance of a Kata Cold Front. The centre of the depression has moved to the northeast, where the central pressure remains more or less constant. The centre is located above northern England at 06.00 UTC.
The thermal front parameter is located in front of the frontal cloudiness. The northern part of the Cold Front is of a Kata type. The southern part of the front is an Ana Cold Front. The zero line of the shear vorticity is not parallel to the frontal cloudiness anymore. This also indicates a Kata Cold Front.
|
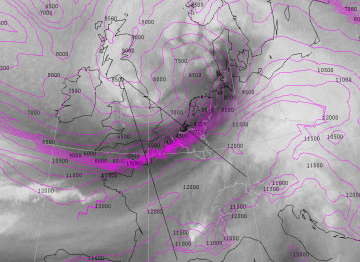
27 October 2002/06.00 UTC - Meteosat WV image; magenta: height of 2 units potential vorticity, position of vertical cross sections
indicated
|
|
On the satellite water vapour image a broad band with high values of relative humidity can be seen. The Dark Stripe is situated from the eastern part of the North Sea via southwest England towards the Atlantic. The PV=2 PVU level shows a strong gradient in the height of the tropopause: from 10000m to 5500m. Compared with the situation at 00.00 UTC, the tropopause has descended further. The gradient of the height isolines is located along the front side of the Dark Stripe.
|
27 October 2002/06.00 UTC - Vertical cross section (West); section; black: isentropes (ThetaW), magenta: potential vorticity, blue:
relative humidity, yellow: WV pixel values
|
|
The vertical cross section above is of the western part of the Cold Front. In spite of the fact that the thermal front parameter and the shear vorticity indicate an Ana Cold Front, the ThetaW pattern indicates a Kata front, i.e. the Cold Front slowly changes into a Kata Cold Front.
Behind the Cold Front the air is potentially unstable up to 800 hPa. The PV-anomaly increased a little. The tropopause level reaches 500 hPa. The dry air has nearly filled the space between 700 hPa and 250 hPa and the warmer air in front of the Cold Front. The dry air goes downwards to the bend in the ThetaW lines at 850 hPa. The dry air and the PV-anomaly are at the same location.
|
27 October 2002/06.00 UTC - Vertical cross section (West); black: isentropes (ThetaW), magenta: potential vorticity, blue: vertical
motion (omega) - upward motion, yellow: WV pixel values
|
|
In the area in front of the Cold Front upon upward motion is present.
|
27 October 2002/06.00 UTC - Vertical cross section (East); black: isentropes (ThetaW), magenta: potential vorticity, blue: relative
humidity, yellow: WV pixel values
|
|
The vertical cross section above from the eastern part of the Cold Front differs from that of the western one. The ThetaW lines of the eastern part clearly show a Kata Cold Front pattern. This is in agreement with the conclusions about the thermal front parameter and the zero line of the shear vorticity. The PV-anomaly is descending to lower levels in the atmosphere: 2 PVU can be seen at 550 hPa. The dry air is almost at the same place as the anomaly.
|
27 October 2002/06.00 UTC - Vertical cross section (East); black: isentropes (ThetaW), magenta: potential vorticity, blue: vertical
motion (omega) - upward motion, yellow: WV pixel values
|
|
In the above cross section of the eastern part of the Cold Front rising motion can be seen in front of the Cold Front and also behind the front. The latter is due to orography over the mountains of Wales.
Weather events
|
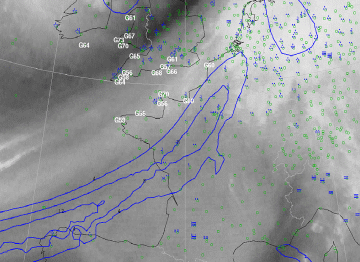
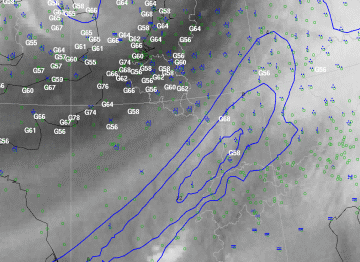
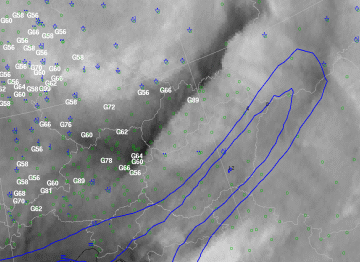
27 October 2002/06.00 UTC - Meteosat WV image; blue: thermal front parameter (TFP) 500/850 hPa, blue: weather events, white: wind
gusts > 55 kts 05.00 - 06.00 UTC
|
|
| Parameter | Description |
| Precipitation | The frontal precipitation is dominant over the northeastern part of France and Belgium, extending over the Netherlands. At the rear side of the front isolated, embedded showers are to be seen in the coastal areas of France and Belgium. |
| Wind (incl. gusts) | Wind gusts are reported along the coast of France and England in the Channel area. This is located to the rear of the frontal cloudiness, in the transition zone between white and dark in the water vapour image above. |
27 October 2002/12.00 UTC
|
27 October 2002/12.00 UTC - Meteosat IR image; blue: thermal front parameter (TFP) 500/850 hPa, black: zero line of shear vorticity 300
hPa
|
|
The clouds in the southern part of the frontal band have decayed further. The front is situated from Germany via France towards Spain. The centre of the low is located over the North Sea and is deepening again. The pressure in the centre of the depression reaches its lowest value of 973 hPa at 12.00 UTC. The temporary stabilisation of the centre pressure around 06.00 UTC is caused by friction over the land surface of the UK.
The thermal front parameter is located in the middle of the small frontal cloud band. This indicates a Kata Cold Front over the entire frontline. The zero line of the shear vorticity crosses the cloudiness, which also confirms the identification of a Kata front. The southern part of the zero line is far away from the frontal cloudiness.
|
27 October 2002/12.00 UTC - Meteosat WV image; magenta: height of 2 units potential vorticity, position of vetical cross section
indicated
|
|
The Dark Stripe is situated from Brittany towards Denmark via the Netherlands. The Cold Front is located more eastward.
The lines of PV = 2 show a strong gradient in the height of the tropopause. The gradient can be seen in front of the Dark Stripe. The tropopause descends from 11500m to 4500m: this is the lowest tropopause height so far.
|
27 October 2002/12.00 UTC - Vertical cross section (West); black: isentropes (ThetaW), magenta: potential vorticity, blue: relative
humidity, yellow: WV pixel values
|
|
This is the vertical cross section of the western part of the Cold Front. The ThetaW lines, the thermal front parameter and the shear vorticity indicate a Kata front. The PV-anomaly has sunk deeper: PV = 2 can be seen at 600 hPa. The dry air and the PV-anomaly are almost at the same position in the atmosphere.
|
27 October 2002/12.00 UTC - Vertical cross section (West); black: isentropes (ThetaW), magenta: potential vorticity, blue: vertical
motion (omega) - upward motion, yellow: WV pixel values
|
|
In the vertical cross section above there is not only upward motion in front of, but also to the rear of the surface Cold Front, in the upper front, and in the area of the PV-anomaly.
|
27 October 2002/12.00 UTC - Vertical cross section (East); black: isentropes (ThetaW), magenta: potential vorticity, blue: relative
humidity, yellow: WV pixel values
|
|
The vertical cross section above from the eastern part of the Cold Front looks almost the same as the western part. The pattern of the ThetaW lines is definitely that of a Kata front. This indicates that the whole front is now a Kata front. The PV-anomaly is down to about 700 hPa and the dry air is located at the same position.
|
27 October 2002/12.00 UTC - Vertical cross section (East); black: isentropes (ThetaW), magenta: potential vorticity, blue: vertical
motion (omega) - upward motion, yellow: WV pixel values
|
|
The rising motion in front of the surface Cold Front is still present, but is now quite weak. Behind the Cold Front, especially in the area of the Back Bent Occlusion, west of 3 degrees East, ascending motion is also present.
|
27 October 2002/12.00 UTC - Radiosonde Brussels
|
|
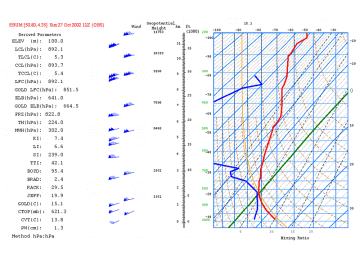
This sounding diagram from the radio sonde station EBUM in Belgium (Brussels) shows dry air already down to a level of 800 hPa. This is 100 hPa lower in the atmosphere than at 00.00 UTC. Wind gusts at lower levels are remarkably high.
Weather events
|
27 October 2002/12.00 UTC - Meteosat WV image; blue: thermal front parameter (TFP) 500/850 hPa, blue: weather events, white: wind
gusts > 55 kts 11.00 - 12.00 UTC
|
|
| Parameter | Description |
| Precipitation | The surface Cold Front lies over the western part of Germany towards France. To the rear of the front embedded showers are present in lines along the eastern border of the Netherlands via Belgium towards France. |
| Wind (incl. gusts) | Very strong gusts in the line showers to the rear of the Cold Front but also in the curled Occlusion along the Dutch coast the southern North Sea and the east coast of England. |
27 October 2002/18.00 UTC
|
27 October 2002/18.00 UTC - Meteosat IR image; blue: thermal front parameter (TFP) 500/850 hPa, black: zero line of shear vorticity 300
hPa
|
|
The frontal system continues to decay. The Cold Front is now situated from Poland to the North of Spain. The northern part of the thermal front parameter can be found in the frontal cloud band, whilst in the southern part of the cloud band, it is not detectable anymore. The zero line of shear vorticity crosses the cloud band at a sharp angle. So, the Cold Front is still a Kata type.
|
27 October 2002/18.00 UTC - Meteosat WV image; magenta: height of 2 units potential vorticity, position of vetical cross section
indicated
|
|
The Dark Stripe is a bit smaller, but there now appears another dark area behind a small stripe of higher humidity. The gradient zone of the height of the level of PV = 2 PVU lies above and to the front of the Dark Stripe. The lowest level of the tropopause is 4500m.
|
27 October 2002/18.00 UTC - Vertical cross section; black: isentropes (ThetaW), magenta: potential vorticity, blue: relative humidity,
yellow: WV pixel values
|
|
In the vertical cross section above the ThetaW pattern is that of a Kata Front. The ThetaW lines indicate a Cold Front, exactly at the position of high humidity between the two dry areas. The position of the surface Cold Front in the vertical cross section contradicts the position of the thermal front parameter, which is situated above the eastern dry area. The reason is that the thermal front parameter is calculated in the layer from 850 to 500 hPa. At the left side of the vertical cross section the Occlusion can be seen.
The PV-anomaly decreases: the 2 PVU value is now at a level higher than 450 hPa. Also, the dry air is no longer to be found at extremely low levels. The position of the dry air is the same as the position of the dark pixel values of the water vapour image.
|
27 October 2002/12.00 UTC - Vertical cross section; black: isentropes (ThetaW), magenta: potential vorticity, blue: vertical motion
(omega) - upward motion, yellow: WV pixel values
|
|
In the vertical cross section above the rising motion is situated in front of the surface Cold Front and at the position of the Occlusion. At low levels the air is rising due to orography.
|
27 October 2002/18.00 UTC - Radiosonde Prague
|
|
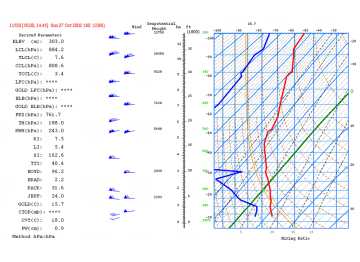
This is the sounding of Prague (station 11520). The air is still very dry and the wind speeds in the whole depth of the troposphere are very high.
|
27 October 2002/18.00 UTC - Meteosat WV image; blue: thermal front parameter (TFP) 500/850 hPa, blue: weather events, white: wind
gusts > 55 kts 17.00 - 18.00 UTC
|
|
| Parameter | Description |
| Precipitation | There is no precipitation reported in the region of the Dark Stripe. To the rear of the thermal front parameter a lot of showers can be seen. Also the curled Occlusion is producing substantial amounts of rain. |
| Wind (incl. gusts) | Very strong wind gusts are reported in the whole area around the Dark Stripe and the Occlusion. |
Analysis of 28 October 2002
28 October 2002/00.00 UTC
|
28 October 2002/00.00 UTC - Meteosat IR image; blue: thermal front parameter (TFP) 500/850 hPa, black: zero line of shear vorticity 300
hPa
|
|
The depression is filling up and the pressure in the centre of the low is 980 hPa, with the centre itself located above the Baltic Sea. Less structure is seen within the frontal cloudiness when compared to six hours earlier. The Cold Front is situated in an area stretching from the Baltic States via Hungary to Switzerland.
The thermal front parameter shows the existence of a Cold Front ahead of the frontal cloudiness. The zero line of shear vorticity now makes a sharper angle with the front. The front is still a Kata type.
|
28 October 2002/00.00 UTC - Meteosat WV image; magenta: height of 2 units potential vorticity, position of vetical cross section
indicated
|
|
On 28 October at 00.00 UTC the Dark Stripe is only a thin black line, located directly behind the Cold Front. The height field of the tropopause shows a strong gradient from 10000 meters to 4500 meters. The gradient is now ahead of the Dark Stripe, in the more humid area.
|
28 October 2002/00.00 UTC - Vertical cross section; black: isentropes (ThetaW), magenta: potential vorticity, blue: relative humidity,
yellow: WV pixel values
|
|
The vertical cross section above shows a Kata Cold Front. The potential vorticity has not changed very much when compared to 6 hours earlier. The very dry air no longer reaches so far down into the atmosphere.
|
28 October 2002/00.00 UTC - Vertical cross section; black: isentropes (ThetaW), magenta: potential vorticity, blue: vertical motion
(omega) - upward motion, yellow: WV pixel values
|
|
In the vertical cross section above rising motion can be seen nearly everywhere, except for the surface Cold Front where the air is descending.
Weather events
|
28 October 2002/00.00 UTC - Meteosat WV image; blue: thermal front parameter (TFP) 500/850 hPa, blue: weather events, white: wind gusts
> 55 kts 23.00 - 00.00 UTC
|
|
| Parameter | Description |
| Precipitation | The satellite image shows a convective structure of the cloudiness to the rear of the Cold Front. Some observations of rain in this area. |
| Wind (incl. gusts) | Very strong gusts are reported at several locations in the neighbourhood of the Dark Stripe, to the rear of the front in Slovakia and Austria, as well as near the curled Occlusion over the Czech republic and southern Germany. |
Summary
This case study describes the evolution of a Water Vapour Dark Stripe associated with a Cold Front over the period October 27 to 28 2002. Initially, an Ana Cold Front can be seen, but by 12.00 UTC, the entire Cold Front has changed into a Kata front. The Dark Stripe develops and the potential vorticity descends to around 600 hPa by October 27th at 12.00 UTC. The atmosphere is potentially unstable up to 800 hPa.
During the period of the case study strong to very strong wind gusts were observed in the transition zones from light to dark in the water vapour images. In these zones high wind speeds were present, not only near the tropopause but also in the lower troposphere. In these areas potential vorticity anomalies penetrated deep down into the atmosphere in a potentially unstable environment. In the lower layers of the atmosphere a strong exchange of vertical momentum took place, resulting in strong, gusty winds at the surface. The strongest gusts were observed in the cold air near the gradient zones of the Cold Front and the Occlusion.
