Mesoscale Convective System
|
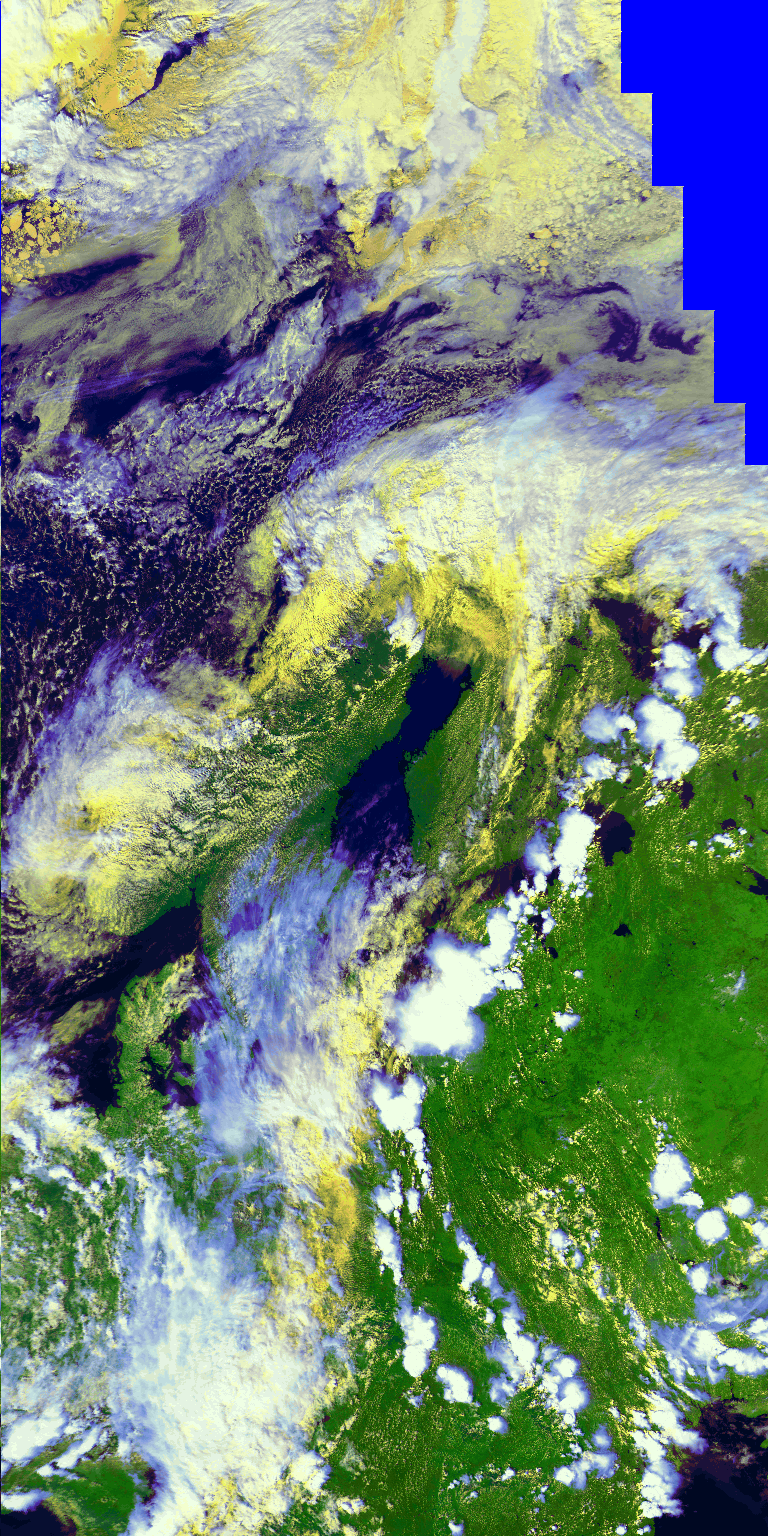
11 June 1998/15.17 UTC - NOAA RGB image (channels 1, 2 and 4)
|
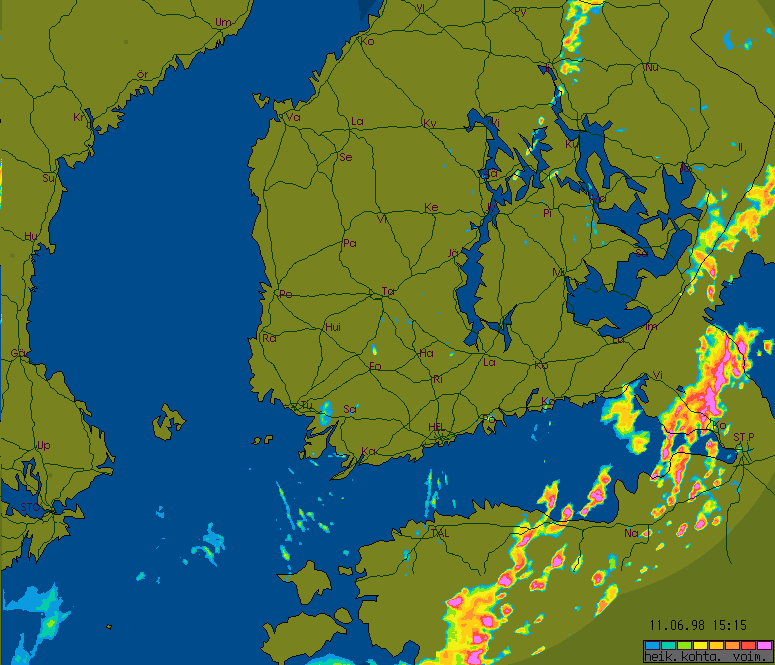
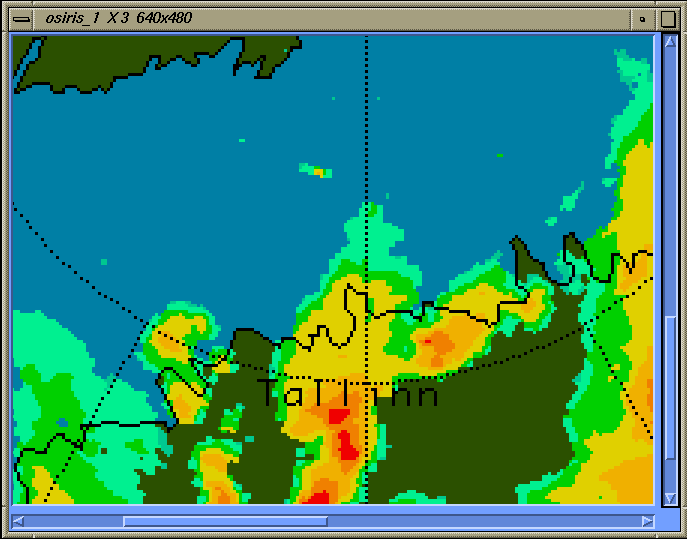
11 June 1998/15.17 UTC - FMI Radar image; CAPPI
|
|
|
NOAA 15.17 shows a line of isolated strong Cumulonimbus cells southeast of Finland.
More details of the cells can be seen in Radar CAPPI composite.
|
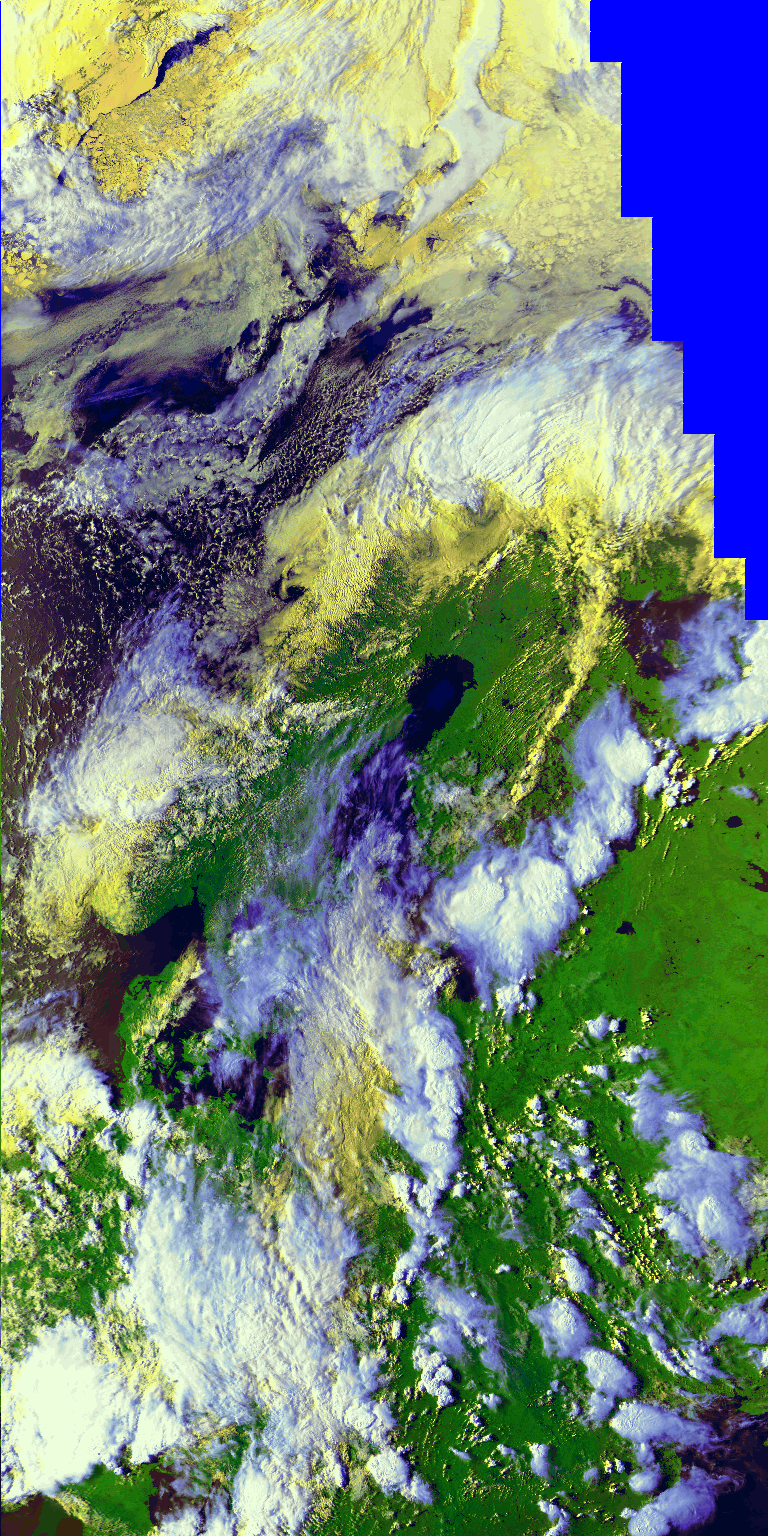
11 June 1998/18.50 UTC - NOAA RGB image (channels 1, 2 and 4)
|
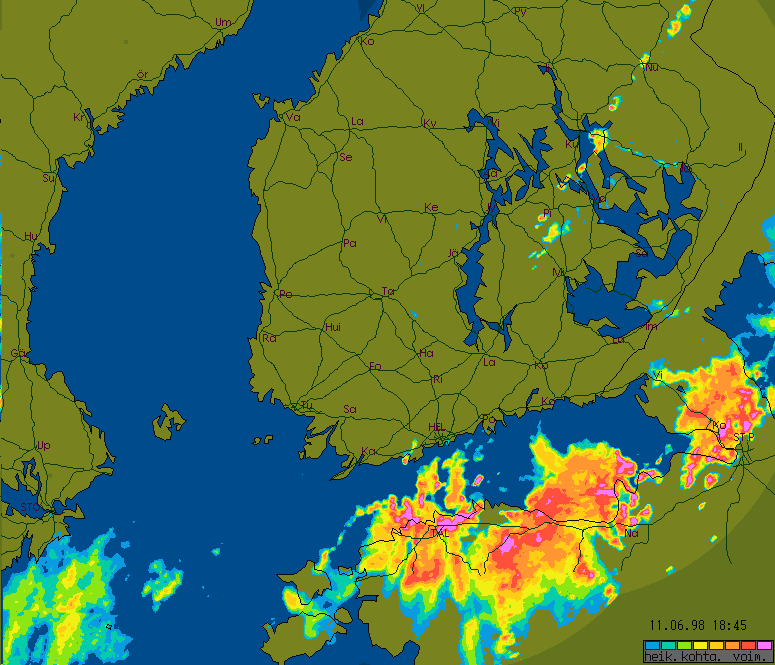
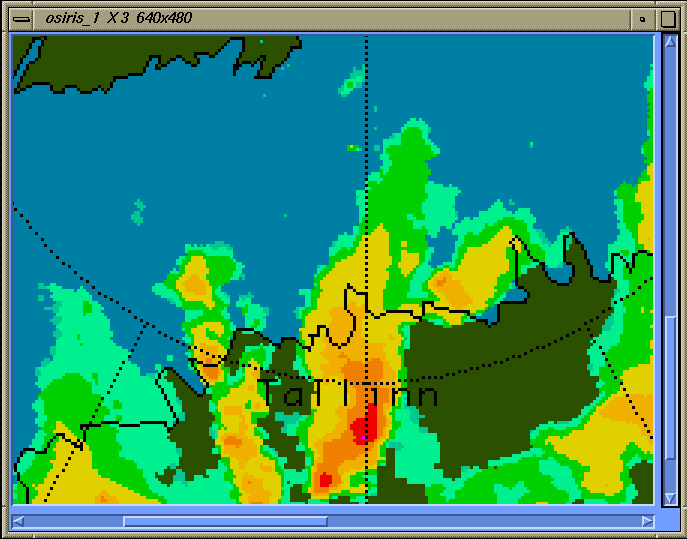
11 June 1998/18.50 UTC - FMI Radar image; CAPPI
|
|
|
|
|
|
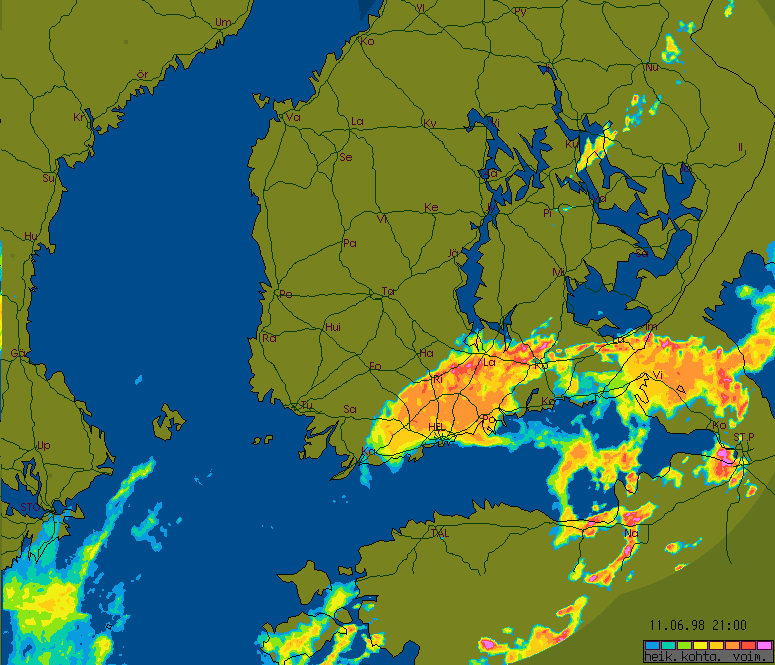
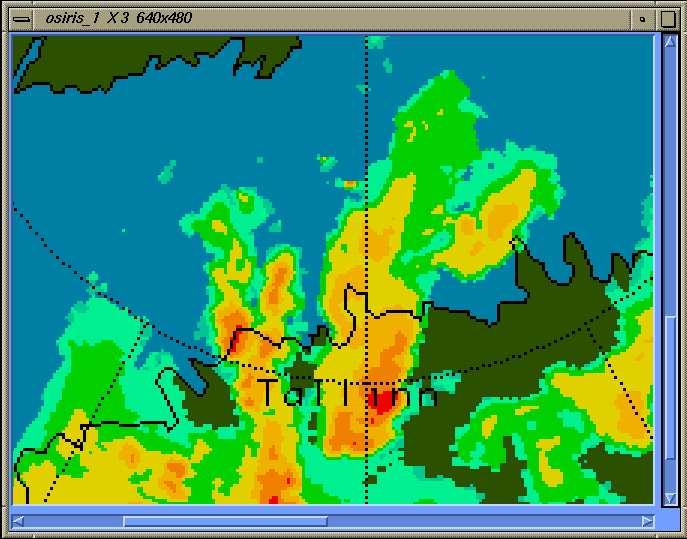
11 June 1998/21.00 UTC - FMI Radar image; CAPPI
|
|
NOAA 18.50 shows how the anvils have grown to a homogenous cloud mass.
The active embedded Cb-cores can still be identified in the Radar image at 18.50 UTC.
RADAR at 21.00 UTC shows the later phase of the developement (no simultaneous NOAA available)
|
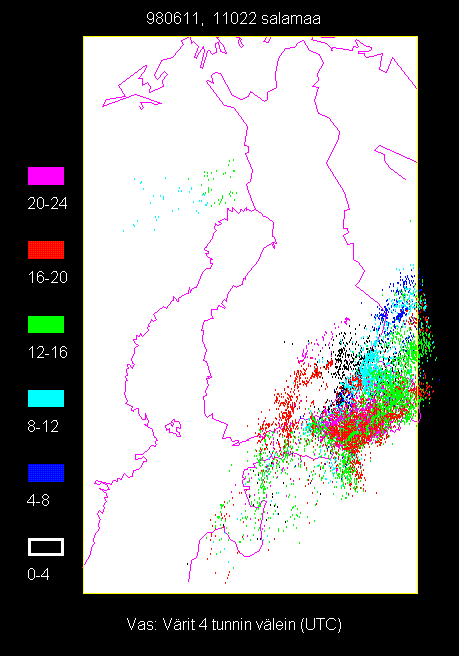
11 June 1998 - Lightning reports
|
|
|
Lightning locator has indentified 11022 lightnings during the day (colours show 4 hour intervals in UTC)
|
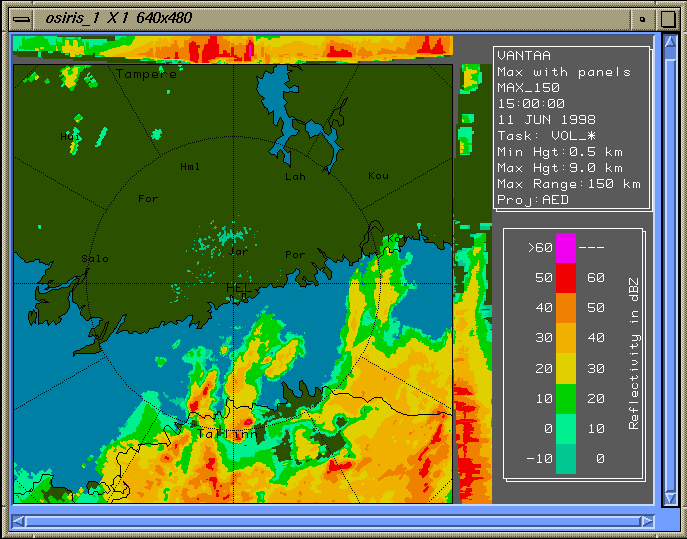
11 June 1998/15.00 UTC - FMI Radar image; MAX
|
11 June 1998/15.00 UTC - FMI Radar image; MAX
|
|
|
MAX from Vantaa radar 15.00 UTC (left image). Side panels give vertical summaries between 0.5 and 9 kilometres.
Zooming down to a cell near Tallinn shows an intense core of over 60 dBZ (purple) (right image). Such high intensities are almost always
related to wet hail inside the cumulonimbus, even though the hail may melt before it reaches ground.
|
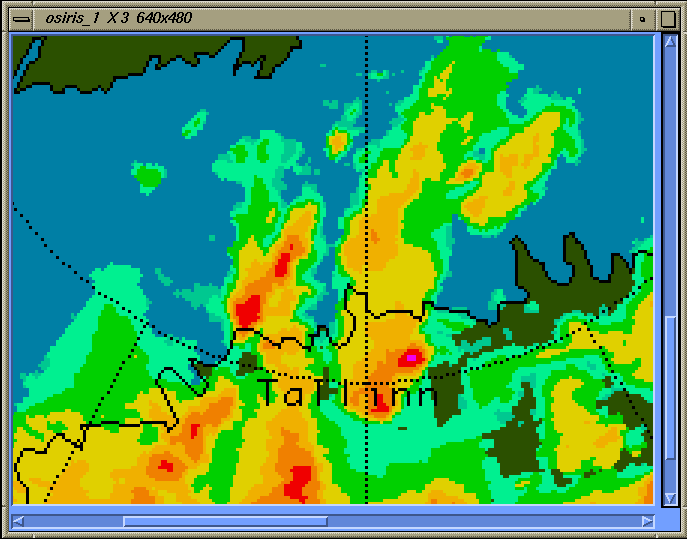
11 June 1998/14.15 UTC - FMI Radar image; MAX
|
11 June 1998/14.30 UTC - FMI Radar image; MAX
|
|
|
|
|
|
11 June 1998/14.45 UTC - FMI Radar image; MAX
|
|
Images taken every 15 min (14.15, 14.30 and 14.45 UTC) show the rapid movement and intensification of the cell. A thunderstorm was reported at Tallin airport at the same time.