Synoptic environment
Mainly during winter time, the North Atlantic area between Newfoundland and the British Isles is constantly affected by strong winds associated with deep and long-lived depressions.
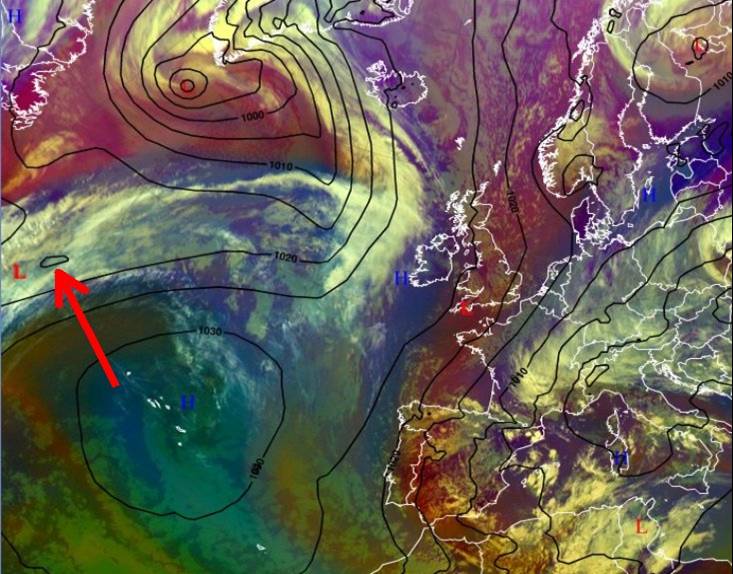
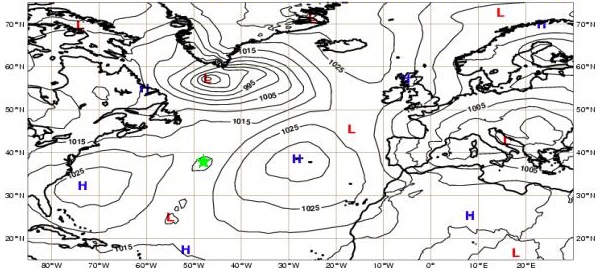
The swell that developed south of Iceland between 16 and 17 April was therefore the result of a steady and strong southwesterly (and, later, northwesterly) flow at the surface, which was initiated on 14 April 2012. Several weak and continuous surface perturbations associated with upper level disturbances generated cyclones east of Newfoundland, which then moved towards Iceland and the British Isles. Over the Azores, a blocking high prevented the cyclones from heading that way. The block persisted in the sub-tropical latitudes of the North Atlantic Basin for over a week. Despite the continuous cyclogenesis over this period, one frontal wave played a particularly important role. At 00:00 UTC on 15 April, this shallow surface low was centered on 39ºN, -48ºE, halfway between the Azores and Newfoundland (Fig. 4).
Fig.4. Mean sea level pressure prognosis (hPa) from the ECMWF model for 15/04/2012 - 00:00 UTC (the red arrow identifies the surface low). MSG Airmass RGB at 12:00 UTC on 15/04/2012.
In the following days, the surface low propagated northeast and deepened significantly. It underwent explosive development between 12:00 UTC on 15 April and 12:00 UTC on 17 April. According to ECMWF´s mean sea level pressure (MSLP) analysis the minimum pressure in the center of the low was 965 hPa at 06:00 UTC on 17 April, with the highest drop of 42 hPa occurring between 00:00 UTC on 16 April and 00:00 UTC on 17 April.
Until late 16 April, the already intense southwesterly flow dominated over the region between the north Azores and Ireland. However, in the following day the low approached higher latitudes and merged with another deep depression which was situated south of Iceland, generating a zonal flow. The northern low was eventually absorbed, yielding a complex low-pressure system (Fig. 5).
Fig.5. MSLP prognosis (hPa) from the ECMWF model for 17/04/2012 - 00:00 UTC. MSG Airmass RGB at 00:00 UTC on 17/04/2012.
Over the course of 17 April, the low slowly started to fill, although it still was a very deep low. Between 18:00 UTC on 17 April and 18:00 UTC on 20 April it was almost stationary over the British Isles, maintaining a steady northwesterly flow during this period over western Europe (Fig. 6).
Fig.6. Animation of MSLP field analysis (hPa) between 00:00 UTC on 15/04/2012 and 00:00 UTC on 20/04/2012 (* click on the image to start animation). The green stars and arrows represent, respectively the approximate low centre and the path from the ECMWF's MSLP 00:00 UTC analysis.
Fig. 7 reports an ASCAT overpass in our region of interest and gives wind speed in the southwest quadrant of the low, which was the most important one for the storm. The image shows a fraction of 2 ASCAT swaths acquired on late 16 April (21:00 – 21:30 UTC and 23:00 – 23:30 UTC). This data reveals gale winds (30 kt) over a large area and up to 45 kt in a small region. High wind speeds were also registered from drift buoys and ships along the depression’s track.
Fig.7. ASCAT wind (color wind barbs) between 21:00 UTC and 23:30 UTC on 16/04/2012. MSG Airmass RGB at 00:00 UTC on 17/04/2012. The black rectangle represents the zoom area (*click on the image to see it).


