PV ANOMALIES - EXAMPLE
In this example you can follow the process of cyclogenesis and the changes of PV in the cross sections. On the left-hand side you can see water vapour (WV) satellite images for 05 August 2005, 06, 09 and 12 UTC and on the right-hand side the cross-sections of PV along the marked lines. Observe how the anomaly changes in time and moves in space!
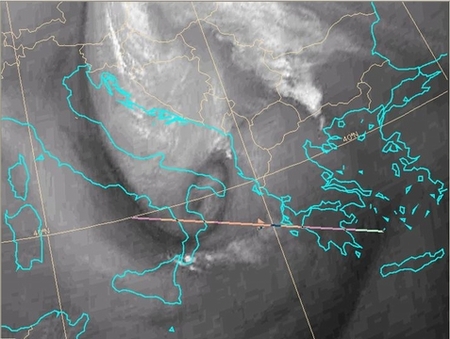
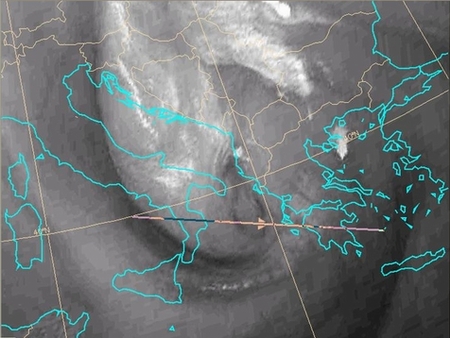
05 August 2005, 06 UTC |
Dark feature in the WV image indicates folding of the tropopause
or the intrusion of dry stratospheric air into the troposphere.
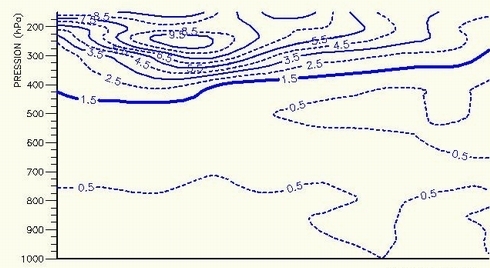
The PV cross-section along the marked line looks like:
It clearly shows that the isoline of PV of 1.5 PVU is lowered down to 450 hPa in the left end of the cross-section, coinciding with the dark area in the satellite image. |
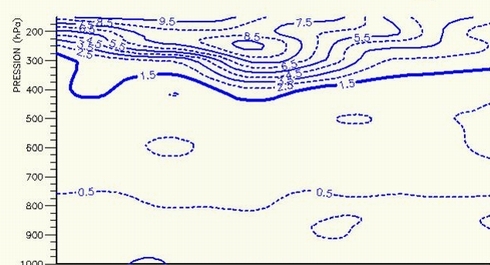
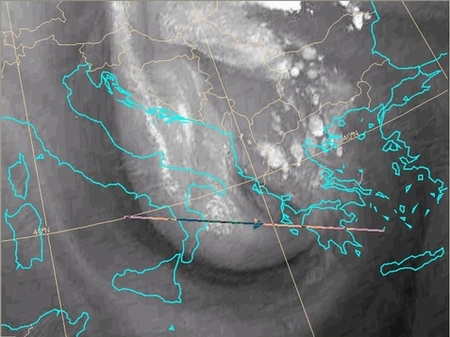
05 August 2005, 09 UTC |
3 hours later the anomaly from the previous image has moved towards east, whereas a new anomaly seems to develop on the right end of the cross-section, again correlated to
the dark stripe in the WV image. The cross section along the marked line looks like:
The right anomaly is the one connected to the cyclogenesis taking place. |
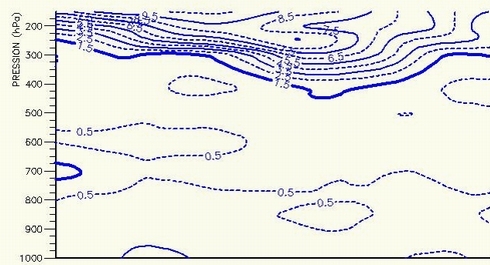
05 August 2005, 12 UTC |
At 12 UTC the cross-section looks like this:
The anomaly moves further to the east. The tropopause is still lowered down to 450 hPa. |