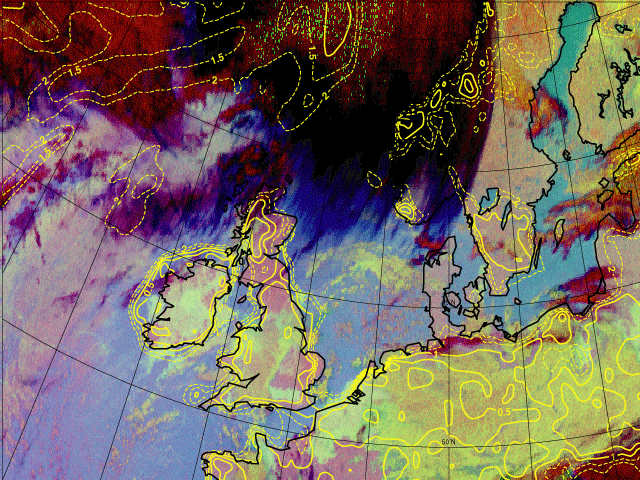

19 Dec 2006/00 UTC
Meteosat 8 Night Microphysical RGB; 2-metre Temperature and Dewpoint Temperature Difference (yellow solid: difference less than 1 degree, yellow dashed: difference 1-2 degrees).
It is obvious that air is very close to saturation during the episode in the UK. With closer inspection some drier moments can be detected, ie on 21 Dec 12 UTC on the southernmost parts of England. It gives a good impression on where the likelihood of fog is high. However, it should not be used in too much detail.
19 Dec 2006/12 UTC
Meteosat 8 HRV+HRV+IR10.8 RGB; 2-metre Temperature and Dewpoint Temperature Difference (yellow solid: difference less than 1 degree, yellow dashed: difference 1-2 degrees).
It is obvious that air is very close to saturation during the episode in the UK. With closer inspection some drier moments can be detected, ie on 21 Dec 12 UTC on the southernmost parts of England. It gives a good impression on where the likelihood of fog is high. However, it should not be used in too much detail.
20 Dec 2006/00 UTC
Meteosat 8 Night Microphysical RGB; 2-metre Temperature and Dewpoint Temperature Difference (yellow solid: difference less than 1 degree, yellow dashed: difference 1-2 degrees).
It is obvious that air is very close to saturation during the episode in the UK. With closer inspection some drier moments can be detected, ie on 21 Dec 12 UTC on the southernmost parts of England. It gives a good impression on where the likelihood of fog is high. However, it should not be used in too much detail.
20 Dec 2006/12 UTC
Meteosat 8 HRV+HRV+IR10.8 RGB; 2-metre Temperature and Dewpoint Temperature Difference (yellow solid: difference less than 1 degree, yellow dashed: difference 1-2 degrees).
It is obvious that air is very close to saturation during the episode in the UK. With closer inspection some drier moments can be detected, ie on 21 Dec 12 UTC on the southernmost parts of England. It gives a good impression on where the likelihood of fog is high. However, it should not be used in too much detail.
21 Dec 2006/00 UTC
Meteosat 8 Night Microphysical RGB; 2-metre Temperature and Dewpoint Temperature Difference (yellow solid: difference less than 1 degree, syellow dashed: difference 1-2 degrees).
It is obvious that air is very close to saturation during the episode in the UK. With closer inspection some drier moments can be detected, ie on 21 Dec 12 UTC on the southernmost parts of England. It gives a good impression on where the likelihood of fog is high. However, it should not be used in too much detail.
21 Dec 2006/12 UTC
Meteosat 8 HRV+HRV+IR10.8 RGB; 2-metre Temperature and Dewpoint Temperature Difference (yellow solid: difference less than 1 degree, yellow dashed: difference 1-2 degrees).
It is obvious that air is very close to saturation during the episode in the UK. With closer inspection some drier moments can be detected, ie on 21 Dec 12 UTC on the southernmost parts of England. It gives a good impression on where the likelihood of fog is high. However, it should not be used in too much detail.
22 Dec 2006/00 UTC
Meteosat 8 Night Microphysical RGB; 2-metre Temperature and Dewpoint Temperature Difference (yellow solid: difference less than 1 degree, yellow dashed: difference 1-2 degrees).
It is obvious that air is very close to saturation during the episode in the UK. With closer inspection some drier moments can be detected, ie on 21 Dec 12 UTC on the southernmost parts of England. It gives a good impression on where the likelihood of fog is high. However, it should not be used in too much detail.
22 Dec 2006/12 UTC
Meteosat 8 HRV+HRV+IR10.8 RGB; 2-metre Temperature and Dewpoint Temperature Difference (yellow solid: difference less than 1 degree, yellow dashed: difference 1-2 degrees).
It is obvious that air is very close to saturation during the episode in the UK. With closer inspection some drier moments can be detected, ie on 21 Dec 12 UTC on the southernmost parts of England. It gives a good impression on where the likelihood of fog is high. However, it should not be used in too much detail.
23 Dec 2006/00 UTC
Meteosat 8 Night Microphysical RGB; 2-metre Temperature and Dewpoint Temperature Difference (yellow solid: difference less than 1 degree, yellow dashed: difference 1-2 degrees).
It is obvious that air is very close to saturation during the episode in the UK. With closer inspection some drier moments can be detected, ie on 21 Dec 12 UTC on the southernmost parts of England. It gives a good impression on where the likelihood of fog is high. However, it should not be used in too much detail.
23 Dec 2006/12 UTC
Meteosat 8 HRV+HRV+IR10.8 RGB; 2-metre Temperature and Dewpoint Temperature Difference (yellow solid: difference less than 1 degree, yellow dashed: difference 1-2 degrees).
It is obvious that air is very close to saturation during the episode in the UK. With closer inspection some drier moments can be detected, ie on 21 Dec 12 UTC on the southernmost parts of England. It gives a good impression on where the likelihood of fog is high. However, it should not be used in too much detail.