Xynthia as a bomb
Around 22 UTC on the 26th, ASCAT passed once more over Xynthia, while pressure in the centre was dropping intensively. With a pressure decrease in the last 24 hours of 14 hPa at 18:00 UTC on the 26th and 18 hPa at 00:00 UTC on the 27th (ECMWF analysis), Xynthia could, at this stage, be classified as an explosive cyclogenesis, or bomb (Figure 2.4.1).
From the point of view of ASCAT, this was an interesting pass for two main reasons:
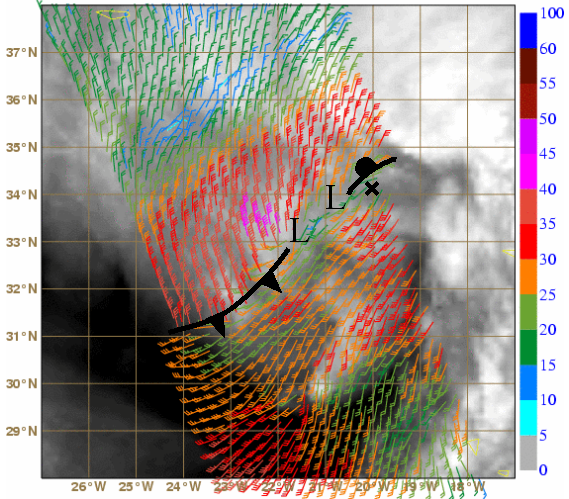
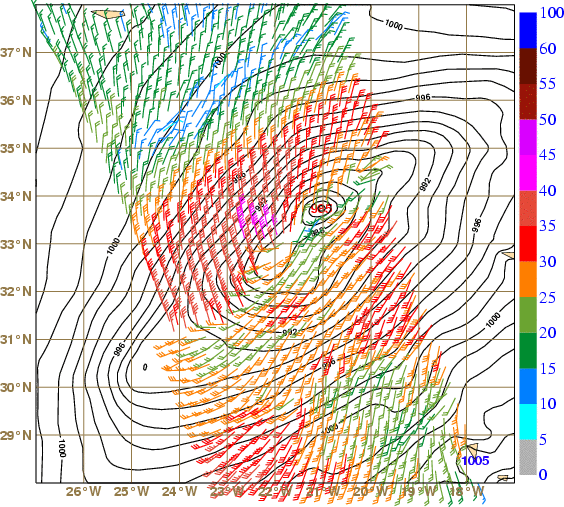
i) ASCAT clearly showed a well defined boundary between southwesterly and northwesterly winds, in the leftmost part of the swath, suggesting a cold front wind pattern at the surface (as plotted in Figure 2.4.2, left). Nearer to the centre of the swath, opposite winds (northeasterly and southwesterly) could be found along an axis from 33°N 22°W to 34.5°N 20°W, suggesting the existence of more than one low. Finally, in the rightmost part of the swath, the wind pattern fit to the existence of a warm front. In general, the north side of the storm presented higher wind speeds (in the range 40-42.5 kt) than the south side where winds did not exceed 35 kt. ASCAT thus suggested that Xynthia was still a complex low at the surface (see two possible lows in Figure 2.4.2, left).
Using only buoy observations in the area, the minimum pressure at 22:00 UTC would be located near 34°N 20°W, on the right edge of the ASCAT swath, with an estimated value of 984 hPa (see black cross in Figure 2.4.2, left).
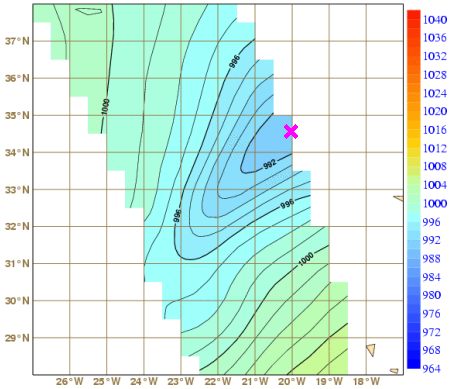
A minimum of 991.1 hPa could be found at 34.5°N 20°W from the UWPBL derived surface pressure (Figure 2.4.2, right), which puts it half a degree to the north of the "buoy estimate". However, this represented an overestimation of around 7 hPa, which would be consistent with an underestimation of the wind speed by ASCAT.
In the attempt to determine the centre, the "buoy estimate" and the "ASCAT estimates" (from both wind and surface pressure patterns) were not a perfect fit. However, there were clear benefits to using ASCAT patterns of both wind and surface pressure. Regarding wind speed and minimum pressure values, data from both buoy and ship were still used for "real-time tuning".
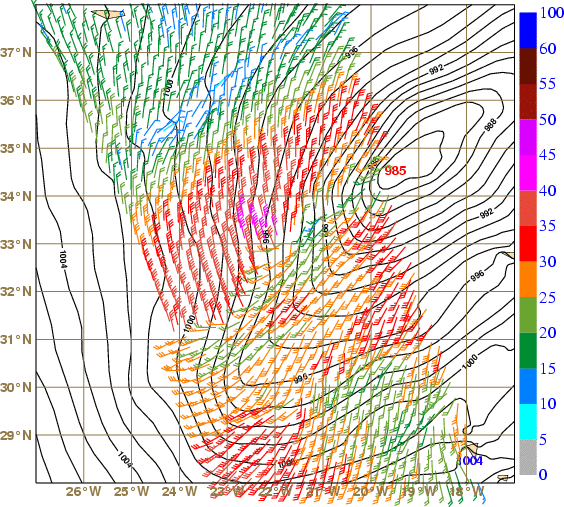
ii) the instant of the ASCAT pass differed from both the ECMWF model analysis and forecast times - by around 110 and 70 minutes, respectively (Figure 2.4.3). This was not negligible at this phase as the storm was still moving very fast northeastwards (averaging around 40 kt (!) between 18:00 and 00:00 UTC). In this case, a mismatch in the overlay of forecast and ASCAT winds (speed and/or direction) cannot be taken too seriously, because with such a velocity, differences of up to around 1.5 degrees in longitude could be expected even if forecast and ASCAT were exact matches (not to mention changes related to the pressure drop). However, the 9-h forecast indicates a secondary low to the southwest of the main low, in accordance with ASCAT. This feature was not captured by the following ECMWF analysis (on the 27th at 00:00 UTC), but as mentioned this analysis was almost 2 hours after the ASCAT pass.
In this period, Airmass RGB images made it possible to distinguish some cold air patches (in darker blue) among clouds and stratospheric air intrusions near the low centre (Figure 2.4.4). Several cloud layers with their corresponding movements are also plotted in Figure 2.4.4, as suggested by the sequence of images between 18:00 and 21:00 UTC (Figure 2.4.5).
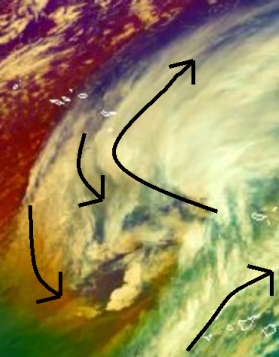
Figure 2.4.5 - MSG Airmass RGB between 18:00 and 21:00 on 26/02/2010. Click the image to enlarge and start the animation.
Xynthia passed northwest of the Madeira Islands overnight as a deep storm. Surface observations from the Madeira archipelago recorded high wind gusts, reaching 145 km/h (78.4 kt) at the mountain station of Areeiro (1590m) at 23:30 UTC on 26th, and an hourly precipitation maximum of 15.6 mm between 03:00 and 04:00 UTC on the 27th (and 56.2 mm in 6 hours, between 00:00 and 06:00 UTC). However, these precipitation amounts are not totally unusual in the mountains of Madeira, and therefore not as high as one might expect, taking into consideration the air mass involved, the direction of flow and the topography of the main island. In a way, Xynhtia was starting to reveal itself to be more a wind storm rather than a precipitation storm.
ECMWF analysis suggested 985 hPa at 34°N 19°W at 00:00 UTC on the 27th (Figure 2.4.6) and a drift buoy reported 986 hPa around 37°N 16°W which suggests another minimum further northeast. The model outputs show Xynthia with well defined frontal characteristics (note how the Thermal Front Parameter exceeds the colour-coded scale in Figure 2.4.6) related to strong temperature advections both on the warm and cold sides. The frontal patterns from the model analysis do not disagree with the subjetive analysis based exclusively on ASCAT winds (Figure 2.4.2).