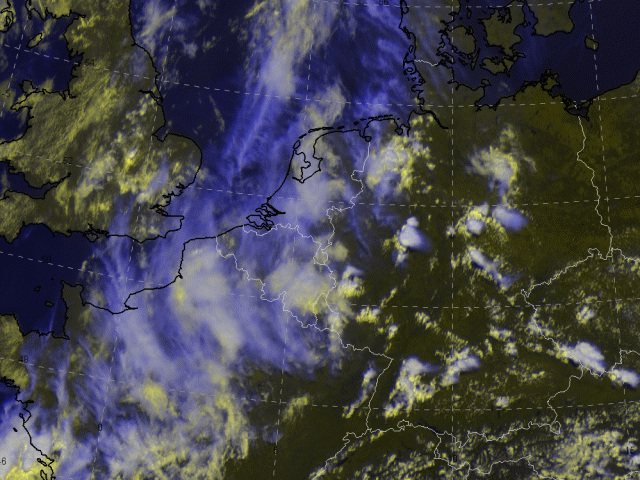
Interactive overlays: 27 July 2006, 12 UTC


On 27 July several convective cells developed over Germany. The cloud top temperatures gave clear hints to hail. Till afternoon a squall line formed. Heavy rain of up to 30 mm/h and gusts up to Beaufort 10 were registered.
This image shows the composite of (HRV/HRV/IR10.8) First convective cells developed over many parts of Germany.
Please klick upon the "i-button" for getting the information about the different overlays.
A dark stripe in the WV image can be observed over central Germany. This is due to descending stratospheric air (equivalent to higher values of PV in thisa case study).
At 12 UTC the initial growth of the main convective cells takes place. According to the conceptual model "Enhancement of convection by PV" first convective cells developed at the leading edge of the dark stripes. The cells west of the dark area are in accordance with the conceptual model "Convective cloud features at the leading edge of frontal cloud bands".
The geopotential height in 300 hPa reveals a well-pronounced upper air trough over western Europe. A ridge is situated over Germany. This region was influenced by potential unstable subtropical air. Due to upward motion in the forefield of a trough convection was initiated.
We clearly see that temperature advection in 700 hPa is a rather useless parameter for diagnosing summer convection. Better are cross sections or radiosoundings because during summer convection situations warm air advection often happens below 700 hPa and cold air advection above. A combined investigation of temperature advection both in lower and upper parts deliver important hints to potential tendencies of instability.
The precipitable water considered here is the integral from surface to 400 hPa of the mixing ratio of water vapour to the mass of dry air.
The image of precipitable water (in mm) reflects the large scale airmass contrast which we have already seen in the Airmass RGB images. There is a clear gradient of decreasing values from Southwest to Northeast.
This reflects the transition from subtropical and humid air that has already reached the western parts of Germany and dry and very warm air farer to the East. Values of partly more than 35 mm are an indication for heavy precipitation.
At this time two small convective cells can be seen that show cloud top temperatures (CTT) of already -56 to -60°C equivalent to a risk of hail.
Thermal front parameter (blue) and equivalent thickness (green) are shown here.
The cold front associated with the cloud band extending from southern Norway over western France to the Spanish coast is superimposed by maximum values of the thermal front parameter.
The convective development over Germany takes place near the zone of surface convergences where the model shows a relative maximum for the thermal front parameter.
A weak pronounced thickness ridge is found over central Europe.
Wind barbs are shown here and convergence zone can be identified.
The colours represent classes of measured reflectances in dBz (see legend).
Radar images are essential in diagnosing the strength of CB clusters in terms of precipitation amount and type (snow, sleet, hail). During summer only hail is relevant. A rough estimation for central Europe is that hail is possible for more than 56 dbZ (blue coloured radar pixels). According to conceptual models the intensity of gusts can be estimated. The so-called PI product (international radar composite) represents reflectivities in about 2 km with a horizontal resolution of 4 km.
Compare with IR10.8-Enhanced image.
The pressure tendencies refer to the last 3 hours and are displayed in units hPa/10. From 9 UTC till 12 UTC negative pressure tendencies are found over most parts of Germany, typically in the forefield of a convergence line. West of this convergence we find rising surface pressure. This 'dipole structure' is a hint for the onset or an intensifying direct thermal circulation, which leads rather often to a squall line (see surface analysis 12 UTC).
Gusts during the last hour (knots) are given here. Only stations in Germany are shown. We would expect measurements of high speed because uprooted trees and damaged houses were reported in the media. The image shows only gusts between beaufort 4 and 6. Only over northwestern Germany and the Harz (not shown here) gusts of 29 and 33 knots (Beaufort 7) were measured, respectively.
Observations of total cloudiness and significant weather are shown here. At 12 UTC, thunderstorms are already reported over western and central Germany which corresponds to convective cells in the IR image.