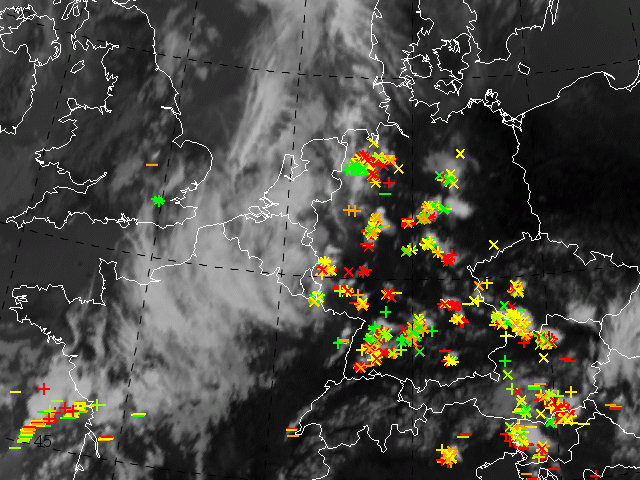

This chapter presents the lightning detection during the last 30 min. The colours give the time interval in which the lightning occured (see legend).
By clicking through the time steps the movement, development and dynamics of the thunderstorms can be observed.
Compare also with the radar data presented in the next chapter.
We will investigate the position of the lightning detection in relation to the clouds in the IR image. First convective cells and recent lightning detection can be seen. When we investigate some details we find the following reasons for the combination of satellite images and lightning detection: