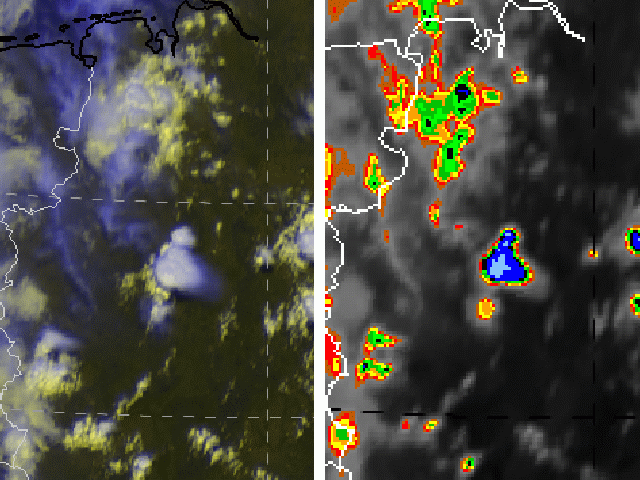


This chapter presents a visual comparison between the high resolution (HRV) RGB (left) and the IR10.8 Enhanced (IRE) image (right).
Two problems for detecting highly active convective zones (indicated by overshooting tops and very low cloud top temperatures) will be discussed in these images:
For interpretation of colours in the IR Enhanced image klick upon the key-symbol, see above.
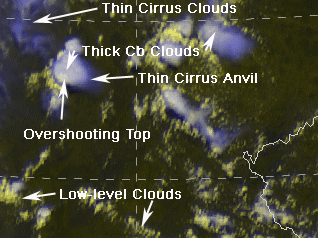
The colours of the clouds in the HRV; HRV; 10.8 RGB can be interpreted as:
The image below points out the various cloud features seen in the images.
