Synoptic situation
Synoptic analysis shows a deep upper-level trough stretching from western Scandinavia to the southern France with the secondary trough located in the Mid-Mediterranean. In the evening of 24 September, a well developed cyclone moved eastwards over the Tyrrhenian Sea.
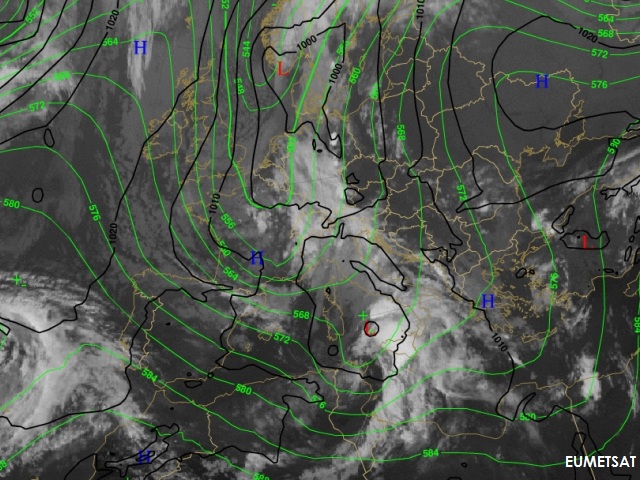
Figure 2.1: METEOSAT 9 IR image for 24 September 2010, 18 UTC overlaid with ECMWF forecast Height contours of 500hPa (green) and MSLP (black)
Bright white area in the Airmass RGB shows the convective clouds connected with the fully developed southern cyclone. On the other hand, the intrusion of dry stratospheric air over the North Sea and France, connected also to high values of potential vorticity over the Alps can be recognized by its reddish colour. The 300 an 500hPa positive vorticity advection (PVA) maxima trigger and maintain strong convection in the unstable air over the western Alps and the Mid Mediterranean.
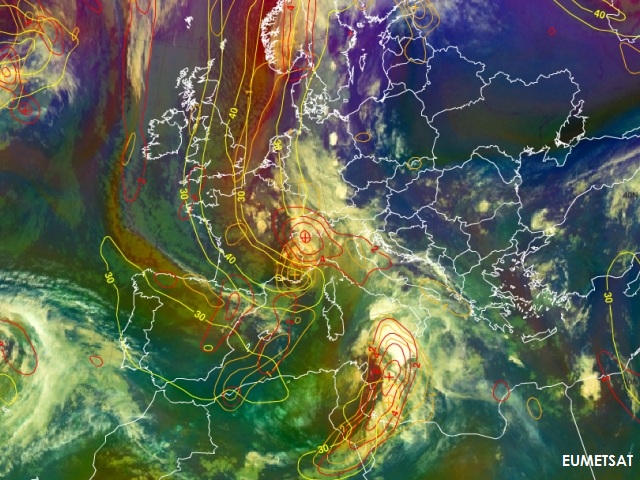
Figure 2.2: METEOSAT 9 Airmass RGB image for 24 September 2010, 18 UTC overlaid with ECMWF forecast PVA at 500 hPa (orange), PVA at 300 hPa (red) and isotachs at 300 hPa (yellow)
The dipole of cold air advection (blue lines) and warm air advection (red lines) in the Mid-Mediterranean is also a sign of the ongoing cyclogenesis.
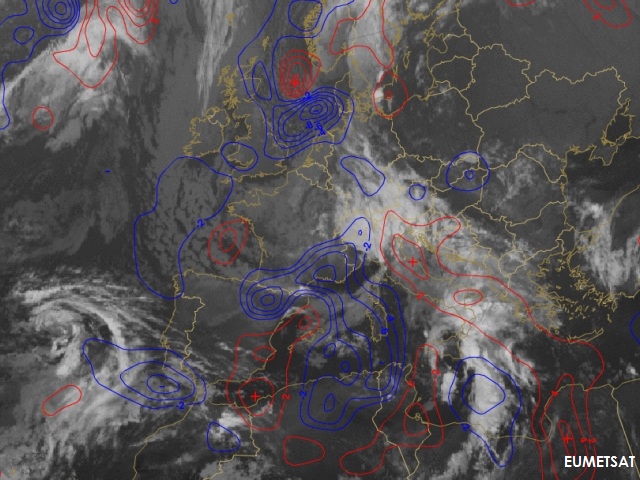
Figure 2.3: METEOSAT 9 IR image for 25 September 2010, 00 UTC overlaid with TA at 500hPa (blue for negative and red for positive)
Dark red areas in the Night Microphysical RBG for 00 UTC 25 September 2010 show deep frontal clouds connected to already fully developed twin-cyclones in Genoa Bay and Tyrrhenian Sea.
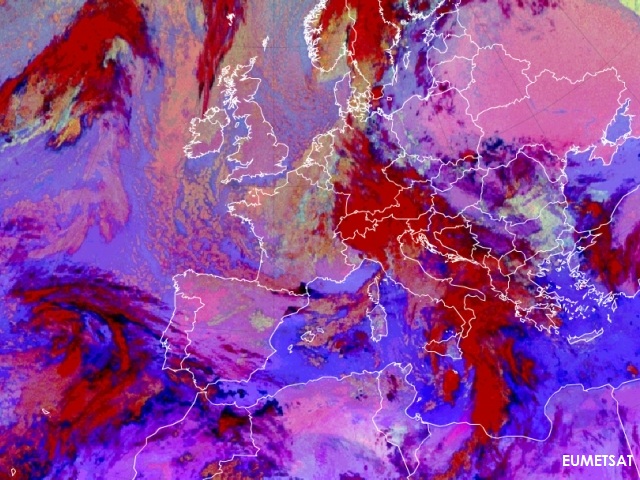
Figure 2.4: METEOSAT 9 Night Microphysical RGB image for 25 September 2010
Placing of the two cyclones is well depicted in the surface analysis chart.
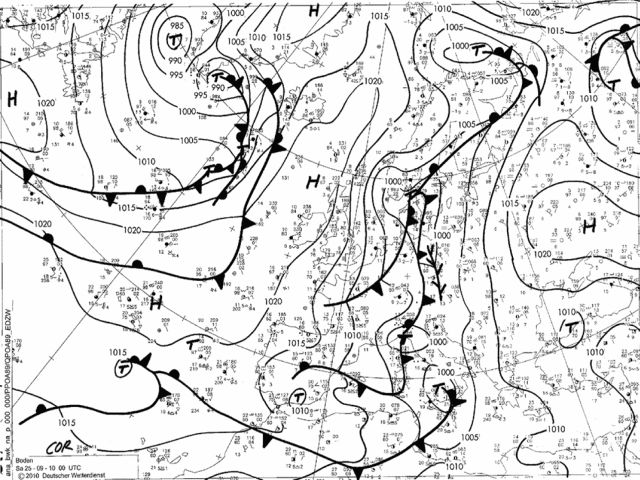
Figure 2.5: DWD surface analysis for 25 September 2010, 00 UTC