RGB Imagery
Since operational weather forecasts are bound to a time limit, efficient tools for filtering information are required. For this purpose the so called RGB (red green blue) composites have been designed. RGBs have been designed to highlight information that would not been clearly visible, if only one channel was being used. RGB composites can be very useful for the tracking of volcanic ash clouds, since selected features can be emphasized in these pictures. The concept of RGB is to implement the information of 3 different channels or combined channels and mark each part in one colour. As the name already indicates the 3 different colours available are red, green and blue, whereas the resulting image will then be a colourful satellite image. When all three colours are present in full intensity the resulting image is white. Following this method a broad range of composites with particular properties can be created. For example the Dust RGB and Ash RGB enable the discrimination of ice clouds and dust/ash signals.
Dust RGB
The Dust RGB implements the information provided by 3 different window channels of MSG, namely IR12.0, IR10.8 and IR8.7. Since the IR12.0 and IR10.8 are clean window channels, they are able to discriminate among land surface temperatures and cloud temperatures. In addition the IR8.7 channel provides information about trace gases and aerosols. As a result the whole range of information can be included, that would not be available if only one single channel was being used.
The dust-RGB is built upon these 3 parts of information:
Red = IR12.0-IR10.8 (-4°C to+2°C)
Green = IR10.8-IR8.7 (0°C to 15°C)
Blue = IR10.8 (12°C to 16°C)
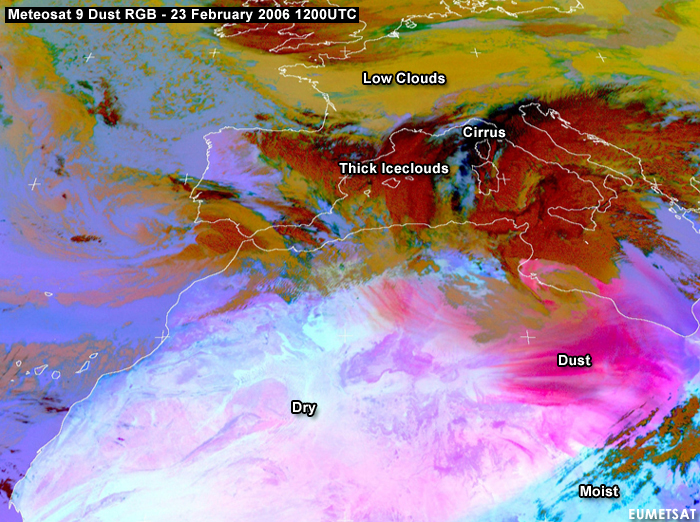
Dust RGBs offers the possibility to depict plumes over land and sea both during day and night. Depending on the brightness temperature difference between IR12.0 and IR10.8 dust or cirrus clouds can be observed. Based on this difference the red color fraction of the RGB composite is determined. Since the IR12.0 channel is particularly suitable to observe cirrus clouds (lower emissivity) the resulting brightness temperature difference will be negative in case of these clouds.
Thin cirrus clouds will be marked in black in the Dust RGB. In contrast for dust plumes the brightness temperature difference will be positive. This will lead to a higher red fraction in the imagery.
Figure 3.5: Meteosat 9 Dust RGB - 23 February 2006 1200UTC
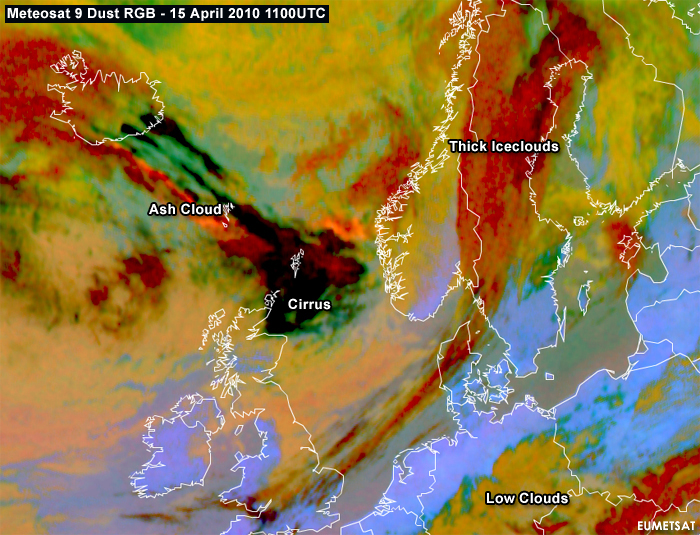
Dust RGBs are not only suitable to detect Saharan dust storms, but can also help to detect volcanic ash clouds. In Dust RGBs volcanic ash clouds are represented in an orange colour.
Figure 3.6: Meteosat 9 Dust RGB - 15 April 2010 1100UTC
An orange composite consists of full intensity of the red fraction, medium intensity of the green fraction and low intensity of the blue fraction. Like in the Dust RGB the positive brightness temperature difference IR12.0-IR10.8 will lead to a high intensity of the red colour fraction. However it is the green fraction which plays the important role here. The IR8.7 channel is able to detect aerosols like ash particles (lower emissivity). In consequence the brightness temperature difference IR10.8-IR8.7 will be positively orientated, leading to medium intensity of the green fraction.
Using this information take a look at the Dust RGB loop of Europe.
Figure 3.7: Meteosat 9 Dust RGB - 15 April 2010 from 000UTC to 1330UTC.
Outline of the weather event from 14 - 17 April
In the beginning there were only mid- and low-level clouds present near Iceland. Within the next few hours the colour changes from green to dark green and finally black. As already explained black indicates thin cirrus clouds. These ice clouds resulted from the enormous amount of water vapour which was produced when the melting water from the glacier entered the volcanic chimney. The resulting ice clouds masked the ash signal in the beginning -> have a look at the loop! Moreover the clouds present in the south-east of Iceland were affected by a warm front band reaching over Iceland. Additionally there could be lee waves detected in the east of Iceland (see also single IR10.8 image, 15 April 00 UTC).
During the next few hours the ice sublimated, whereas the ash particles remained. Looking at the Dust RGB loop, the first ash signals can be detected around 06 UTC. The ash particles appeared in a slight orange colour. Monitoring the ash clouds during the morning hours, it comes clear that the volcano is still emitting ash particles. This new ash clouds then undercut the track of the ice clouds coming from the north of Iceland.
At 12 UTC the older part of the ash clouds reached Norway, whereas the newer part was heading south-eastwards. As already mentioned in the introduction it should be noted, that ash clouds are only visible in the satellite imagery at a certain concentration. Therefore neighboring regions should be considered when issuing warnings.
Ash RGB
The main principle about Ash RGB is the same as in the Dust RGB. There are 3 parts of information combined, each marked with one own colour. Like in the dust-RGB, the channels being implemented are the following ones:
Red = IR12.0-IR10.8 (-4°C to +°2C)
Green = IR10.8-IR8.7 (-4°C to +°5C)
Blue = IR10.8 (-30°C to 30°C)
In contrast to the Dust RGB the temperature ranges linked to certain cloud features are slightly different. As a result the final composite experiences a shift into the green colour fraction.
Colour interpretation:
- Sulphur dioxide clouds are green
- Depending on the height, temperature and particle size, ash goes from being red (when it is very cold) to magenta (when it is warm) to yellow (when it is composed of small ash particles)
- Thin cirrus is black
- High clouds and thunderstorms are brown
- Near-surface temperatures are in shades of blue and green
In the following Ash RGB ash clouds appears in a yellowish colour. The main benefit of the Ash RGB is that it shows the three major volcanic effluents (ash, sulphur dioxide and ice crystals) in distinct colours, enabling users to observe effluents drifting from the site of an eruption. But it should be noted that it cannot detect ash or sulphur dioxide embedded in ice (mixed volcanic cloud). Take a look at the Ash RBG and compare it to the Dust RGB: (shifting mouse -> RGB changes):
Figure 3.8: Meteosat 9 Ash RGB - 15 April 2010 1200UTC. Hover your mouse over the image to bring up the corresponding Dust RGB.

