Satellite images and derived numerical parameters
In order to consider the whole physical background derived model parameters are also required. In the last chapter we have already looked at the thermal advection (derived from radio-sounding data and from NWP-fields of surface pressure and geopotential in 300 hPa) and the development of surface fronts (derived from the surface pressure tendency and surface winds). The numerical field of thermal advection showed only negligible values at 500 hPa, corresponding well with the results of the radio-soundings. Because NWP-fields of frontogenesis and of IPV are only available with a time increment of 12 hours we are unable to consider these parameters. In the next two chapters we discuss the vorticity advection and the combination of the vertical motion and KO-index.
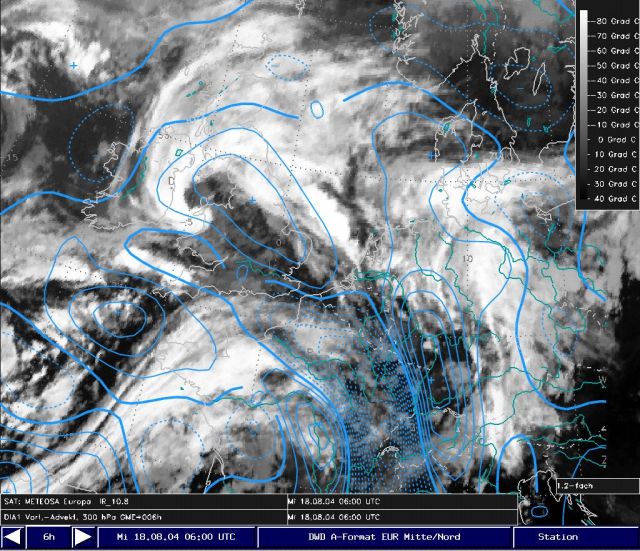
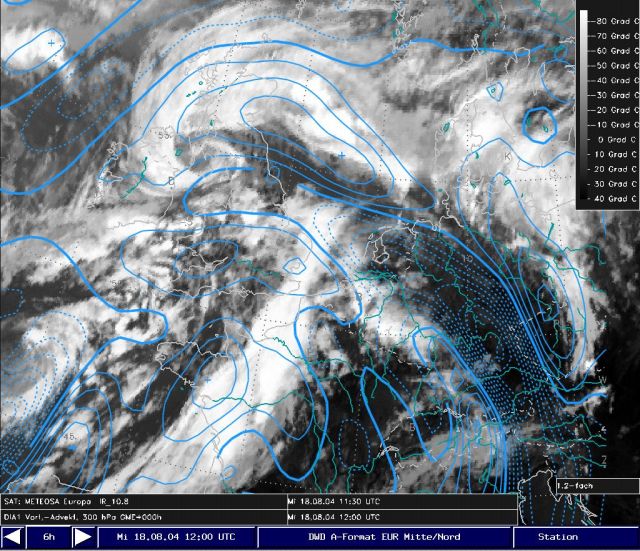
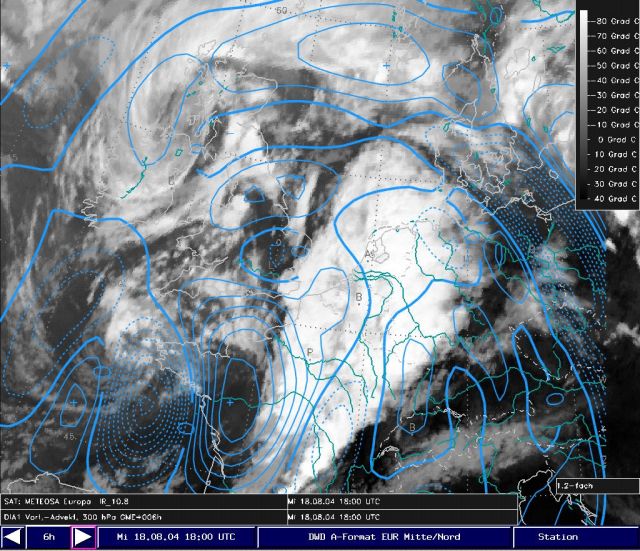
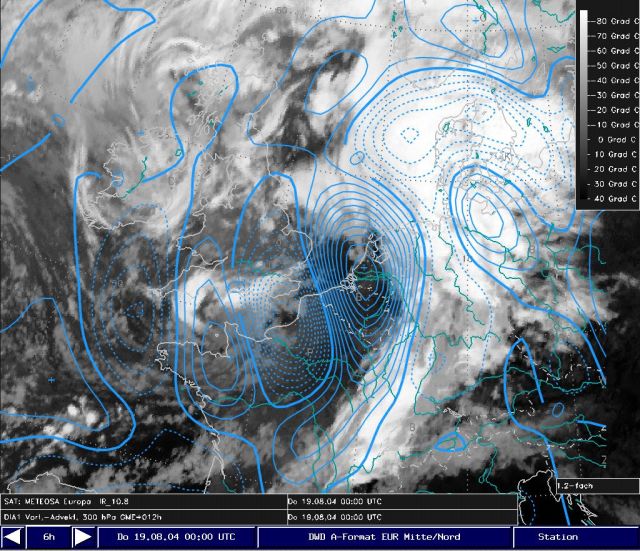
Gallery 1: IR-imagery and vorticity advection at 300 hPa: time sequence
In this part we check if a correspondence between the cloud structures and the dynamical forcings existed. Because there was negligible thermal advection at higher levels the vorticity advection was crucial for the upward motion.
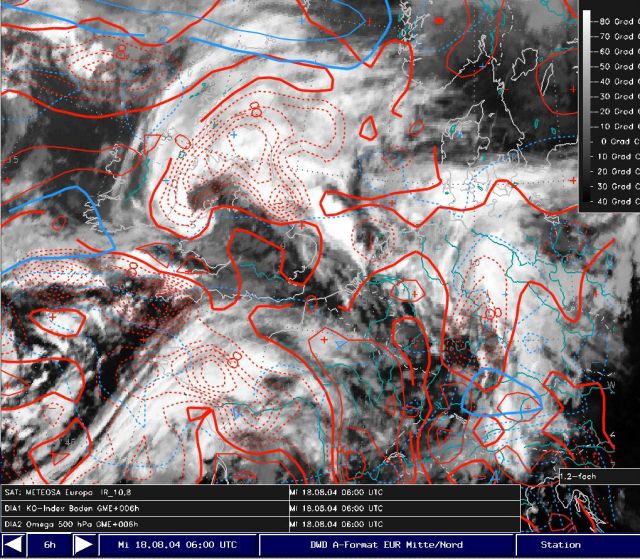
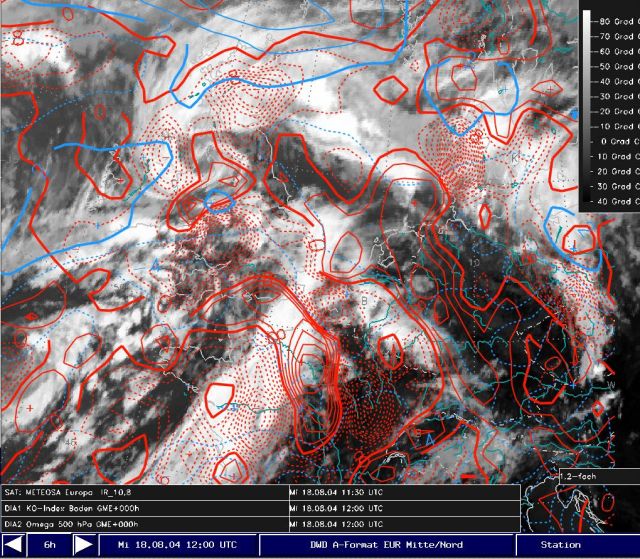
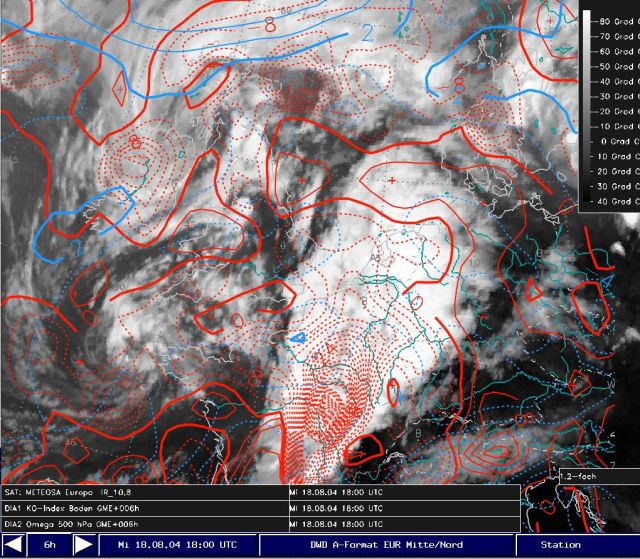
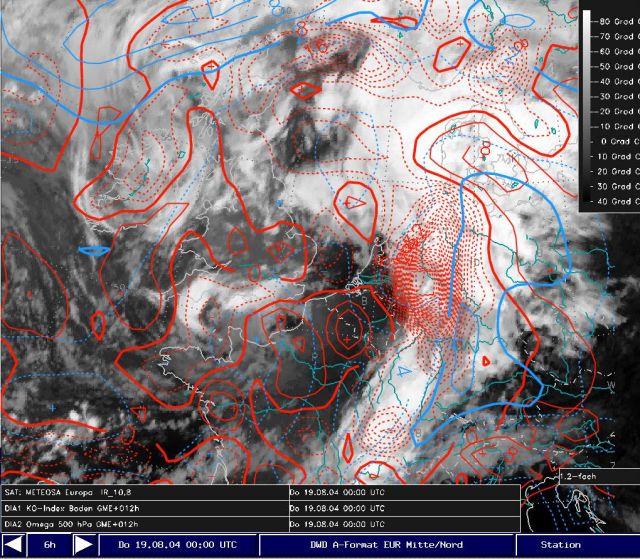
Gallery 2: IR-imagery combined with KO-index and vertical motion 500 hPa: time sequence
When we combine the satellite image with the NWP-fields of omega and KO we see where convection was triggered by dynamical forcing.
Summary of the investigations in this chapter
Because the following parameters are available every 12 hours no images are considered. The following results can be summarized:
- No relationship could be found between IPV (320K) and the most intense convection because low IPV-values were super-imposed with the relevant cloud formation.
- The frontal parameter exhibit small positive values at 850 hPa and negligible amounts at 500 hPa, in conjunction with the front formation near the surface.
The following NWP-parameters are available every 6 hours. From the images we find the following most important results:
- The biggest parts of the cloud patterns of the squall line are influenced mainly by positive vorticity advection due to curvature.
- The NWP-fields of upward vertical motion (500 hPa) and negative KO-values show a good correspondence with the convective cloud structures of the squall line. At the end of the time period, over the North Sea, negative KO and vertical ascent were simulated although prevailing stratiform rain were reported. This is because the warm air advection above 500 hPa is stabilising the atmosphere at higher levels.