Satellite Images, weather and basic numerical parameters
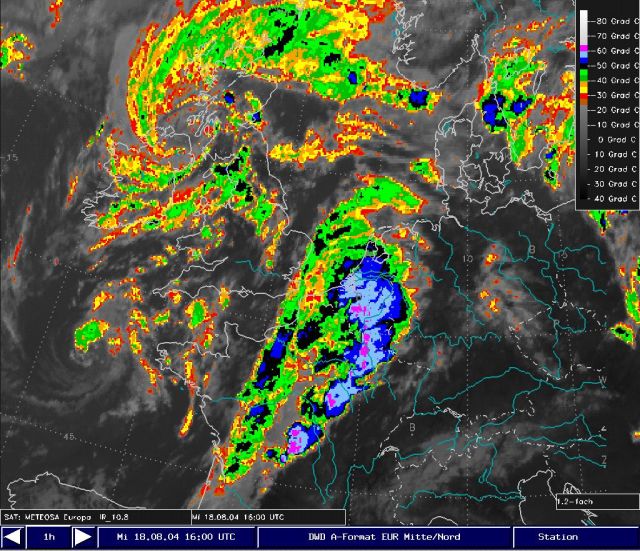
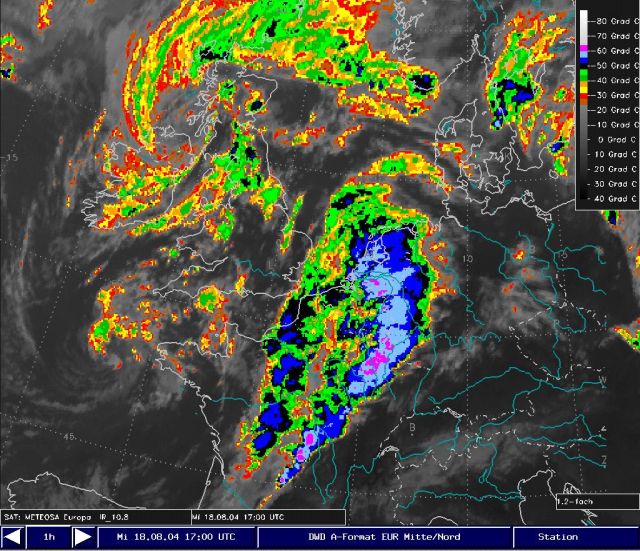
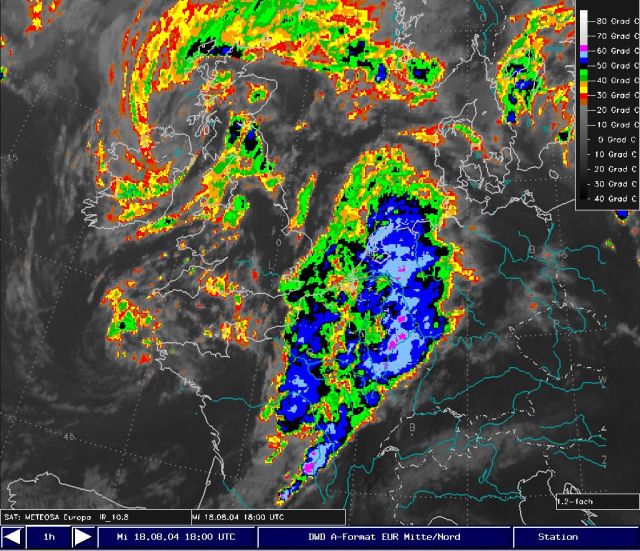
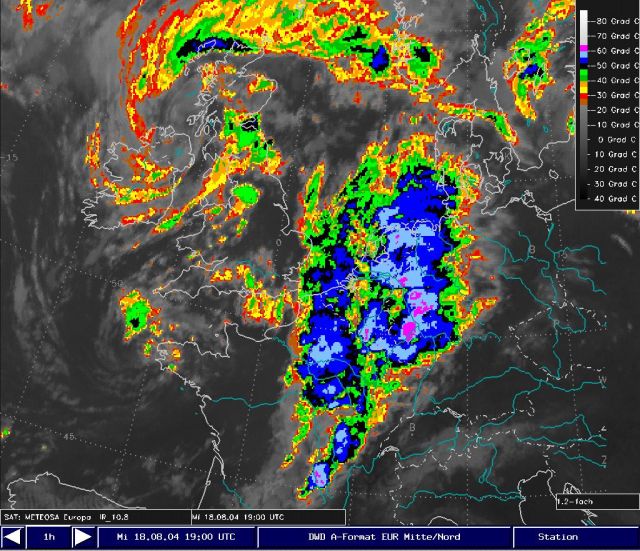
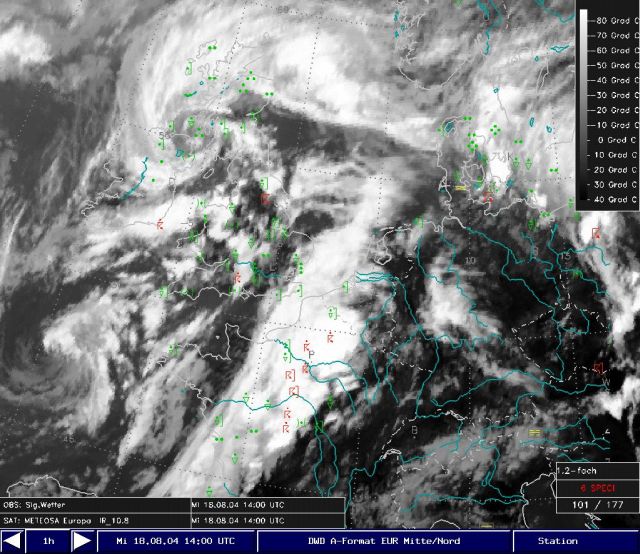
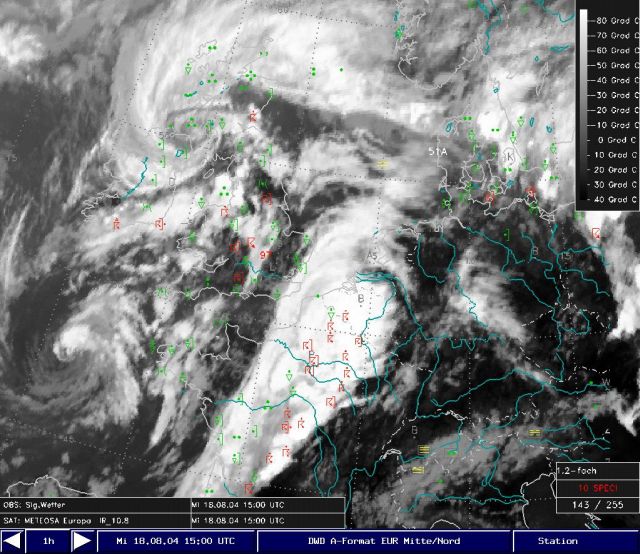
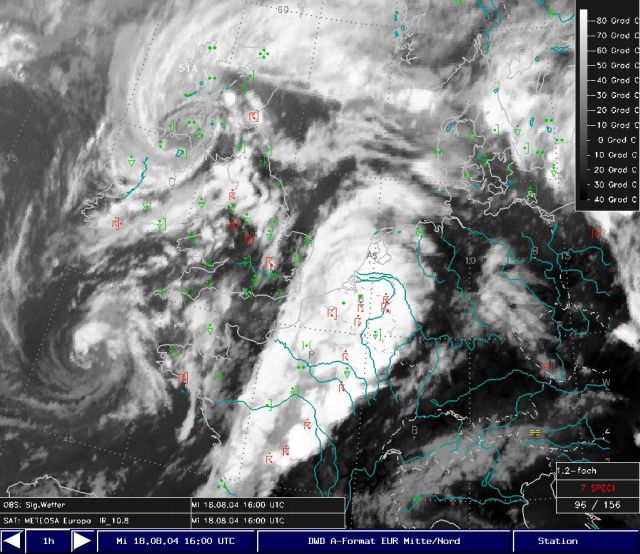
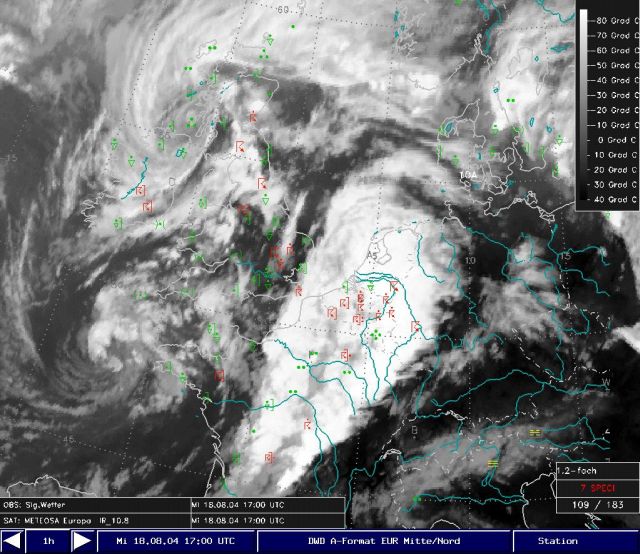
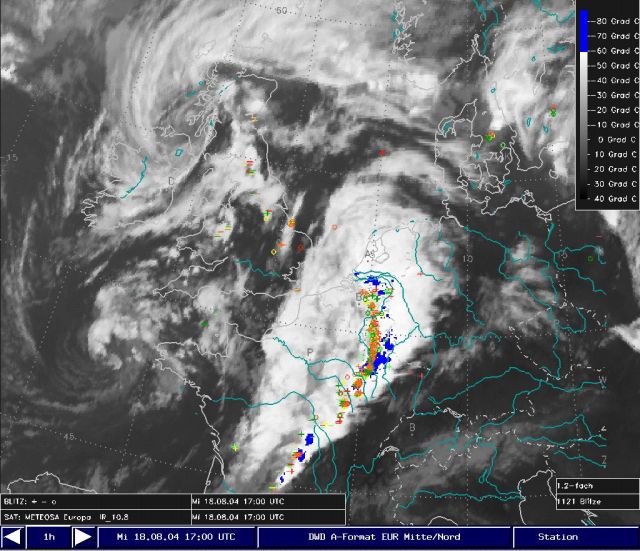
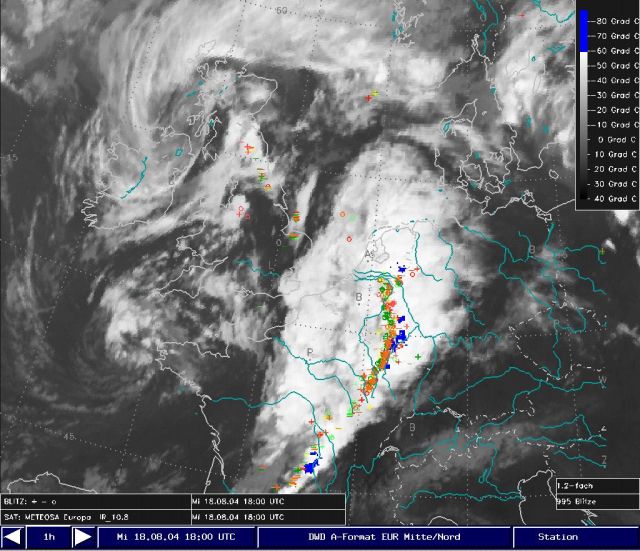
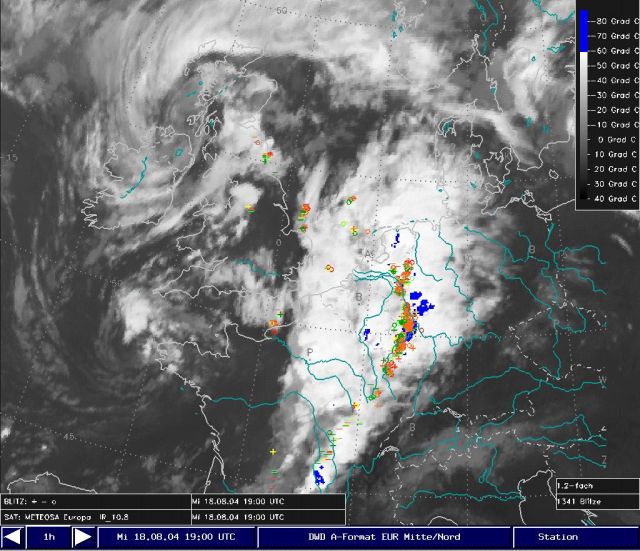
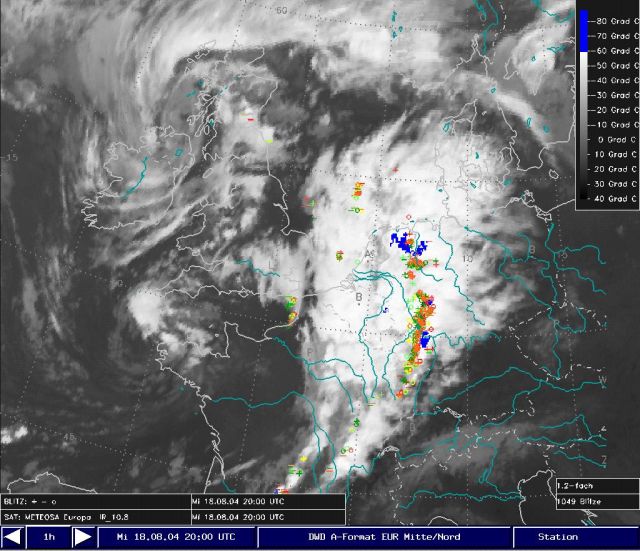
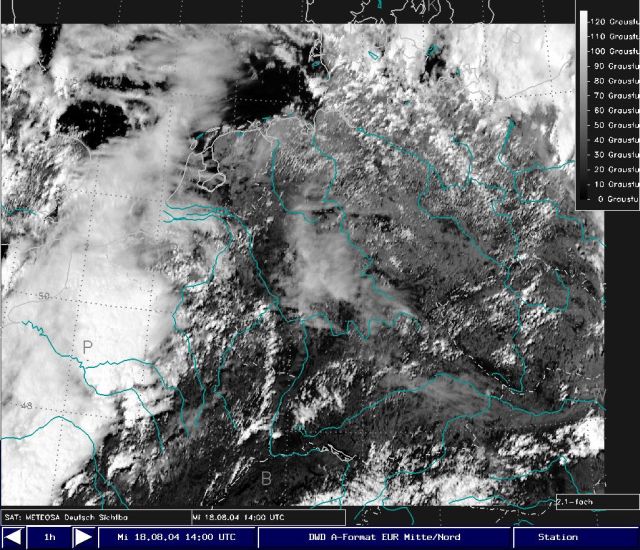
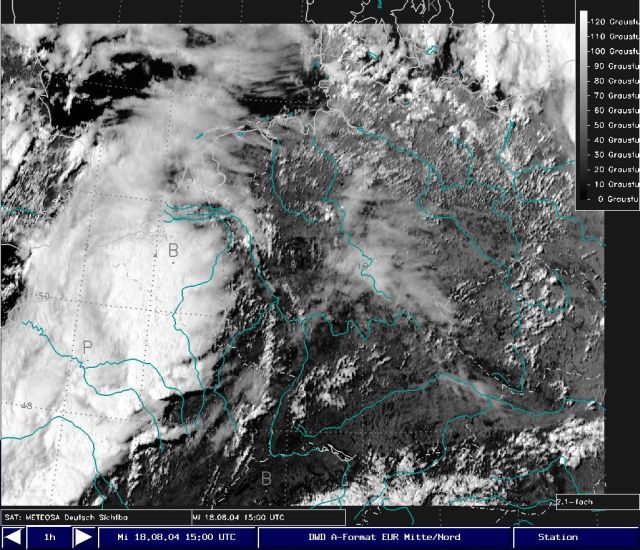
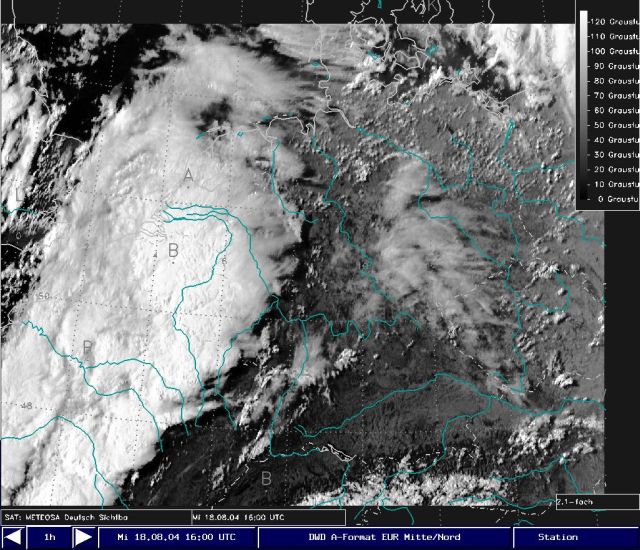
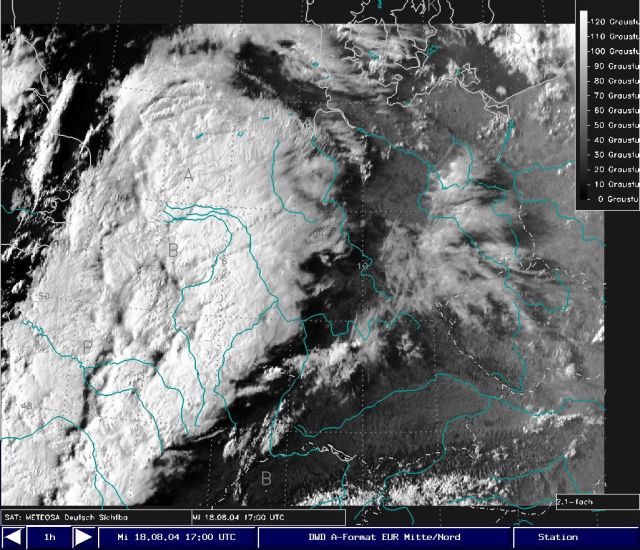
On 18 August 2004 at 06 UTC a cloud band extended from the western parts of France to Biscay. However, during the next 6 hours no intense convection and fast displacement could be observed. From 12 UTC convective cells developed rapidly in the eastern part of the squall line. At 17 UTC the squall line arrived in western parts of Germany at which time the rainfall was at maximum intensity with wind speeds in excess of 100 km/h. Later on the squall line weakened and moved to the North East. At the end of the time period rain mainly from stratiform cloud was observed.
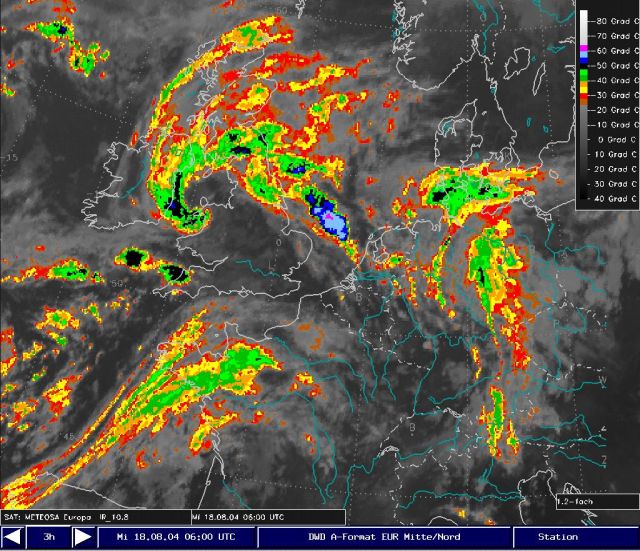
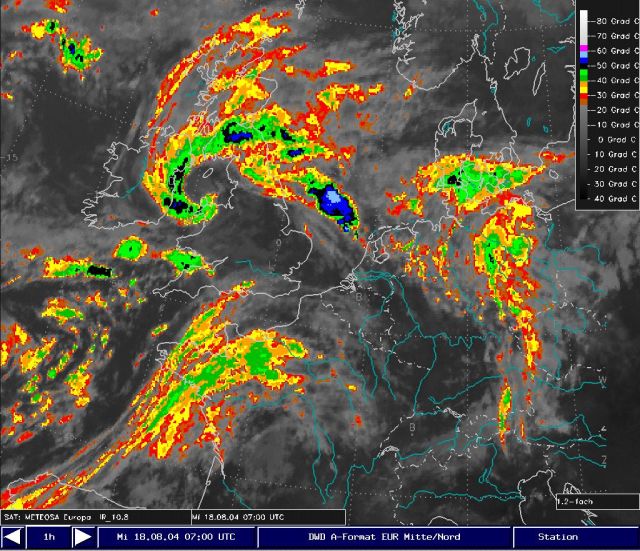
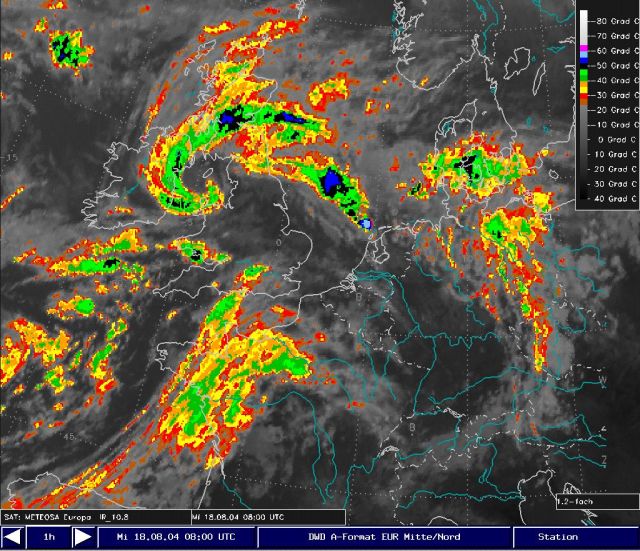
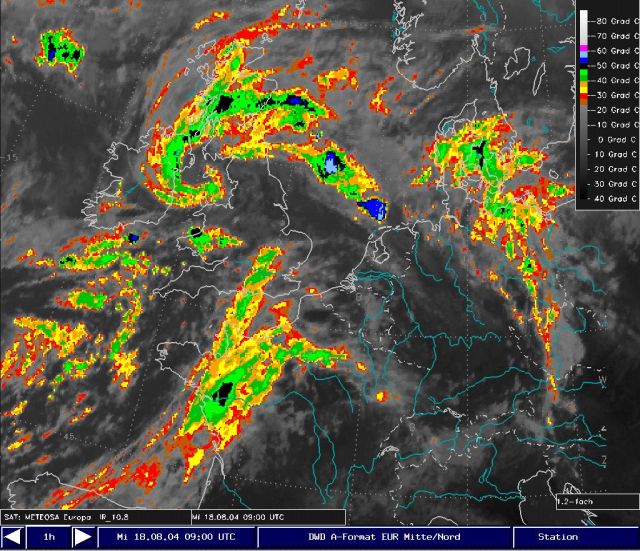
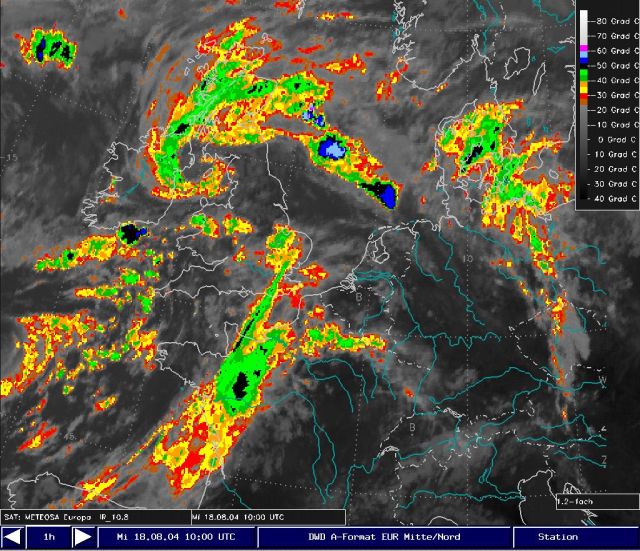
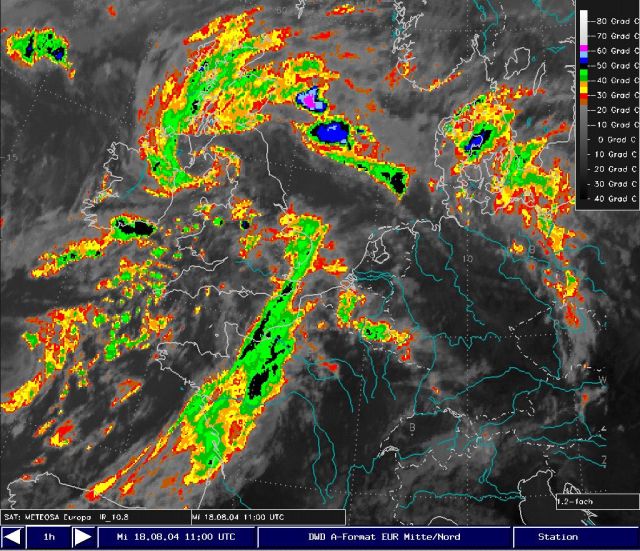
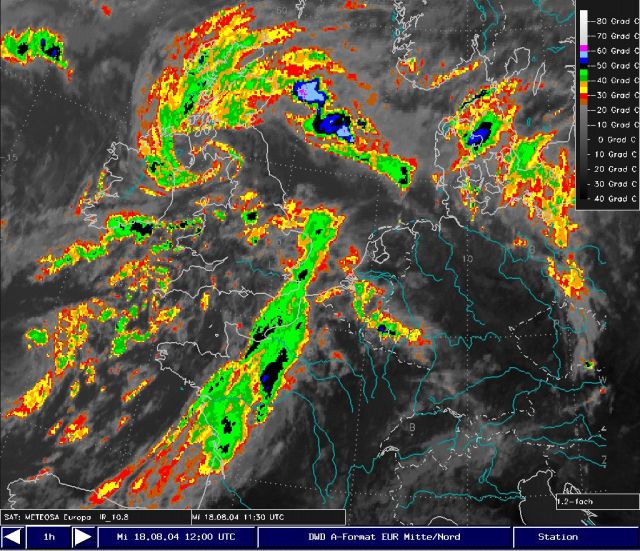
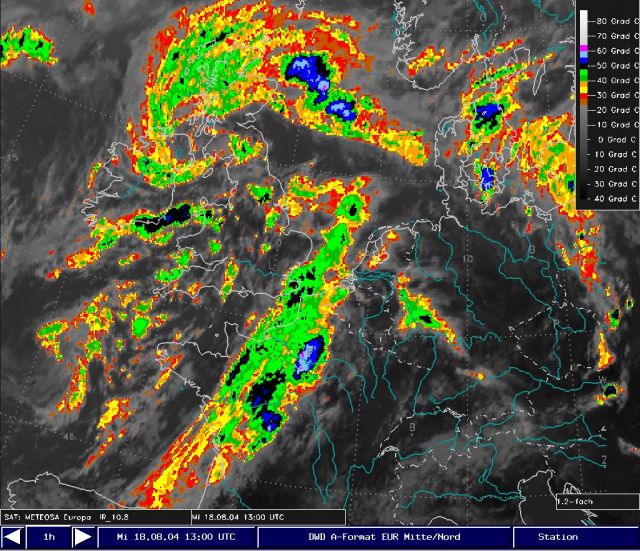
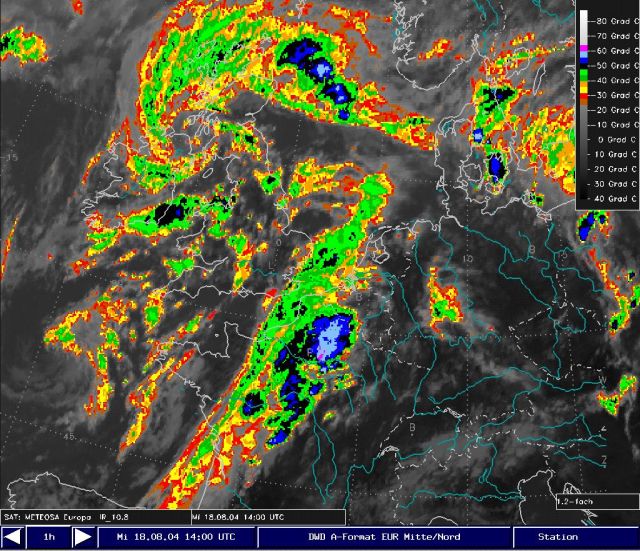
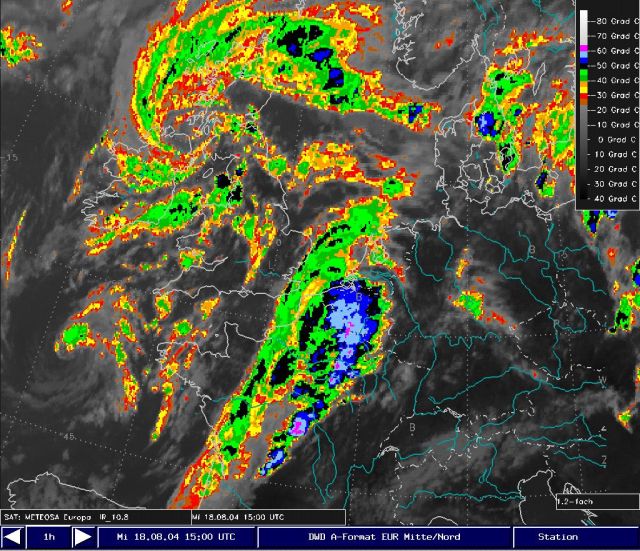
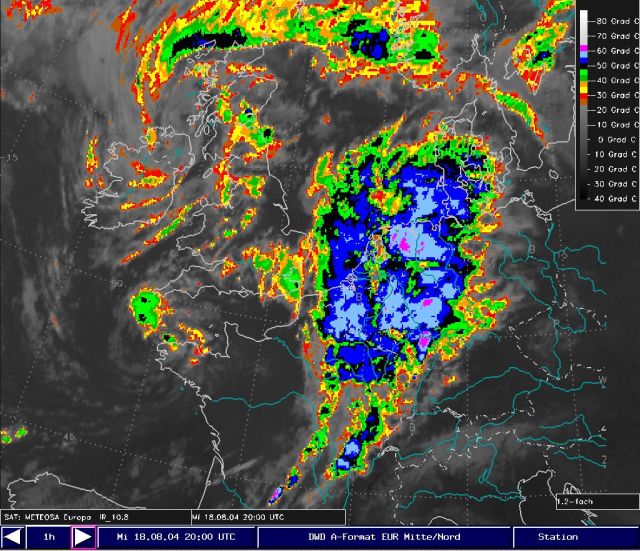
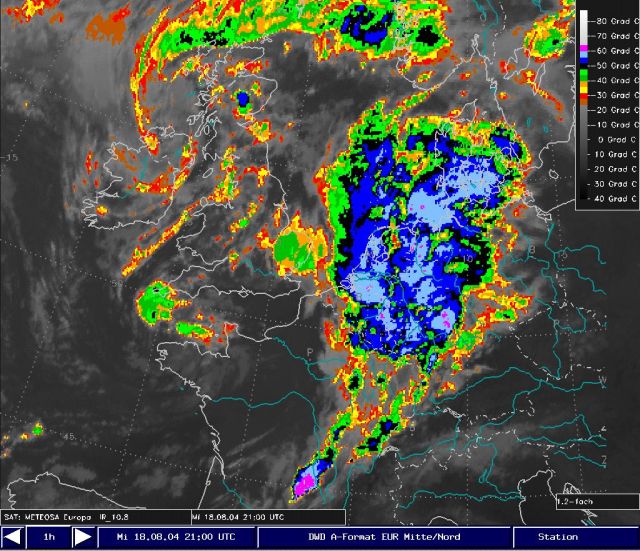
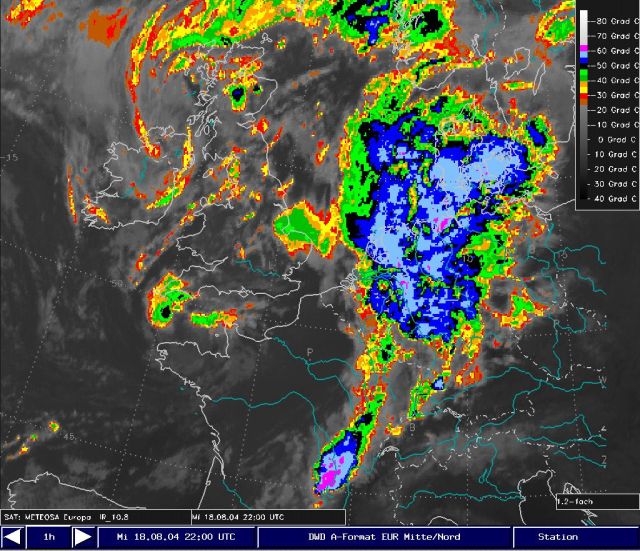
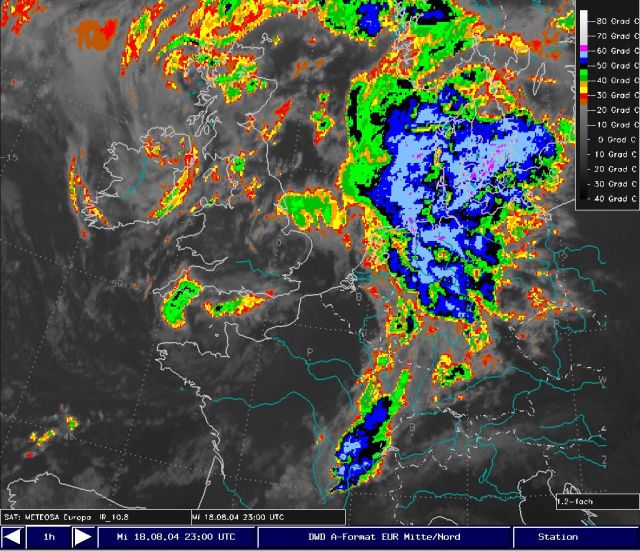
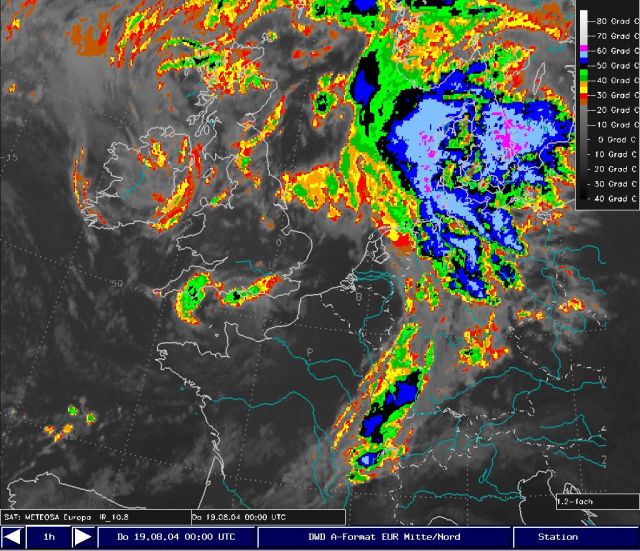
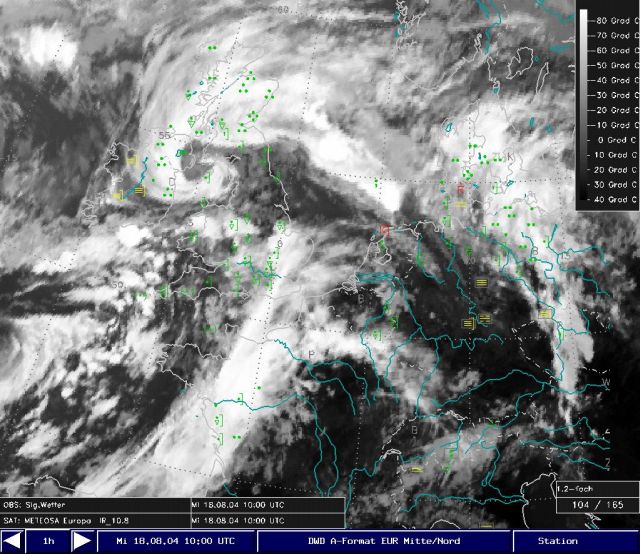
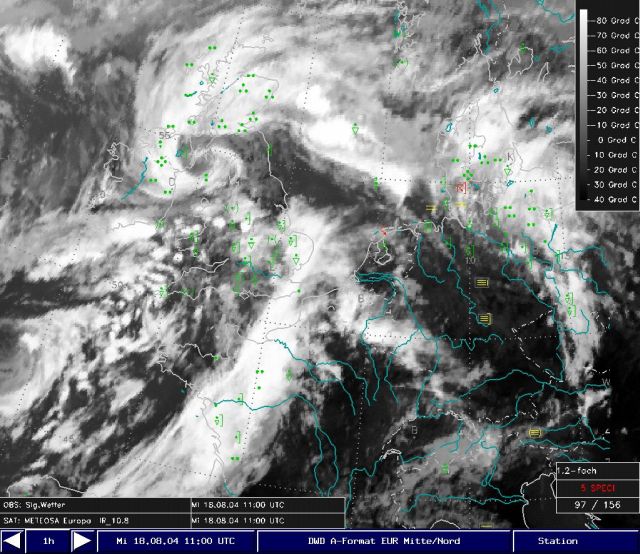
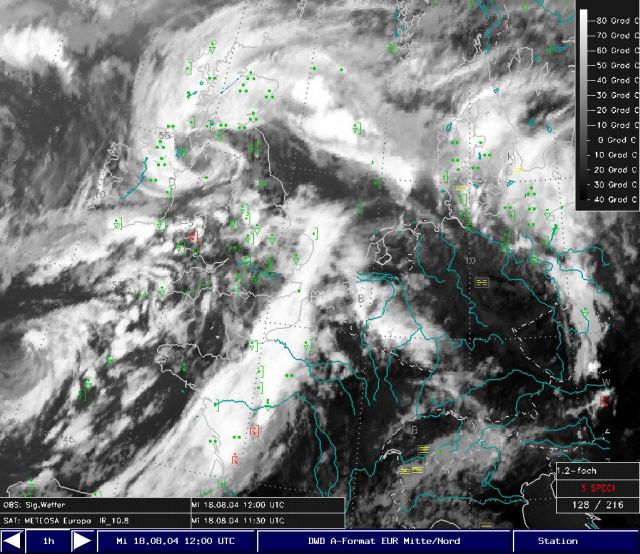
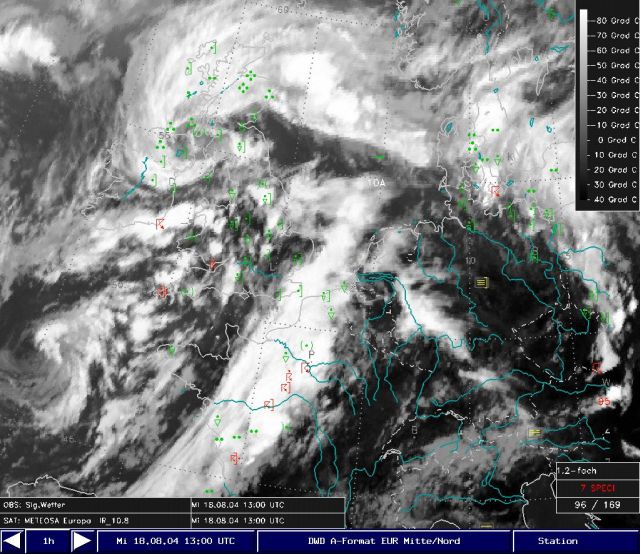
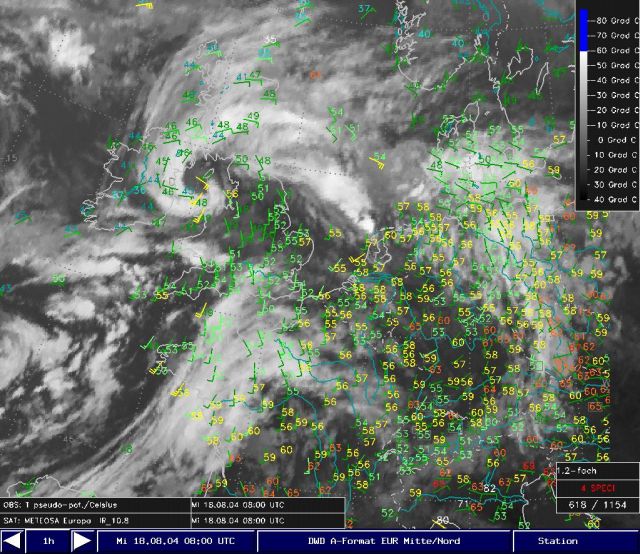
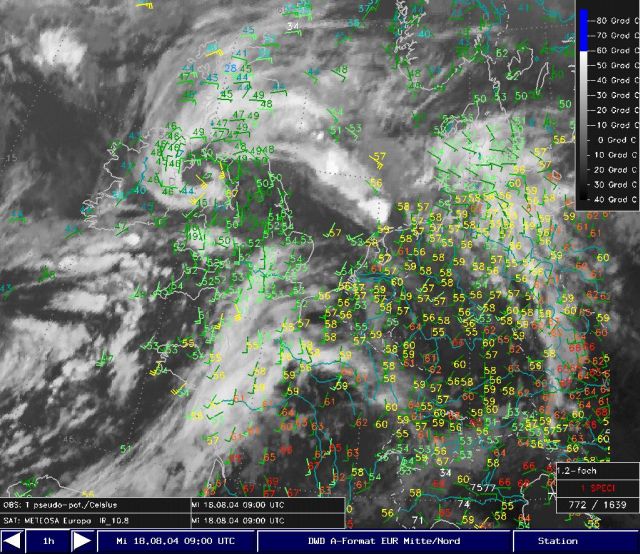
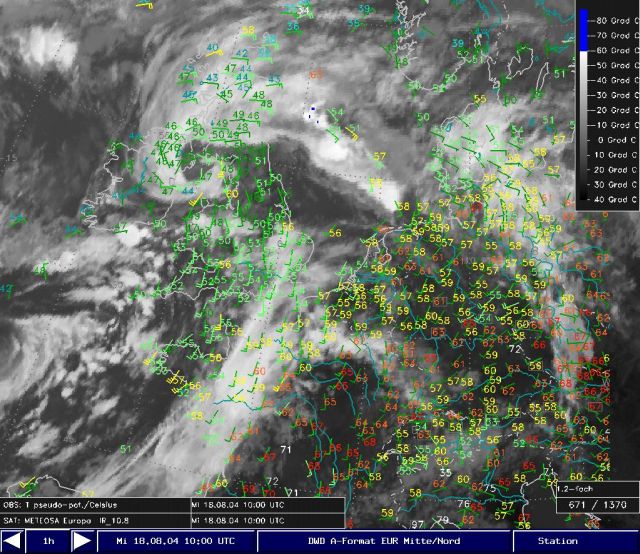
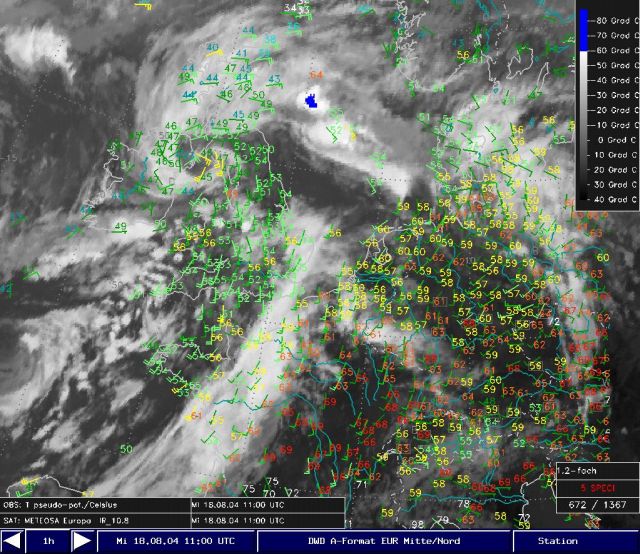
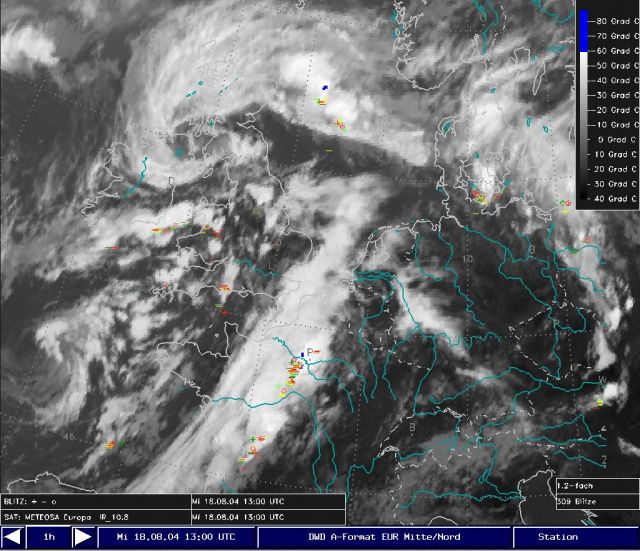
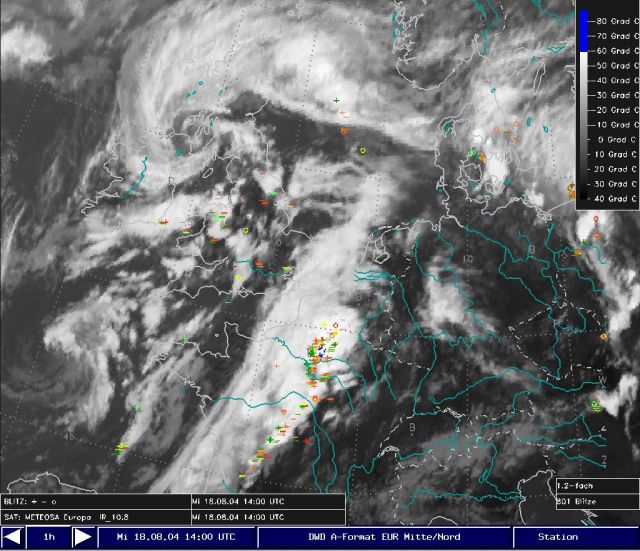
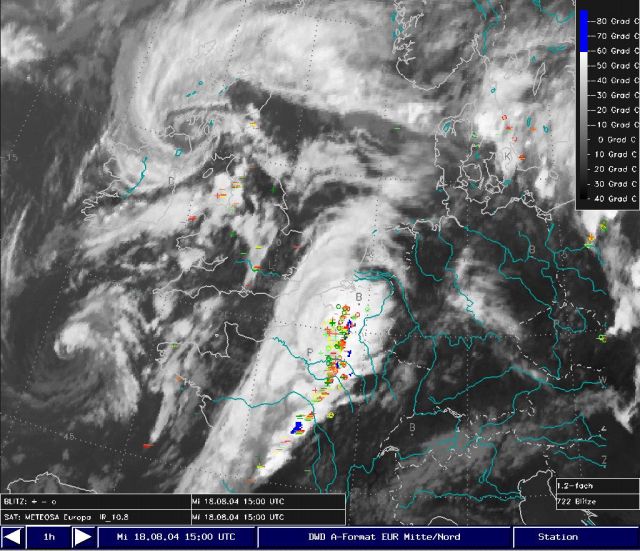
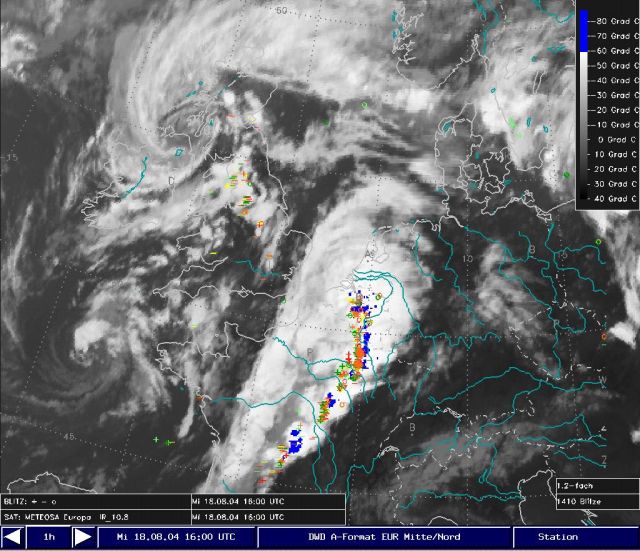
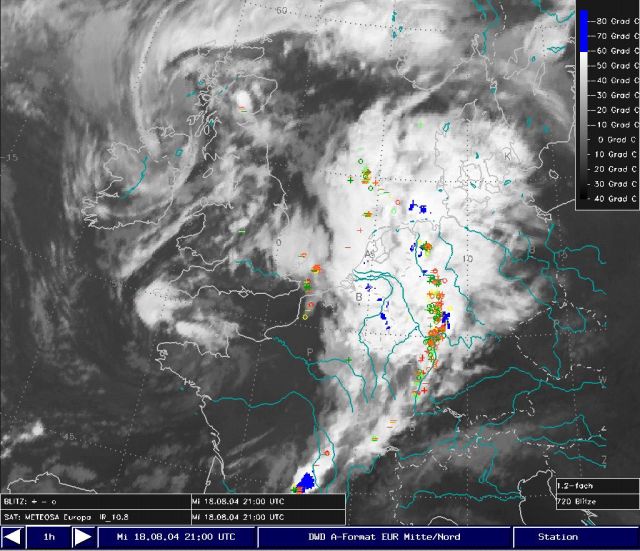
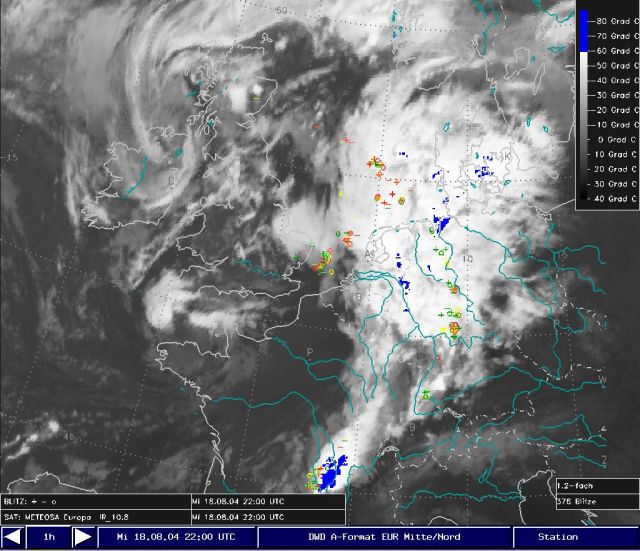
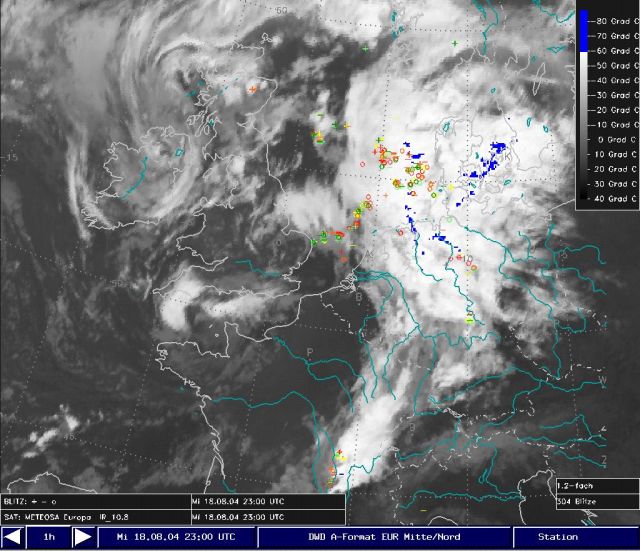
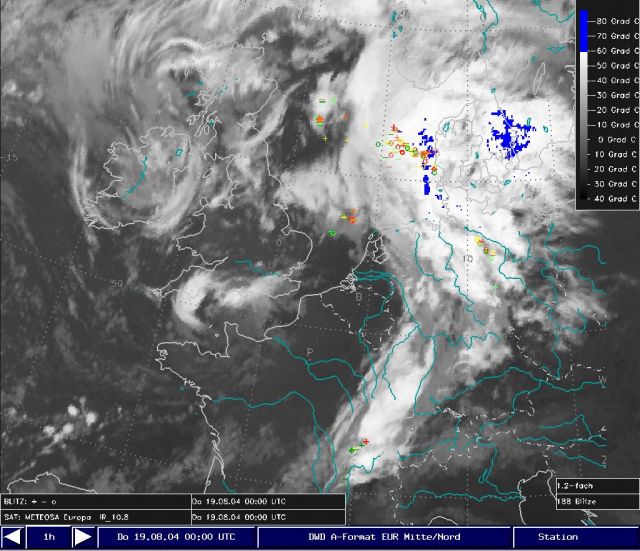
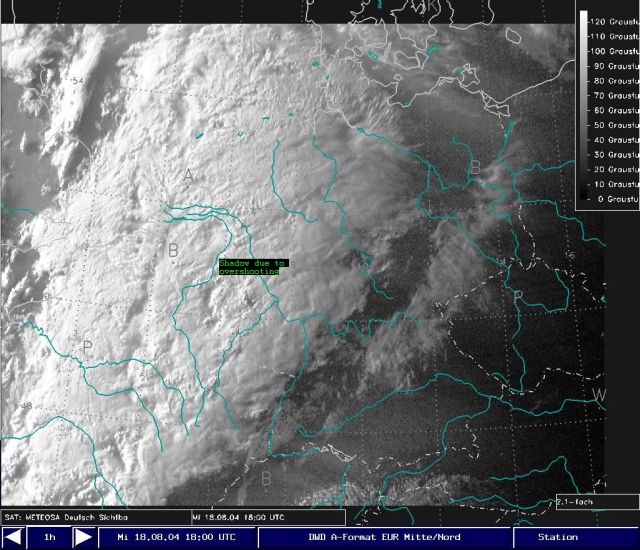
Gallery 1: From 06 to 12 UTC the cloud band extend to a height of 10 km (Cloud top temperatures (CTT) around -50°C, black areas), equivalent to a moderate convection. During the next hour, convective cells extending to the tropopause (CTT between -60 and -65°C, violet) rapidly developed at the eastern edge of the squall line. CTT below -60°C is a clear indication of hail. At 17 UTC the squall was at its maximum intensity with many cells of CTT below -60°C. From 18 UTC we observe a decrease of convection and a further broadening of the squall line. At the end of the time period the only high extending clouds can be observed over the northern parts of Middle Europe.
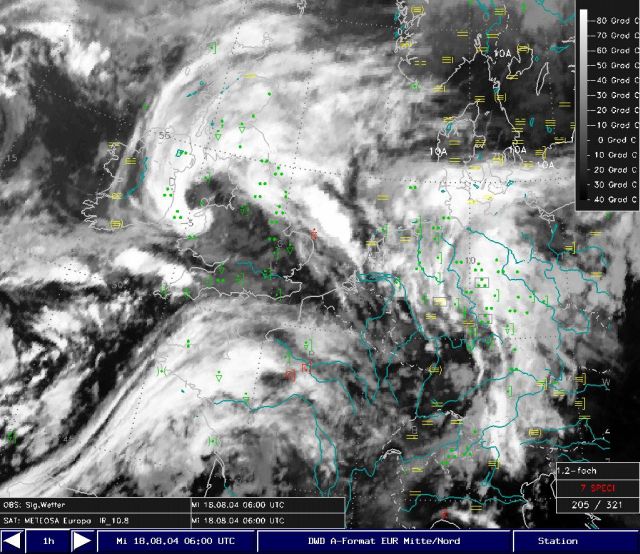
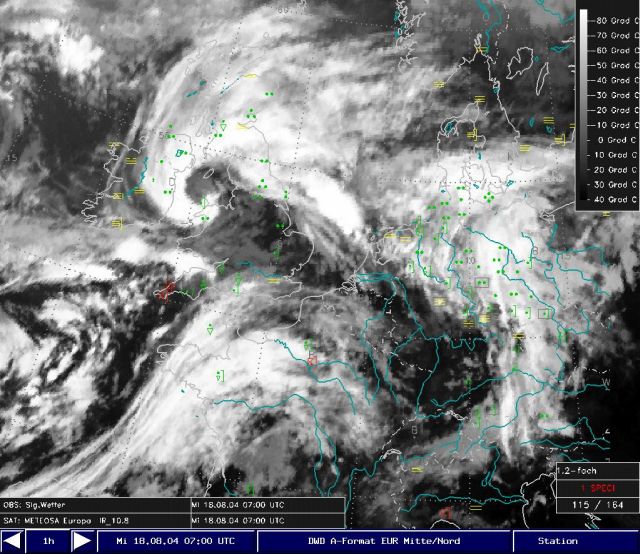
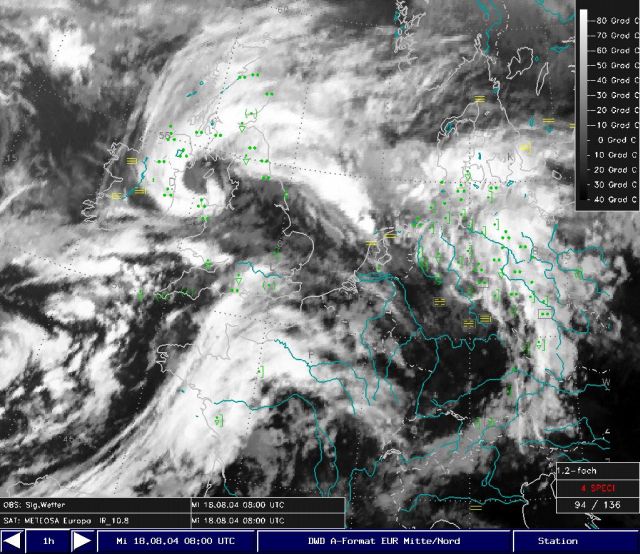
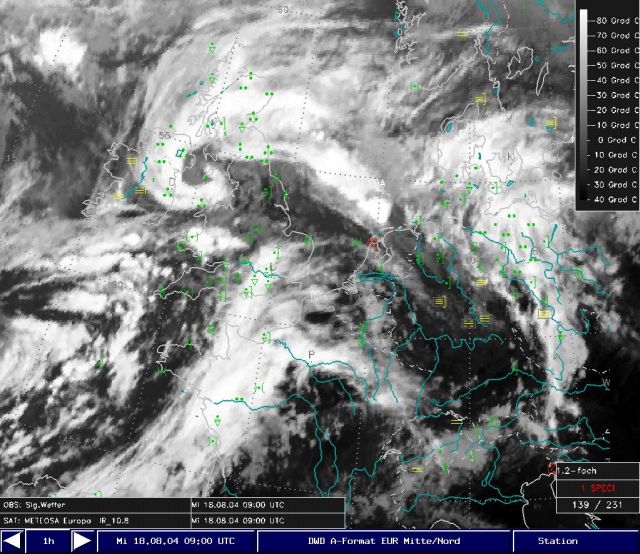
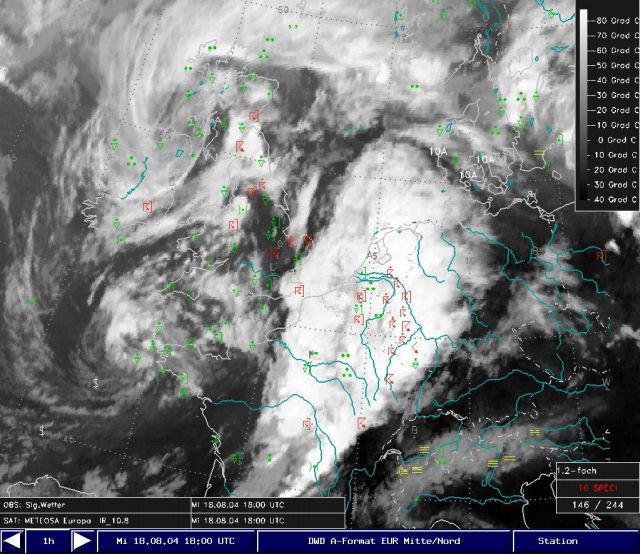
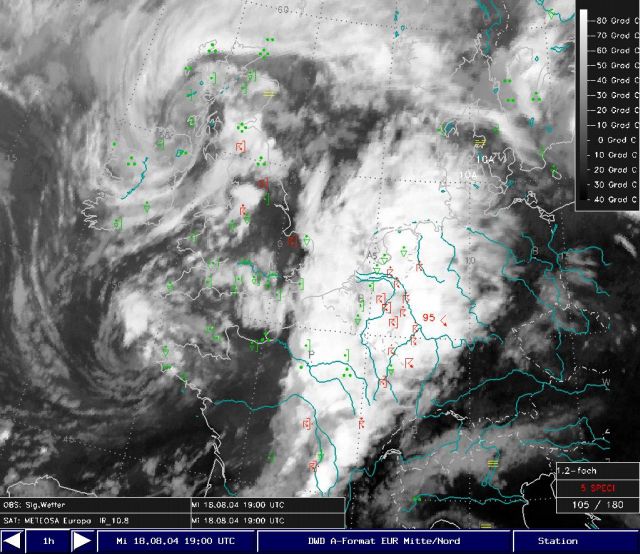
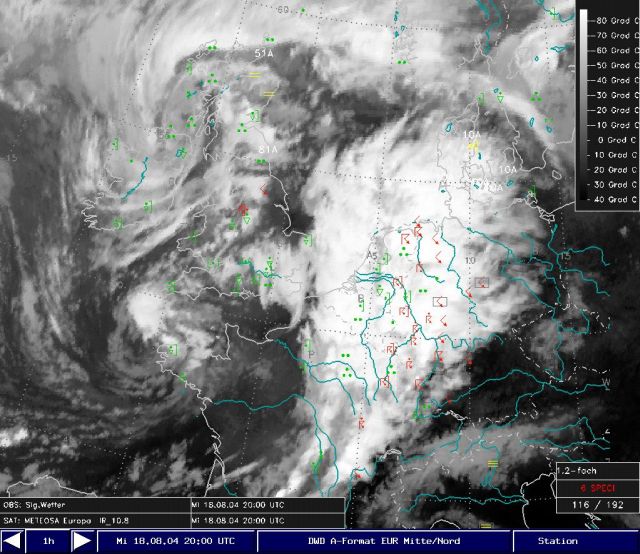
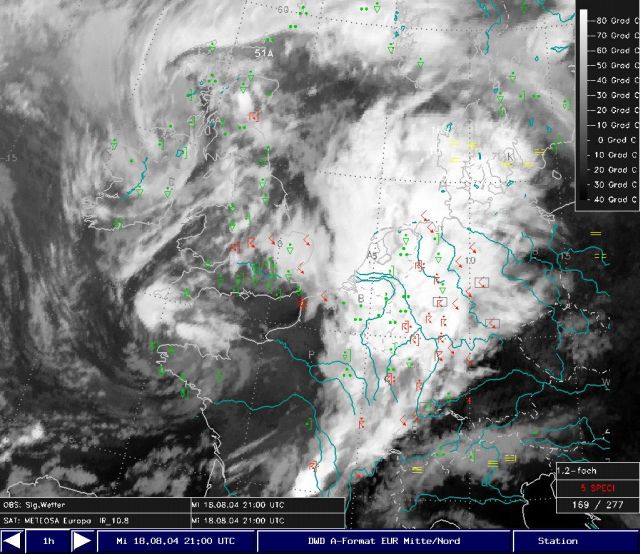
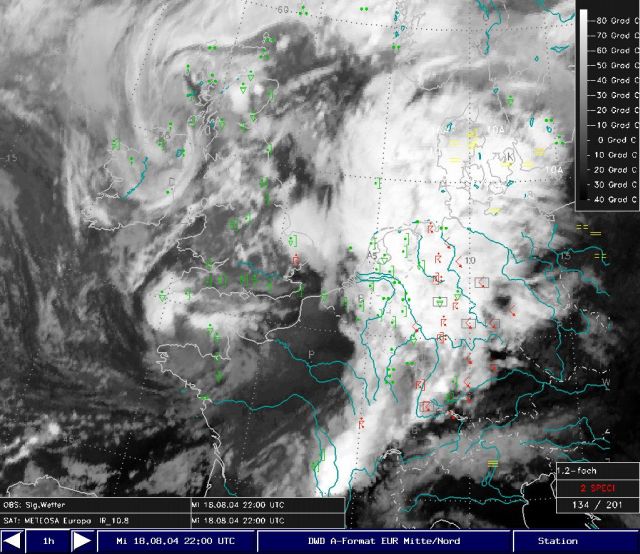
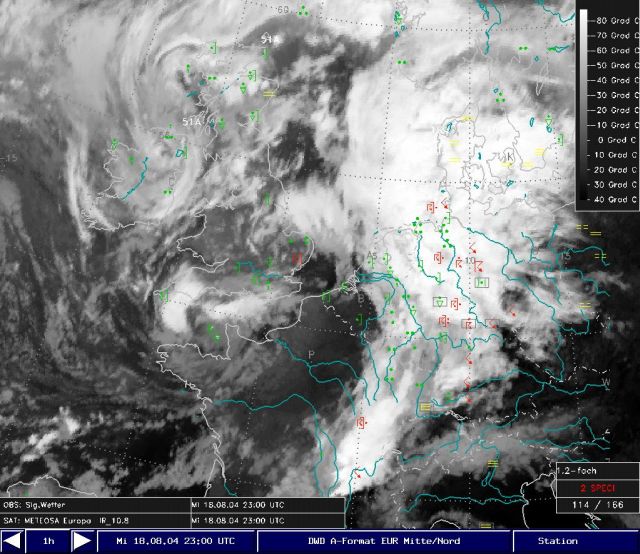
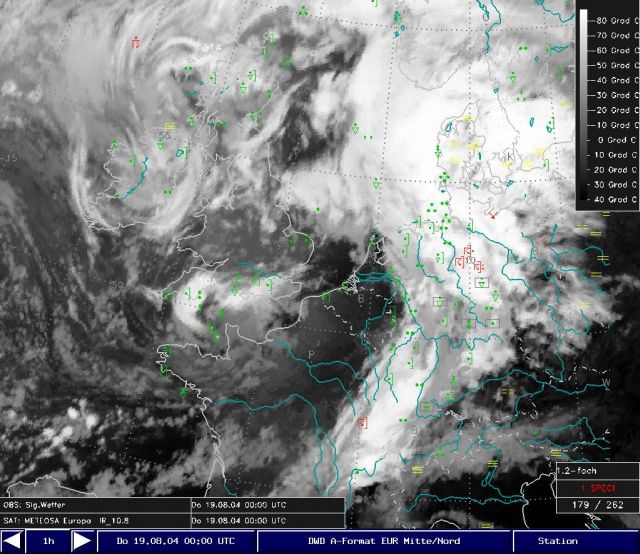
Gallery 2: IR-imagery with significant weather: time sequence
In this chapter the observed weather in combination with the wind and IR-imagery is presented.
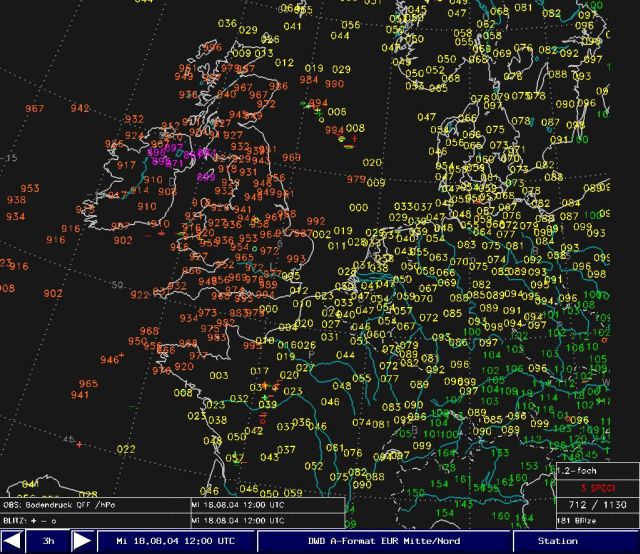
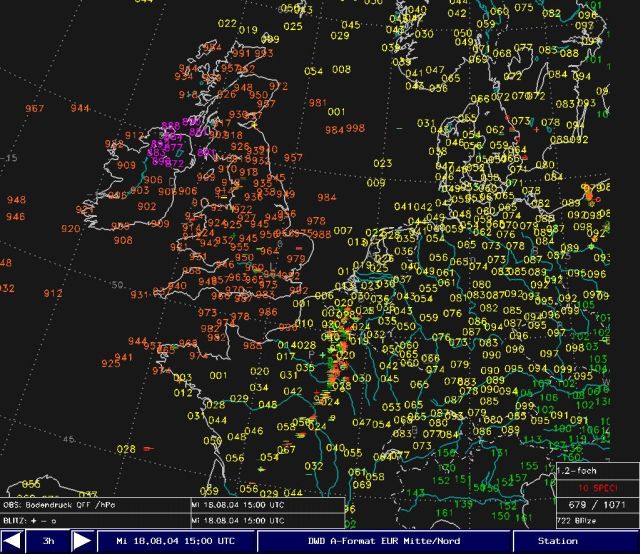
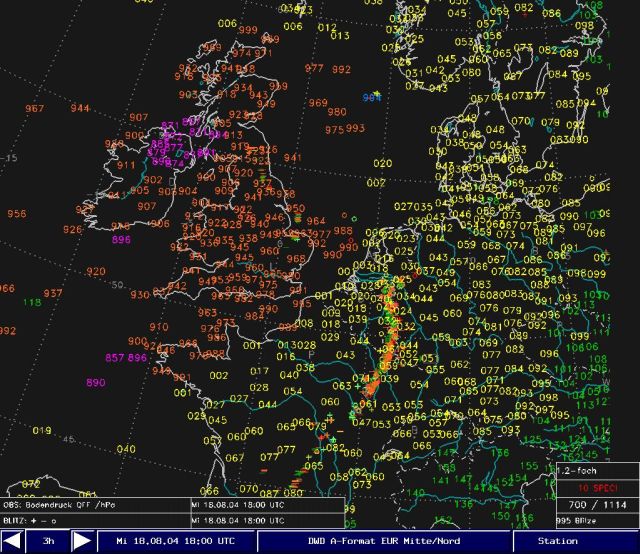
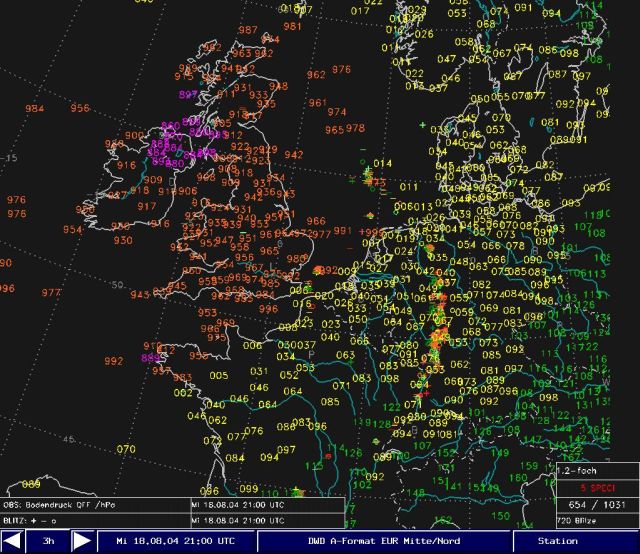
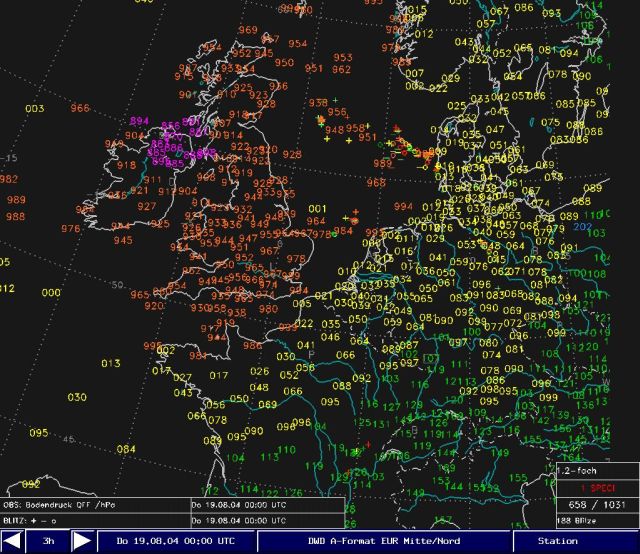
Gallery 3: Surface pressure and lightning: time sequence
With this combination we will apply the conceptual model of mesoscale height and low that often developed near a squall line.
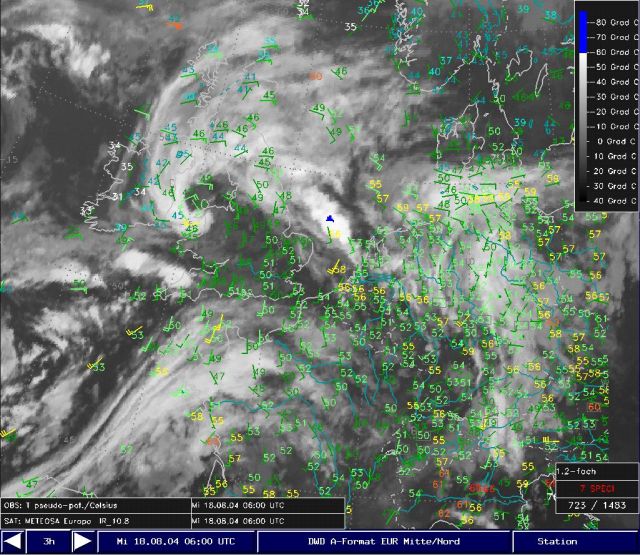
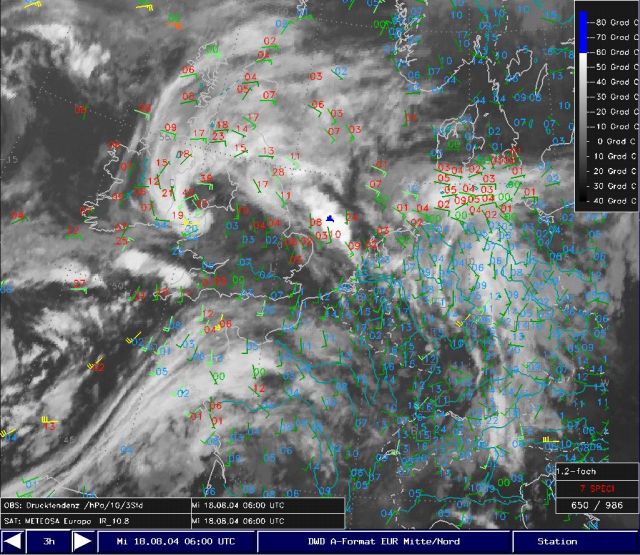
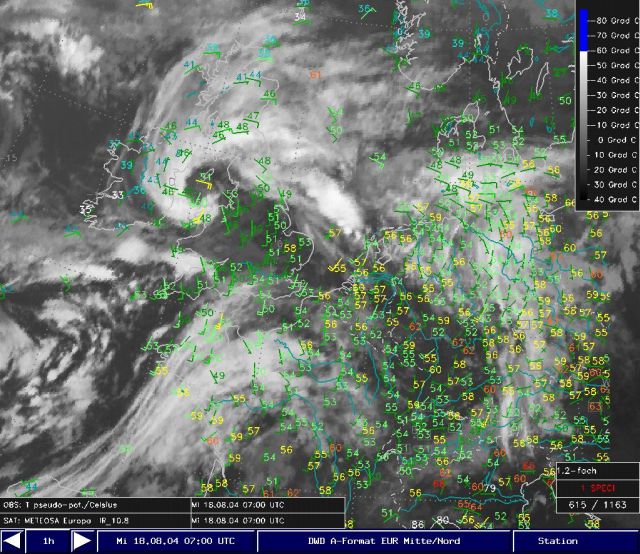
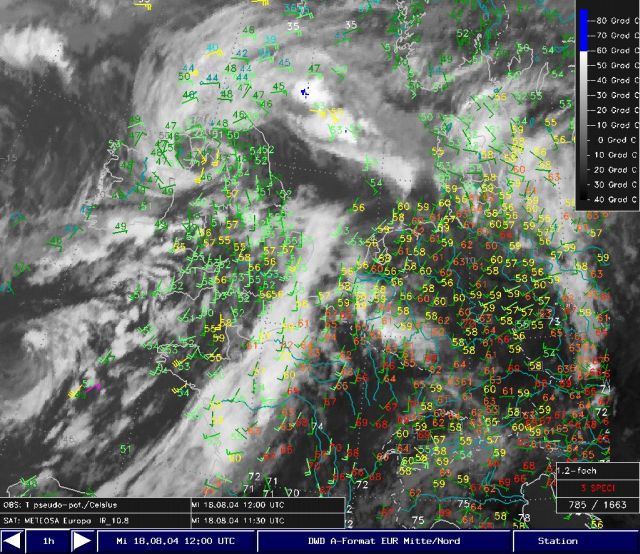
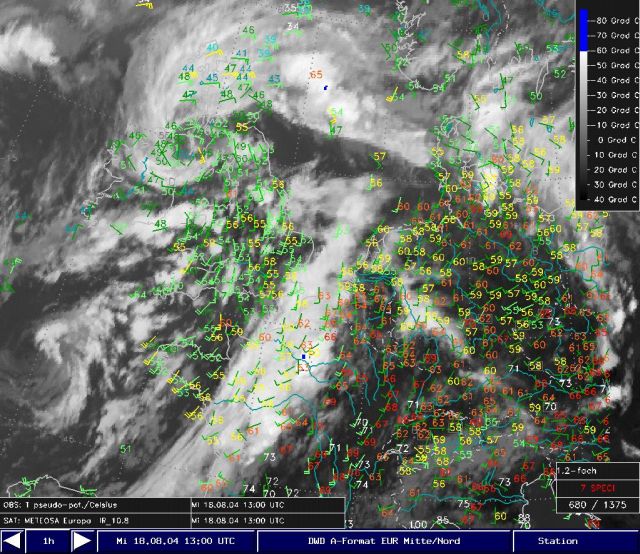
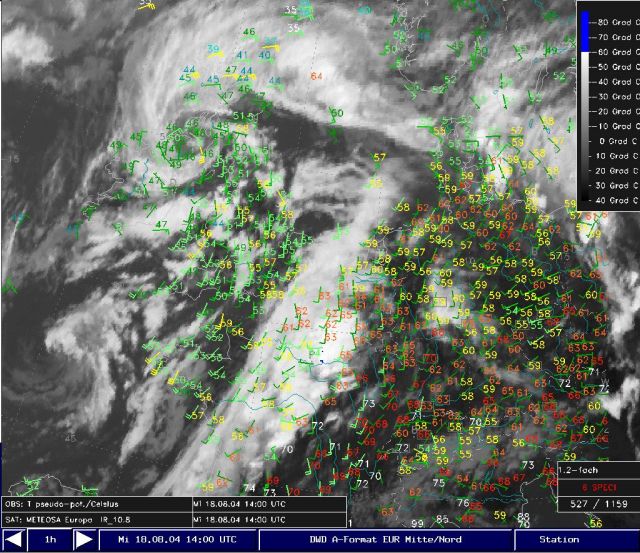
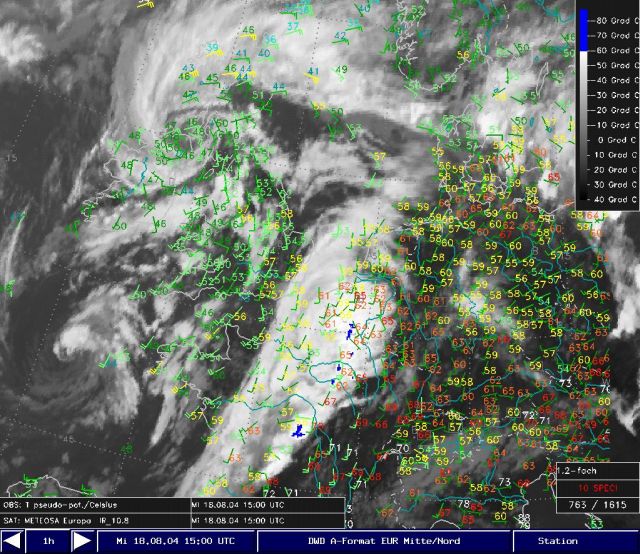
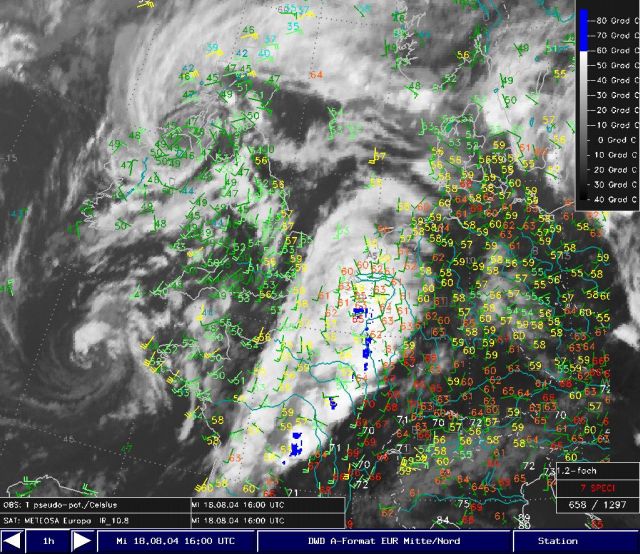
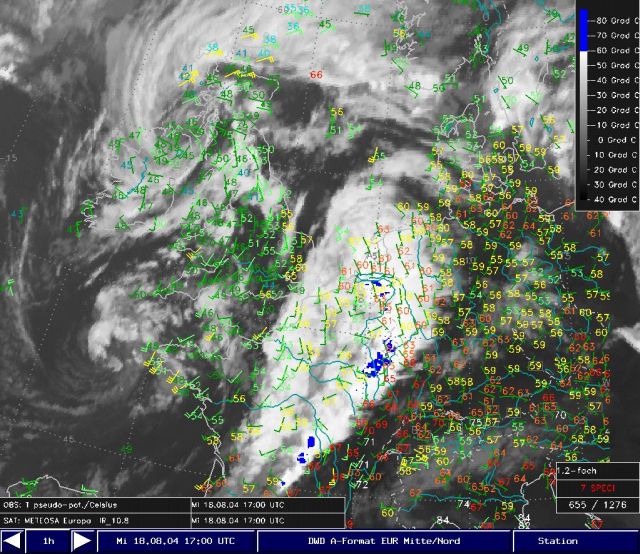
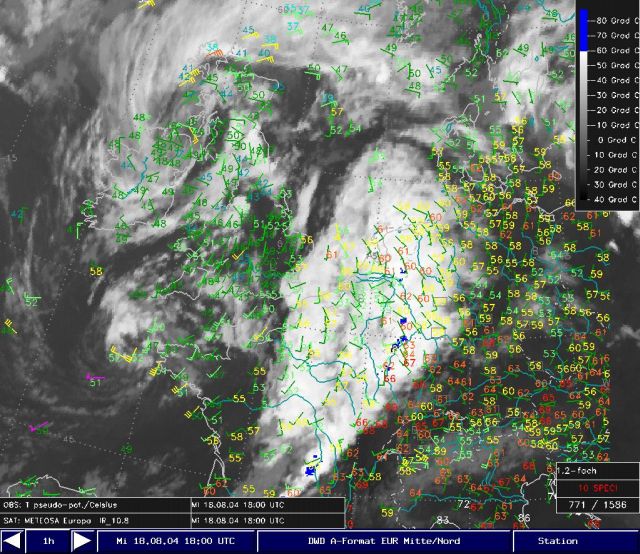
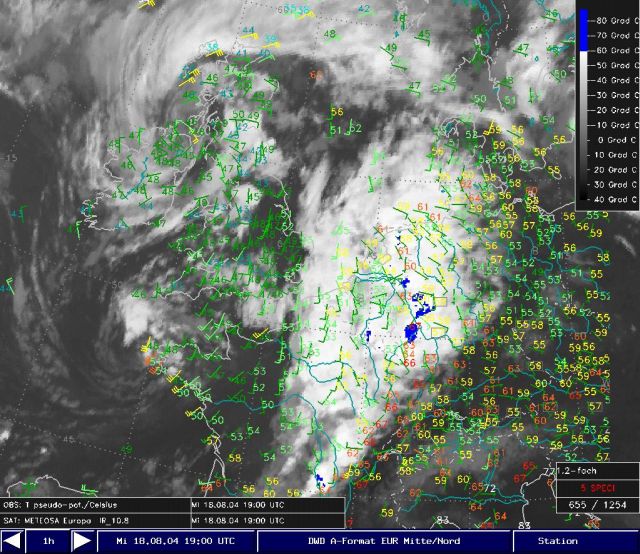
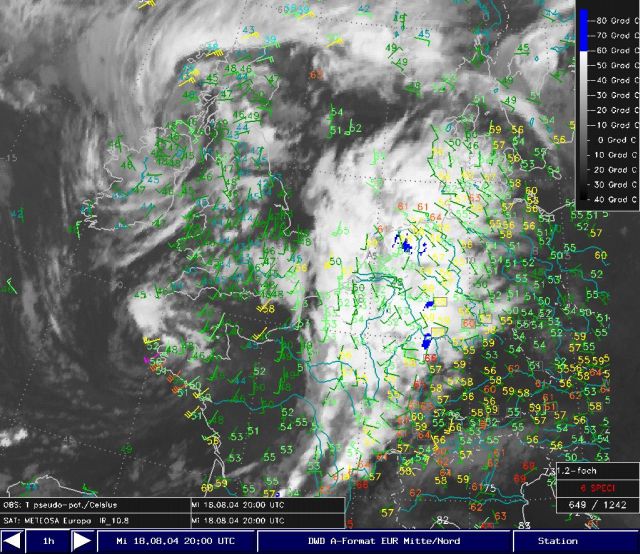
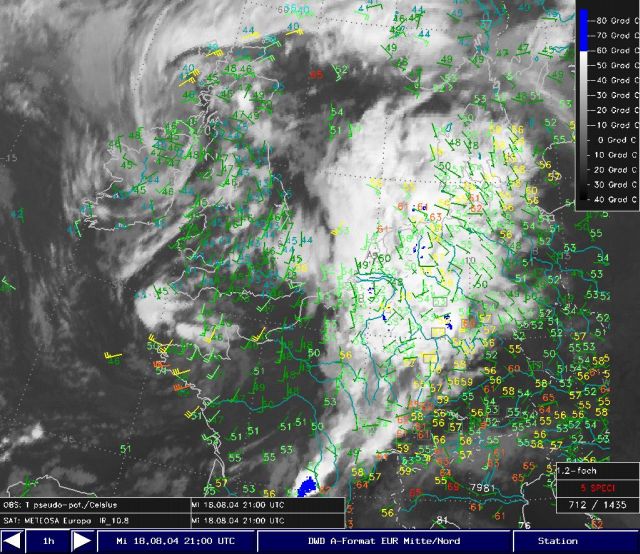
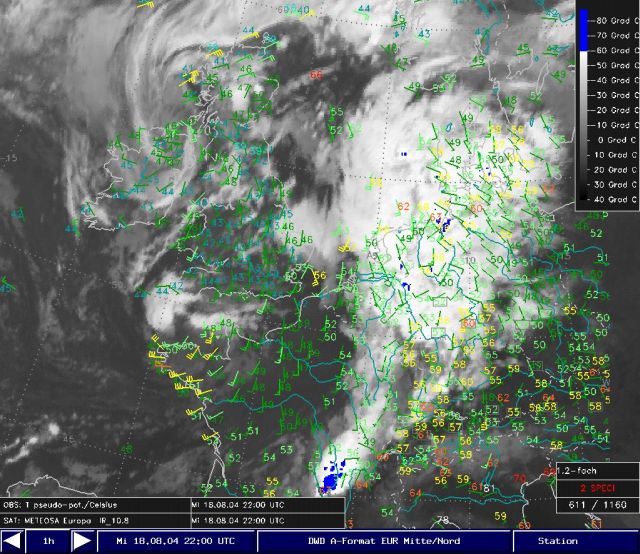
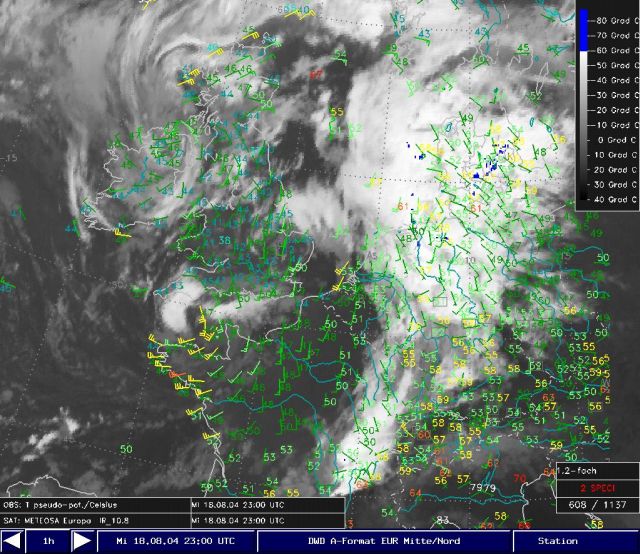
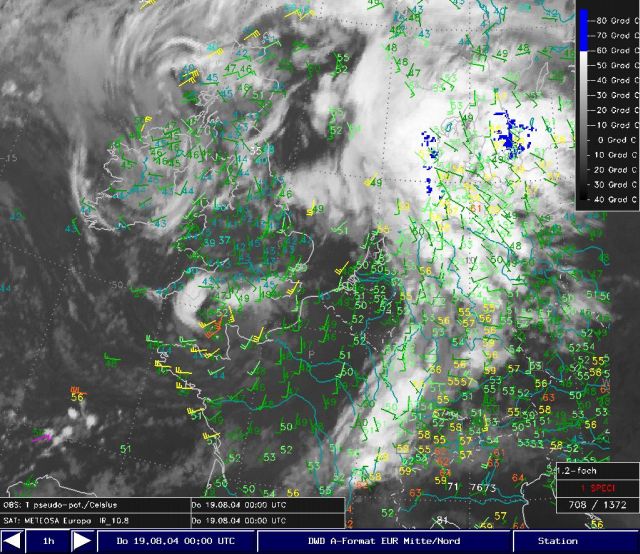
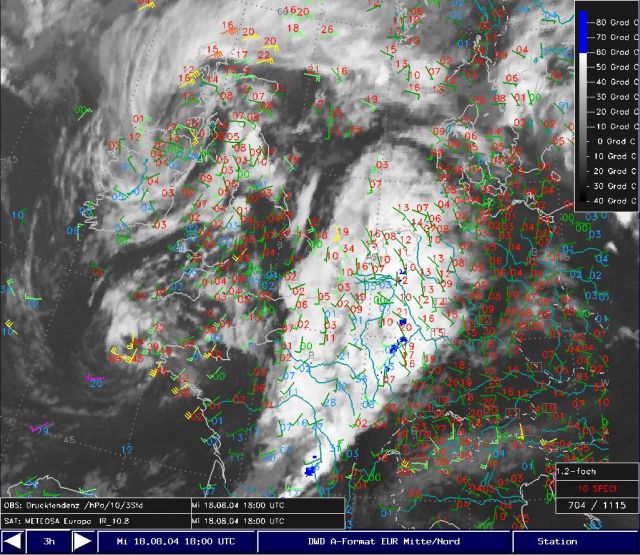
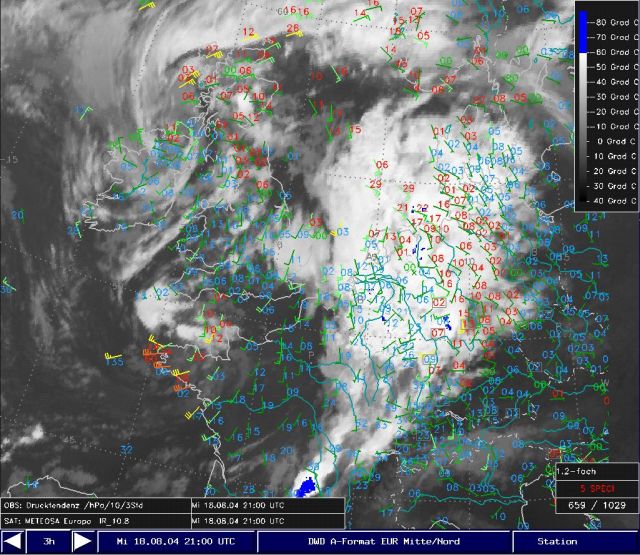
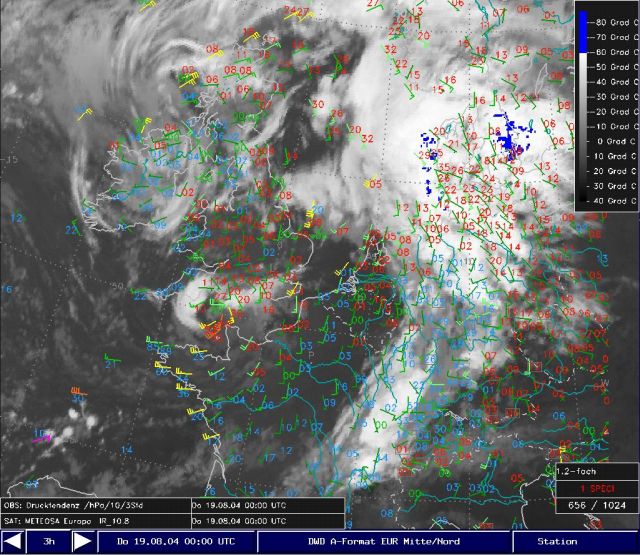
Gallery 4: IR-imagery, surface measurement of pseudopotential temperature and wind: time sequence
In this chapter the pseudopotential temperature in combination with the 10m-wind barbs are considered. This will allow us to follow the movement and development of the surface convergence and the air mass type. A comparison will be made with the satellite imagery.
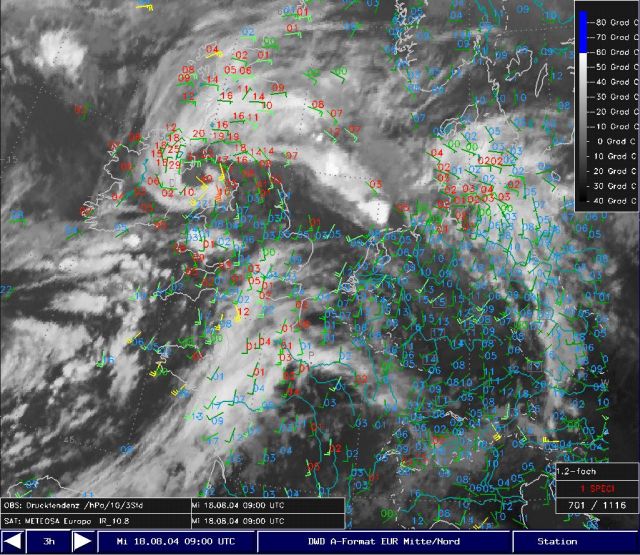
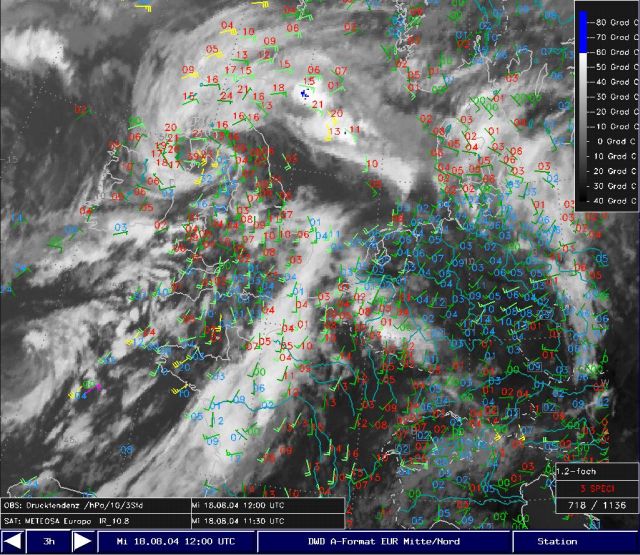
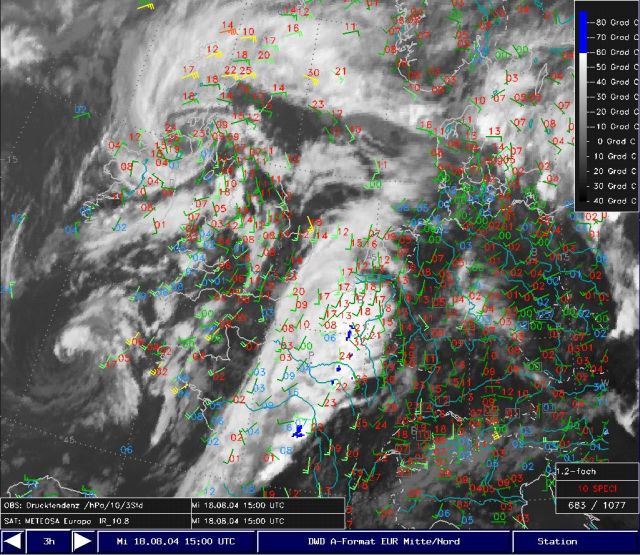
Gallery 5: IR-imagery, tendency of surface pressure and wind: time sequence
In this chapter we investigate the patterns of pressure tendency in connection with the intensity of the convergence at the surface and the IR-images.
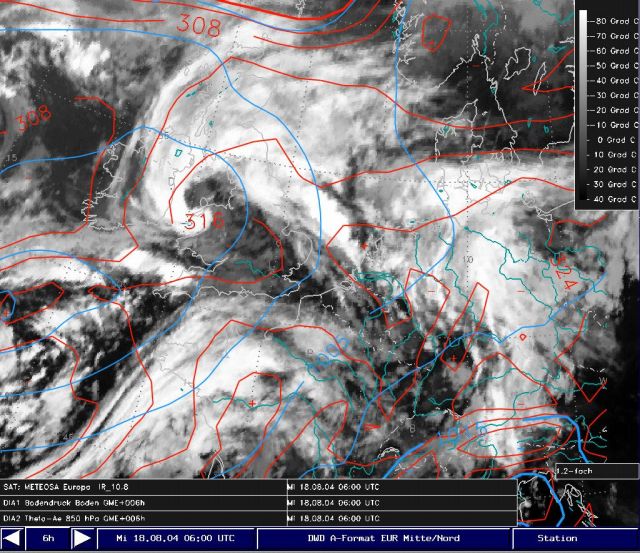
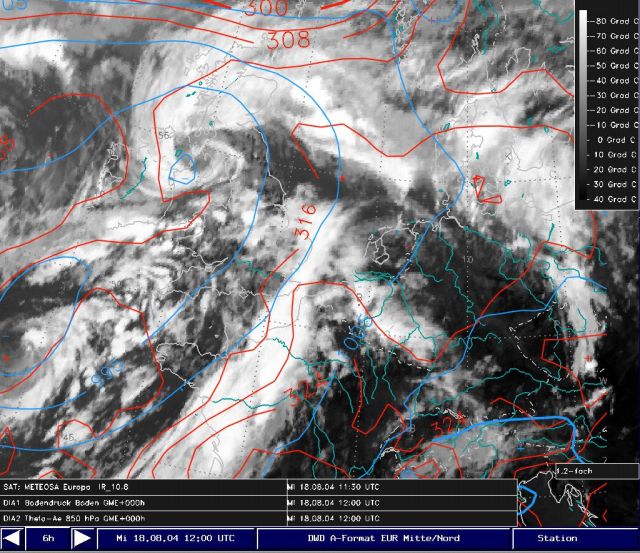
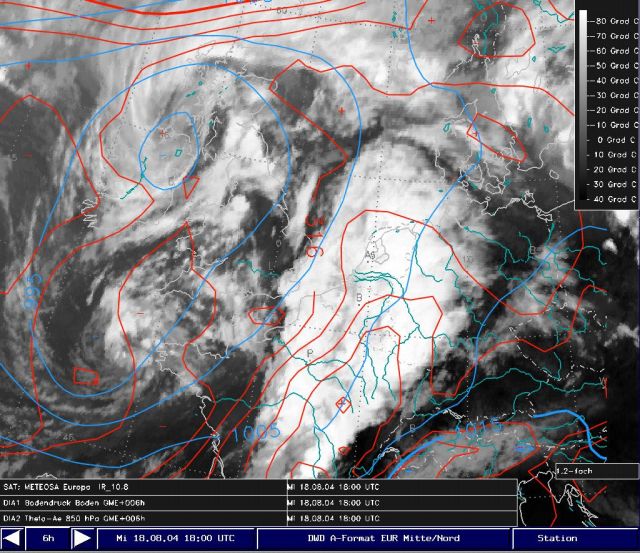
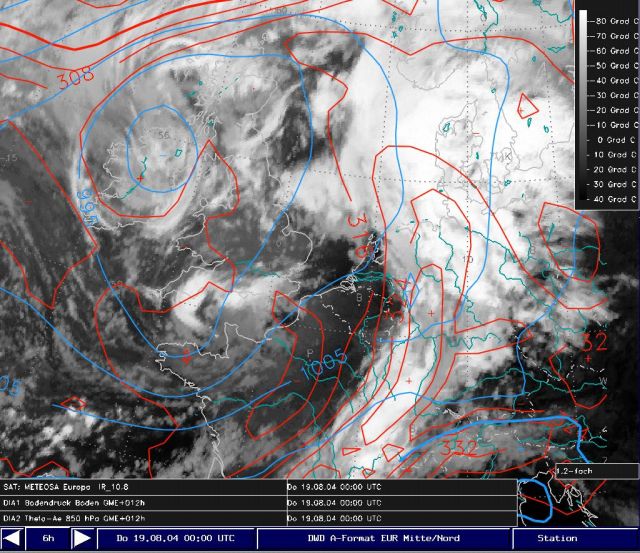
Gallery 6: IR-imagery, surface pressure and equivalent potential temperature 850 hPa: time sequence
The combination of surface pressure and theta in 850 hPa is useful for the analysis of surface fronts. If the equivalent potential temperature is above 324 K (about 50°C) it is likely that high precipitation amounts will occur.
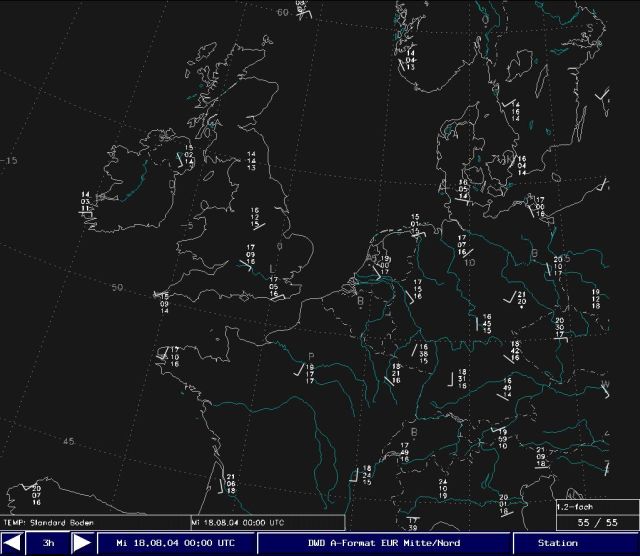
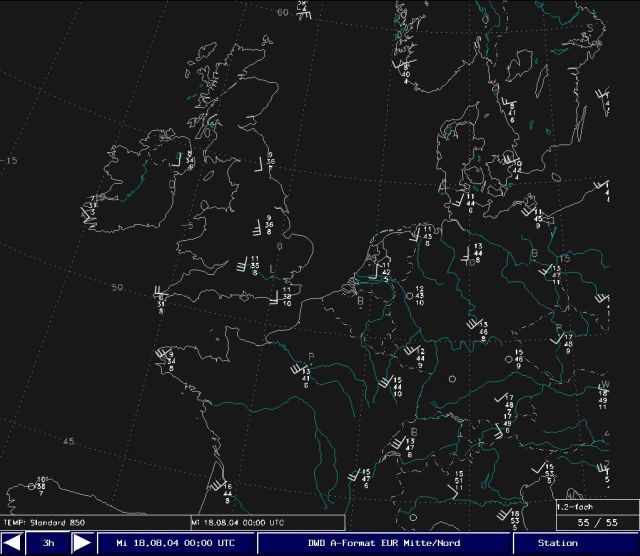
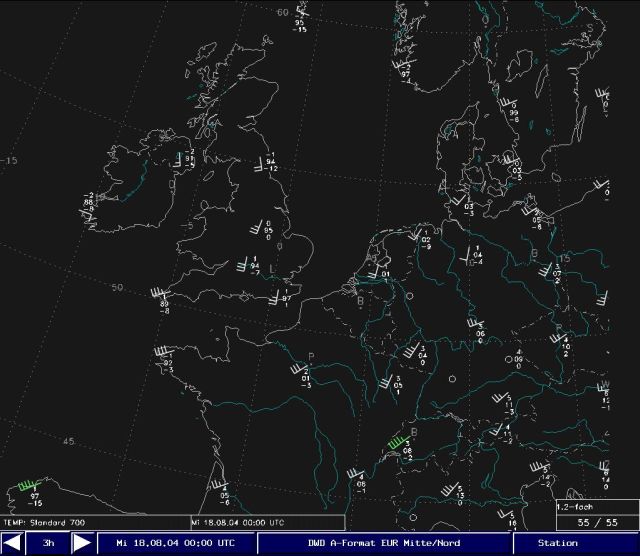
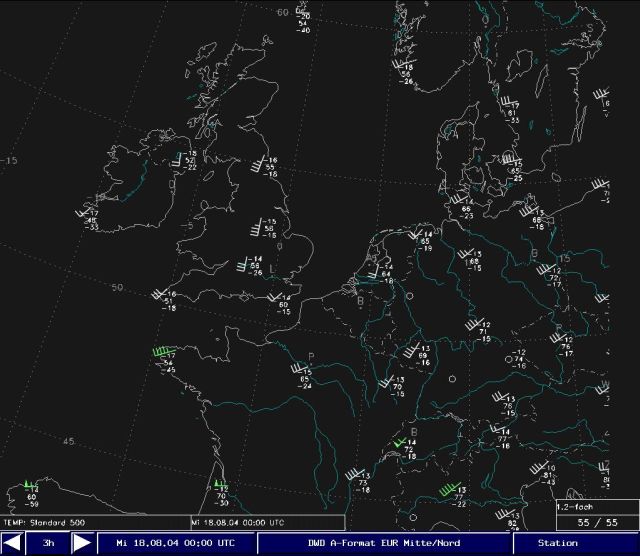
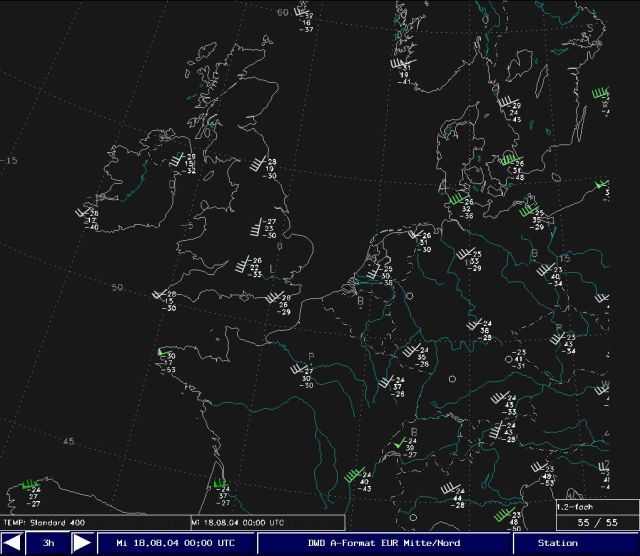
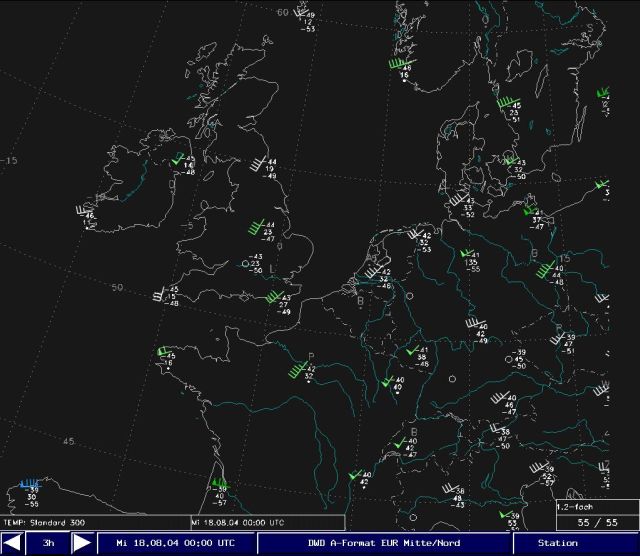
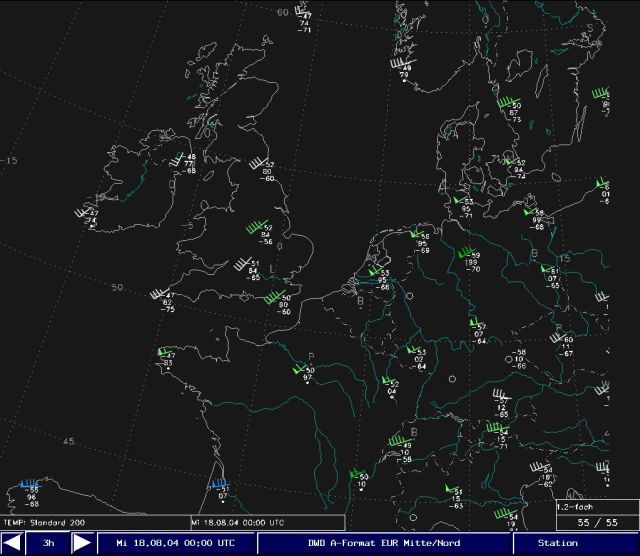
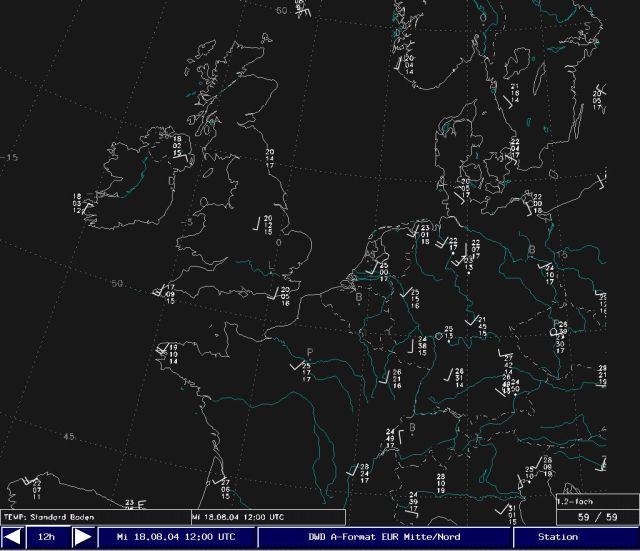
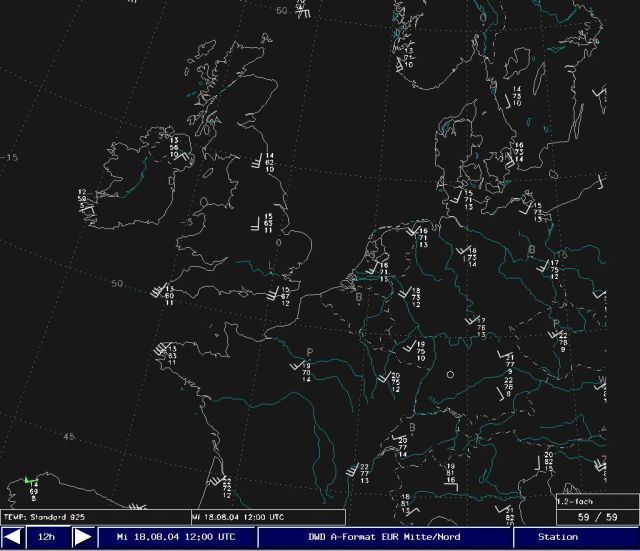
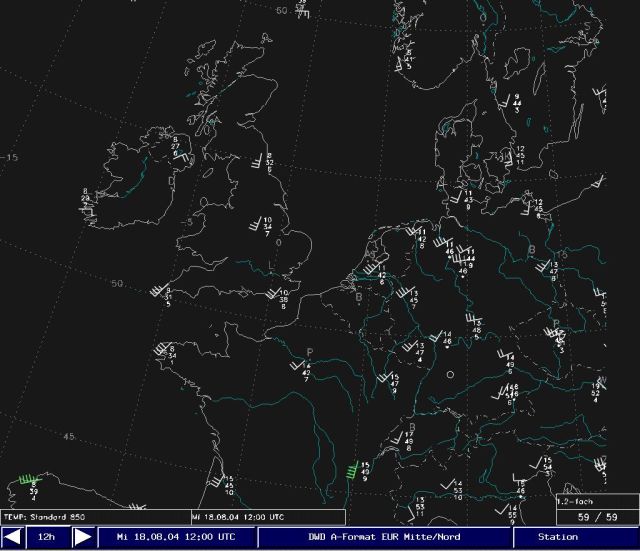
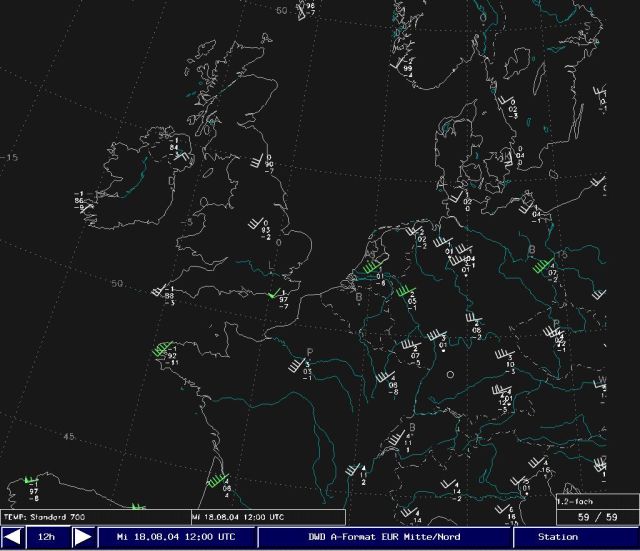
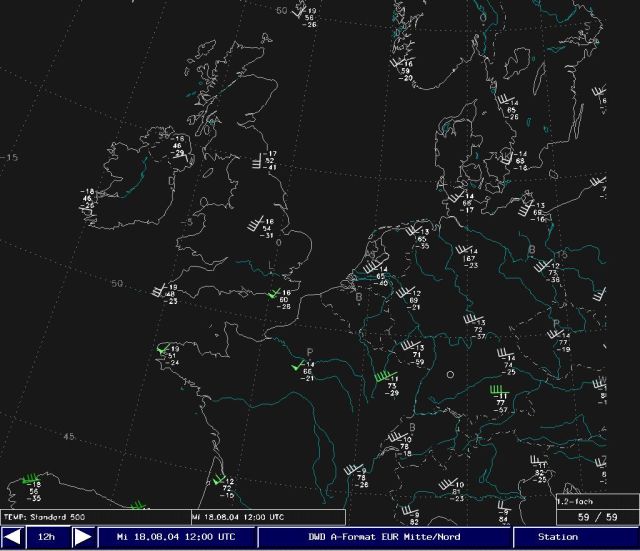
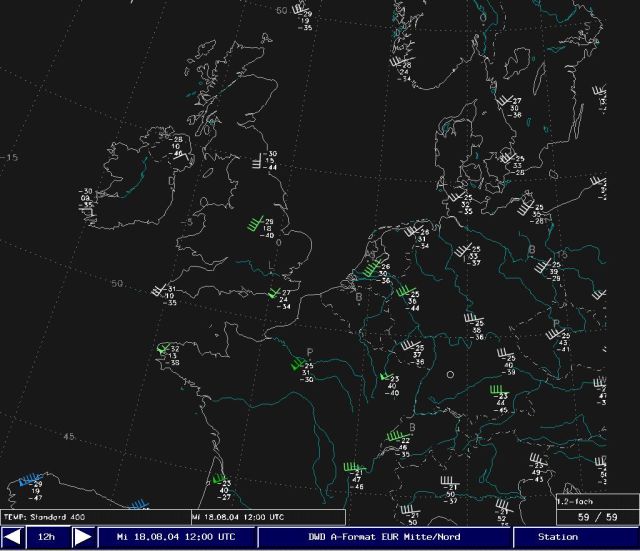
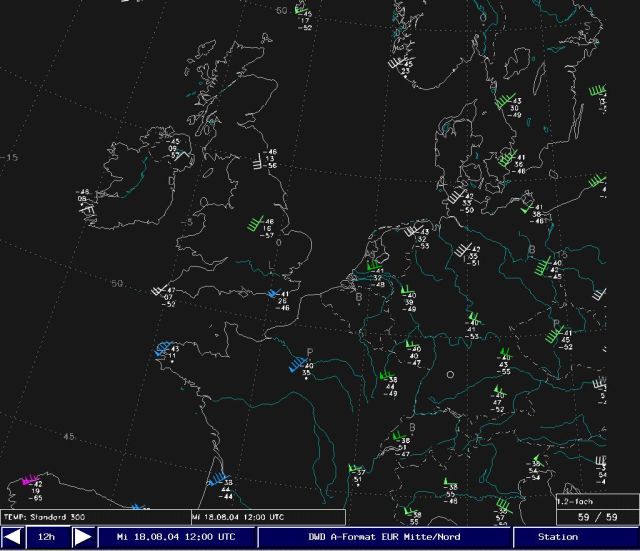
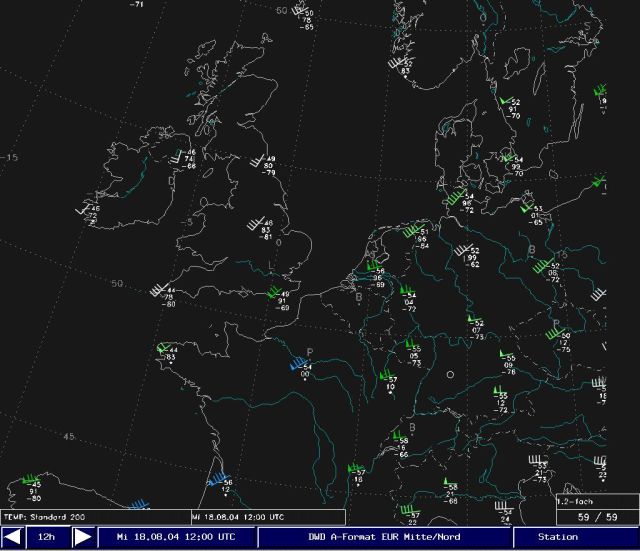
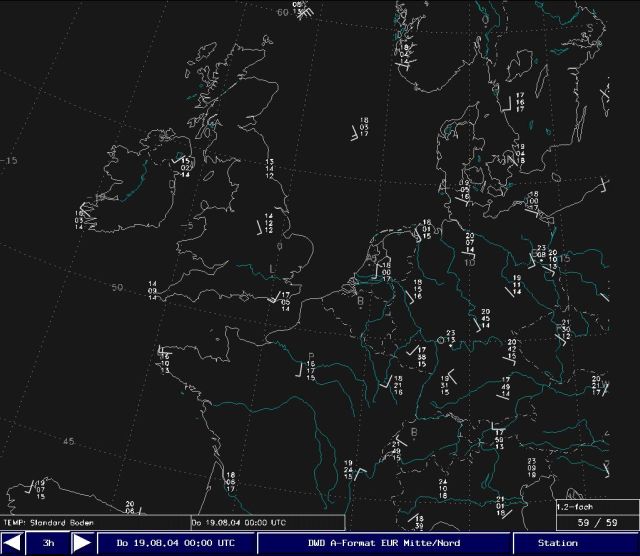
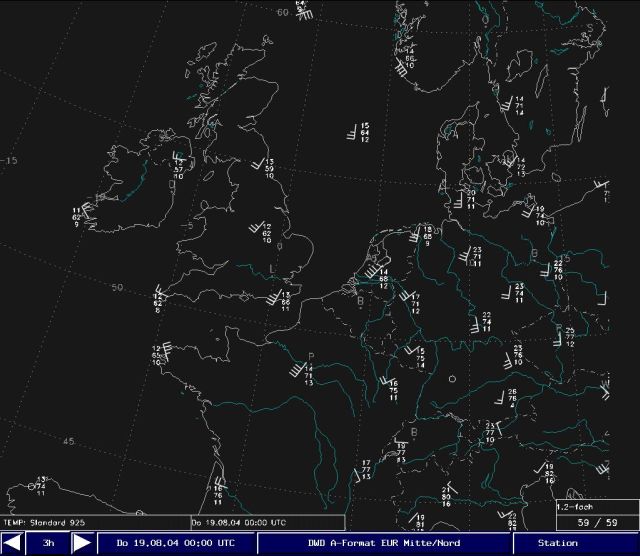
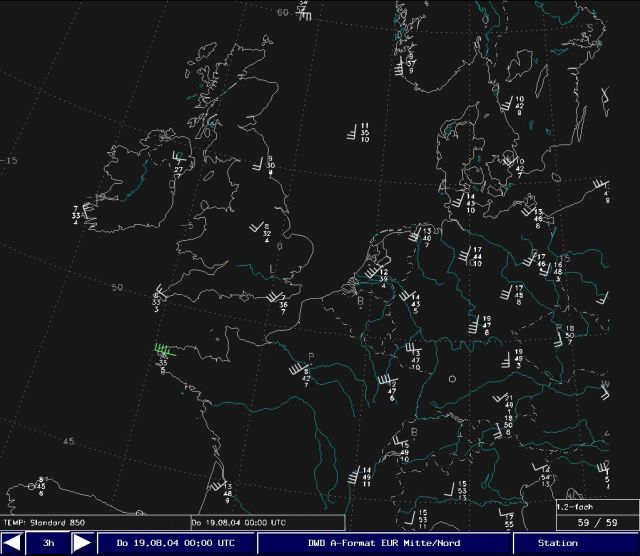
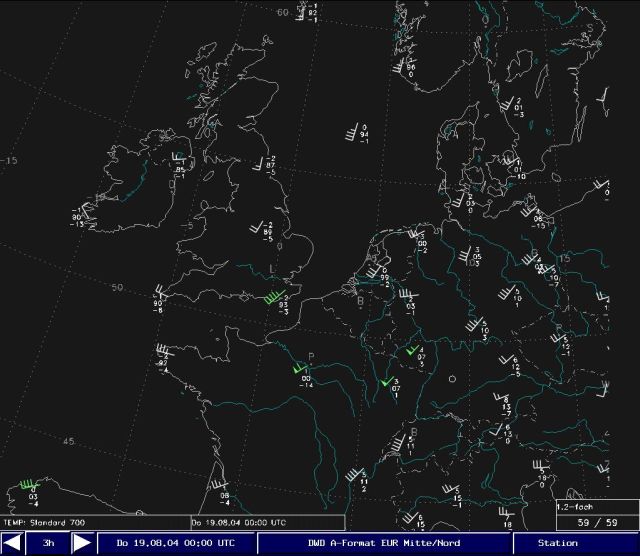
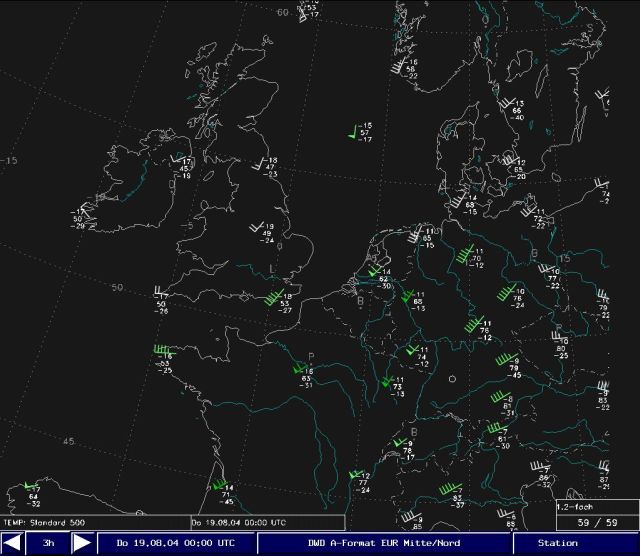
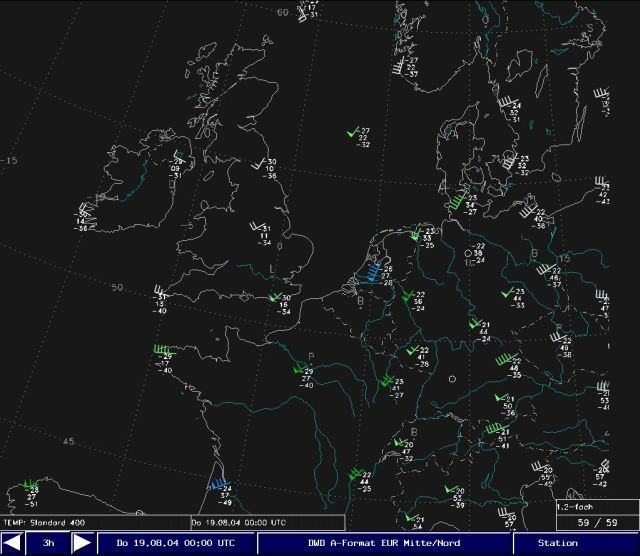
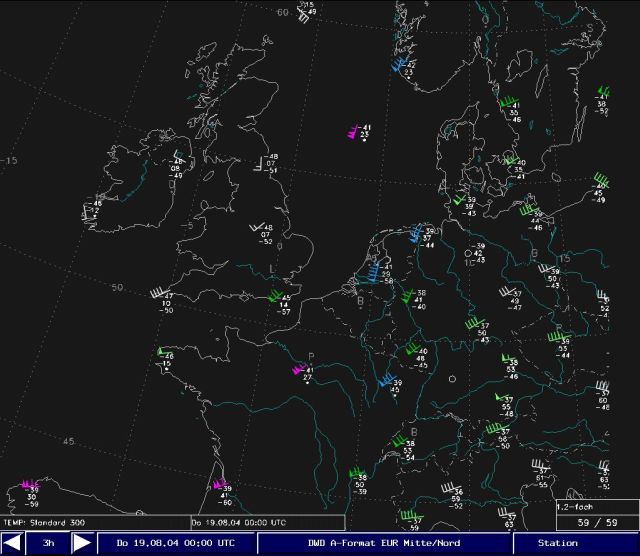
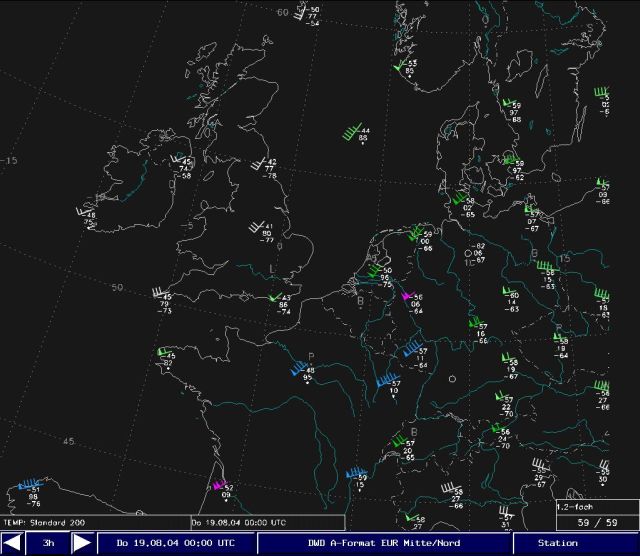
Gallery 7: Temp data in different altitudes: sequence in time and altitudes
By jumping through the altitudes of radiosounding data we find levels of temperature advection and wind sheer. Additionaly, we are able to estimate the gusts.
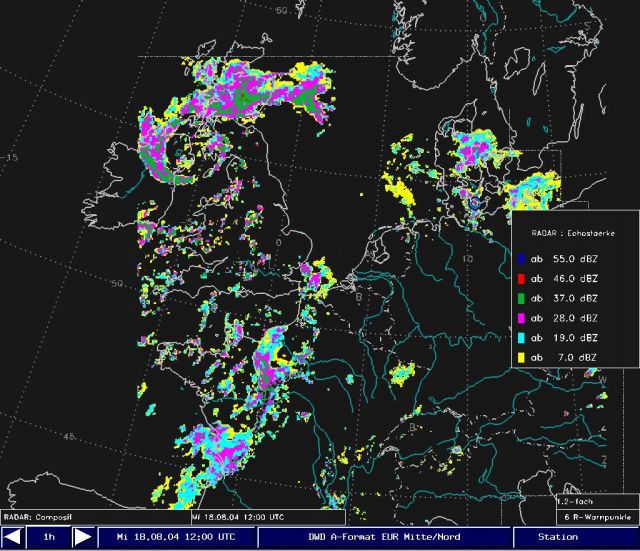
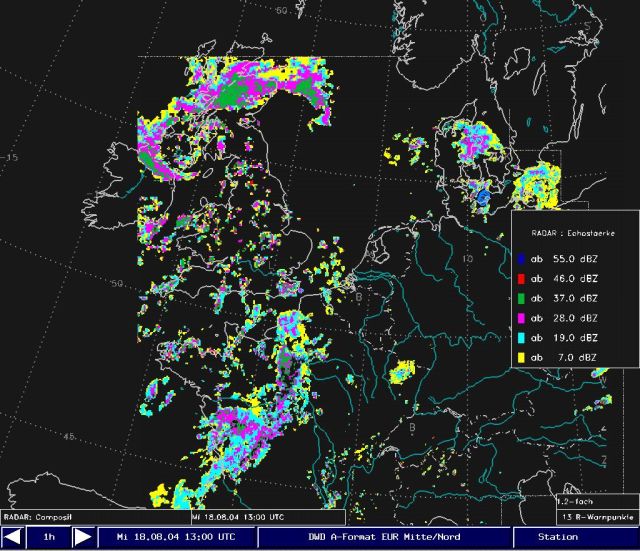
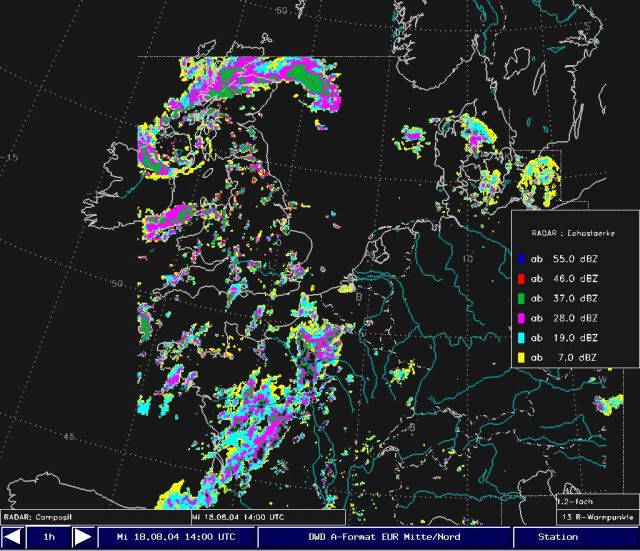
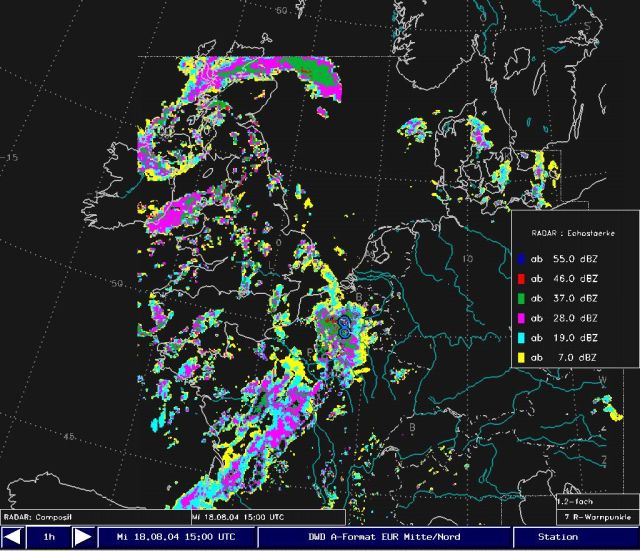
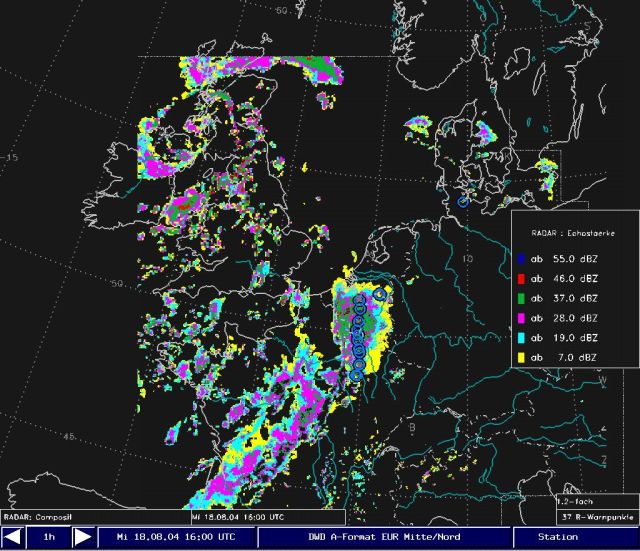
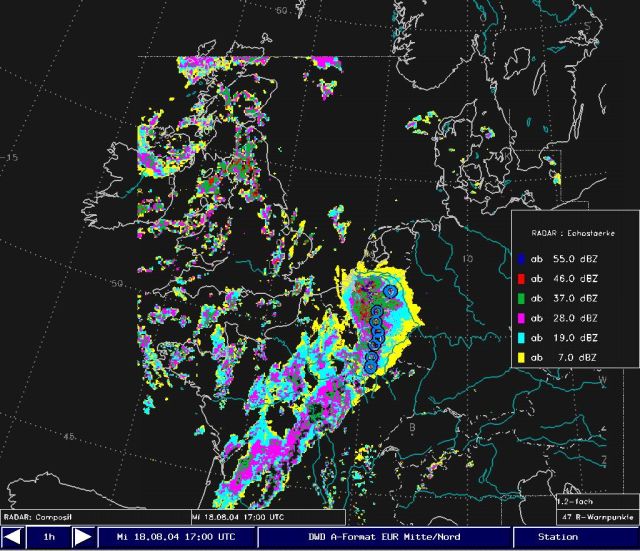
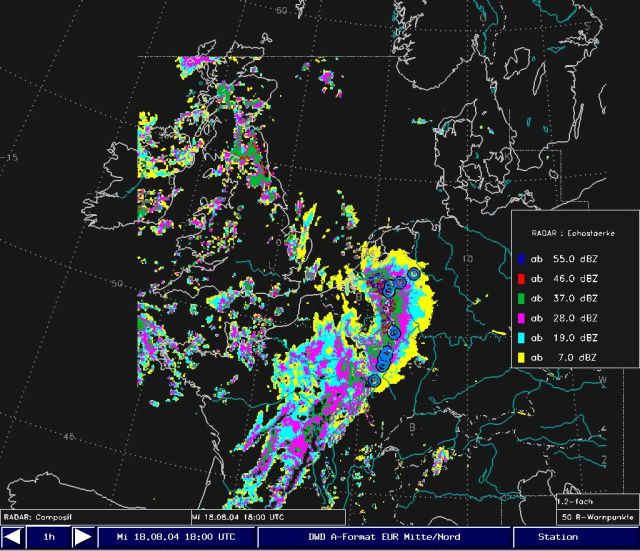
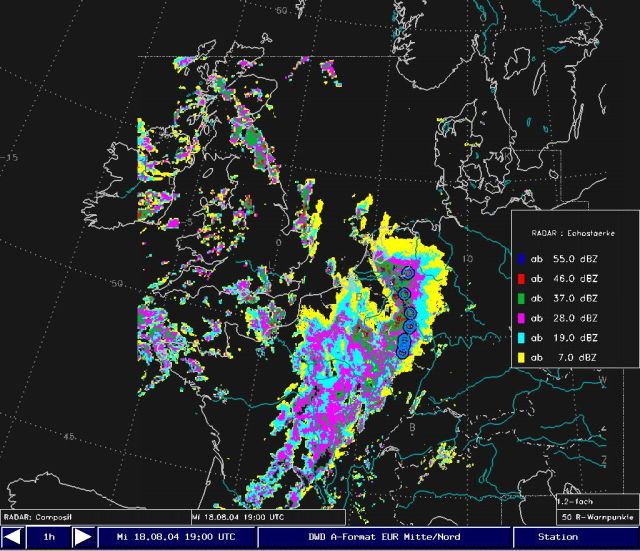
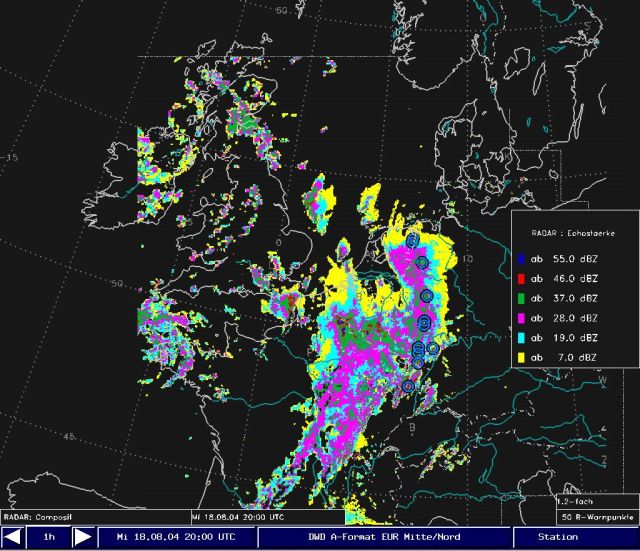
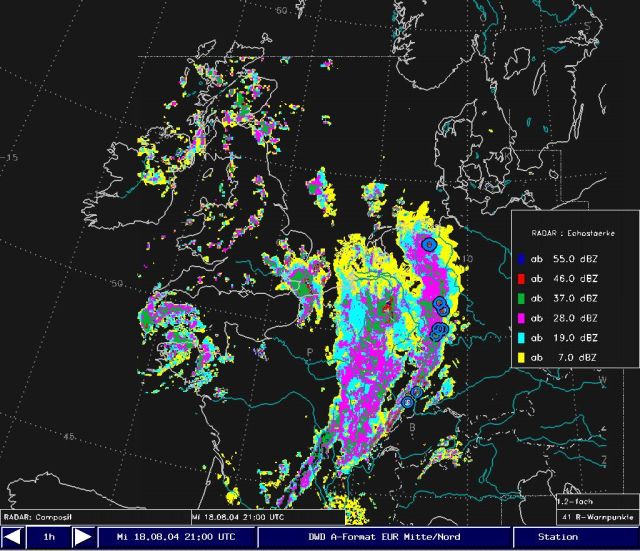
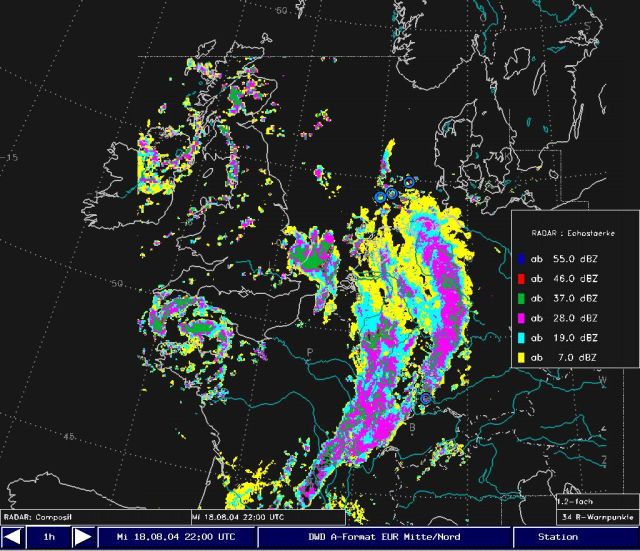
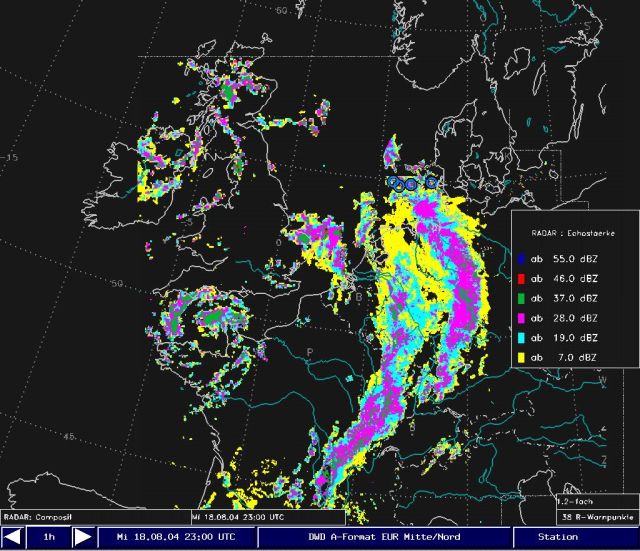
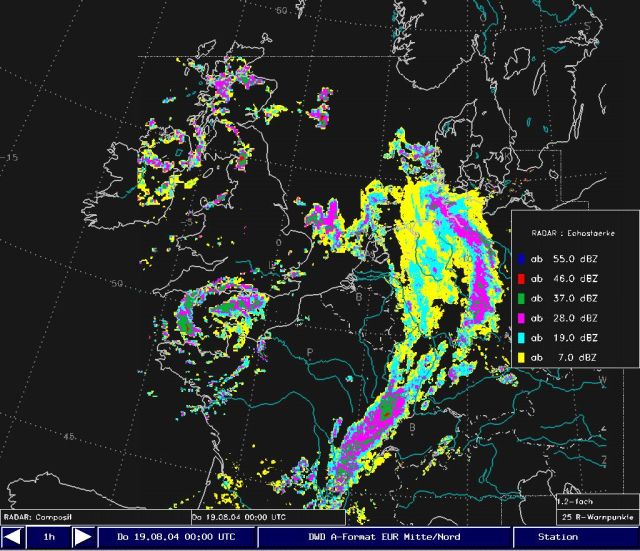
Gallery 8: Radar images (PI-composite and marker for hail warning): time sequence
In this chapter we will use radar images for a more detailed investigation of the development and the organisation of a typical squall line structure.
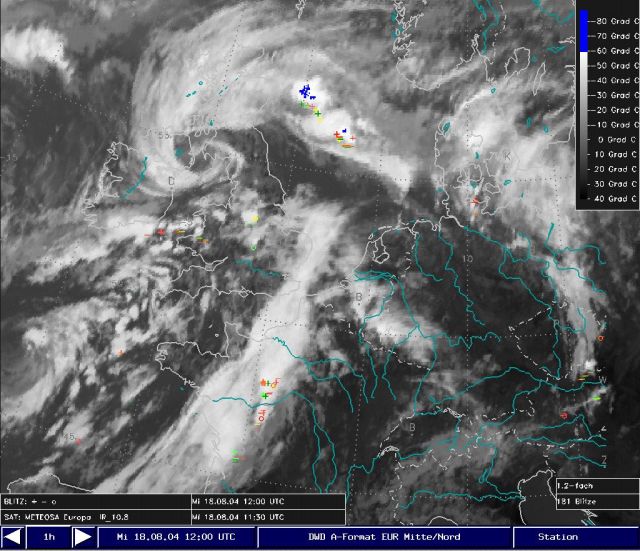
Gallery 9: IR-imagery and lightning: time sequence
The combination of satellite images and lightning data show us the relationship between the high extending clouds and the maximum lightning activity.
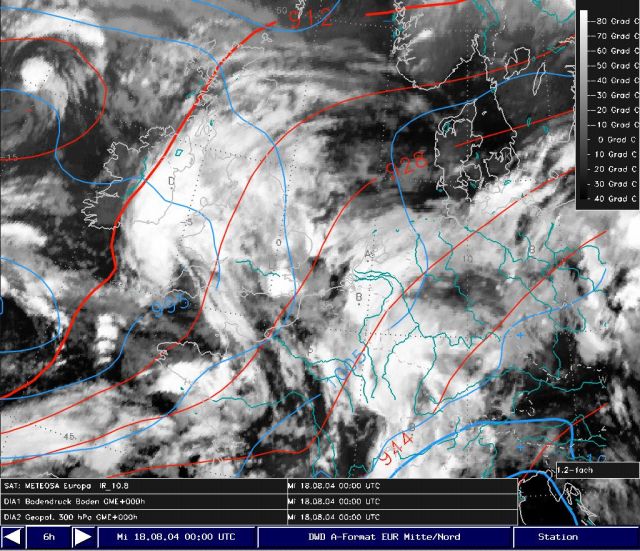
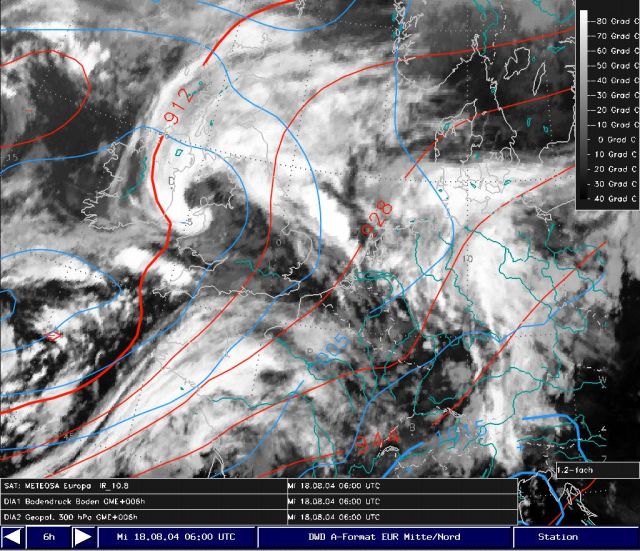
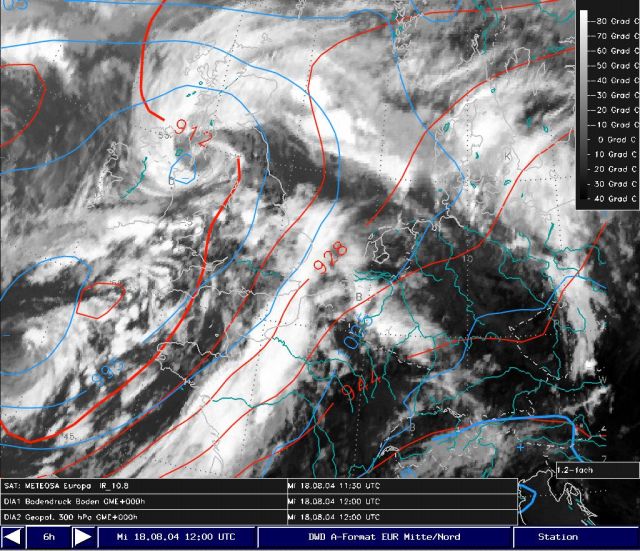
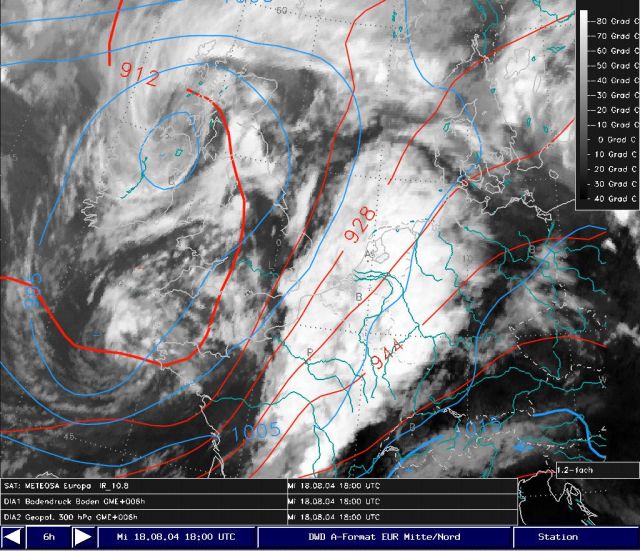
Gallery 10: IR-imagery, surface pressure and geopotential 300 hPa: time sequence
In this chapter we follow the development of the clouds in correspondence to the fields of surface pressure and geopotential in 300 hPa. During summer we find more details about the structure if we use the geopotential in 300 instead of 500 hPa.
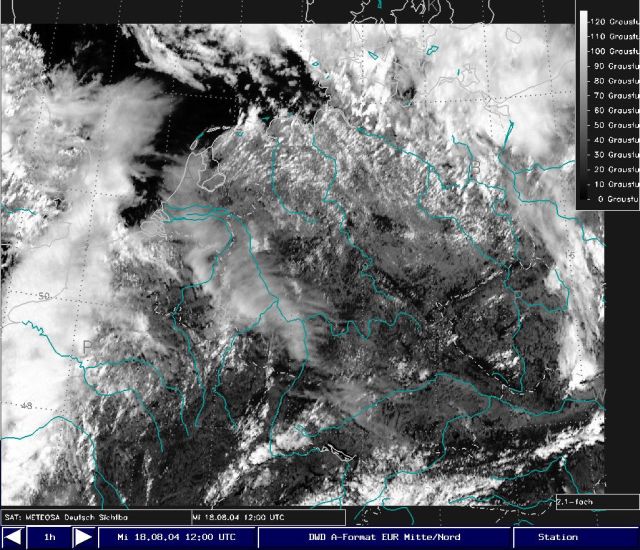
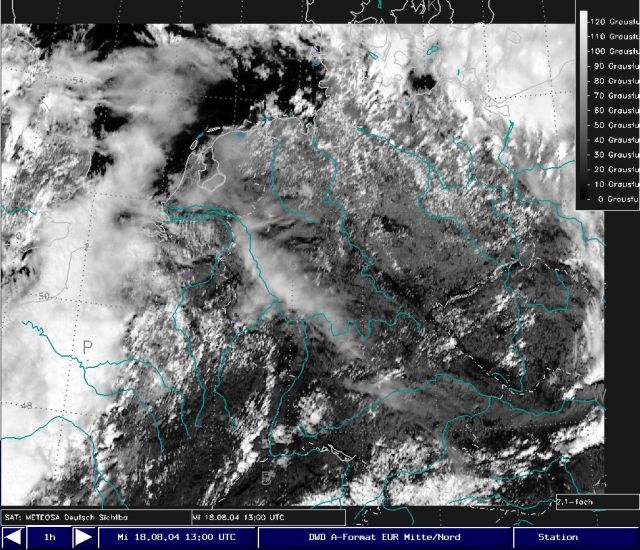
Gallery 11: HRV-imagery: time sequence
In this chapter the potential of the MSG-channel HRV will be demonstrated by investigating some details of the structure of deep convection.
Summary of the investigations in this chapter
The case from 18-19 August 2004 is an example of a classical squall line:
- The maximum intensity was achieved during the afternoon and evening;
- Two short wave troughs (geopotential 300 hPa) moved quickly over the high extending cloud band and triggered intense convection. The surface pressure decreased, and exhibited near the squall line, typical formation of a "thunderstorm sack"
- The maximum of the equivalent potential temperature in 850 hPa and the position of the squall line corresponded very well with each other. The values of more than 324 K (signal intense precipitation) were reconfirmed by surface observations (up to 30 mm/3h).
- The radiosounding winds showed an intensifying vertical temperature gradient for the regions east of the squall (warm air advection below 850 hPa, negligible advection above). Until the evening the wind speed achieved values of up to 60 knots at 700 hPa and more than 100 knots at 300 hPa. This indicated the risk of severe gusts and an intense frontal zone, respectively. Gusts of beaufort 9 (flat areas) and 11 (mountaineous areas) were reported.
- The pseudopotential temperatures at the surface sometimes exceeding 70°C indicating a high probability of severe thunderstorms. During the afternoon and evening some reports of severe thunderstorms were reported, occasionally with hail.
- The patterns of surface winds and observations of surface pressure showed a clear confluence indicating the position of the squall line. At the leading edge mesoscale lows developed in combination with negative pressure tendencies. At the rear mesoscale highs with increasing pressure could be found.
- The satellite imagery, radar and lightning data showed the classical structure of a squall line: Rough banded patterns of convection (HRV, IR-images) in the leading edge and central parts and predominantly homogeneous structures between the central and rear. On the leading edge cloud top temperatures below -60°C were detected (i.e. risk of hail). This was confirmed on the corresponding radar images.