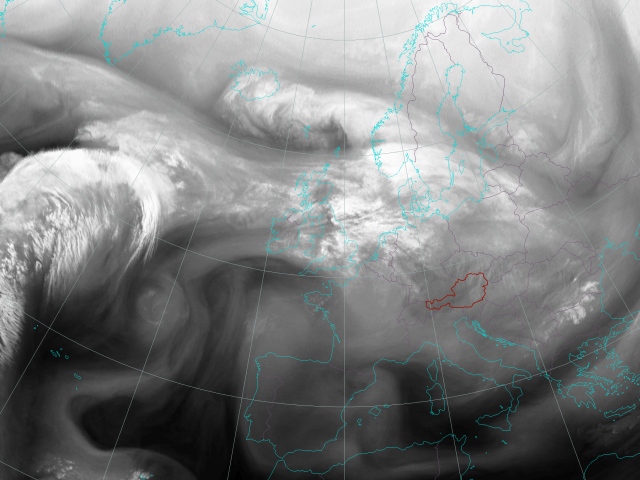

The focus in this chapter is on the development of the dry intrusion and the localisation of the jet stream. The Water Vapour channel provides important information on upper troposheric humidity.
This WV image shows wide areas of high upper-tropospheric humidity. These areas are associated with the low pressure systems over northern Europe and to the south of Greenland. The area between these systems represents the polar front zone.
Relevant for the rapid cyclogenesis on 19 November is the development that starts about this time south of Greenland.
From this time step on a double structure of dark stripes can be noticed.
This double structure becomes clearer. The dark stripes in WV images can usually be linked to the dry air on the cold side of a jet stream.
The two dark areas are getting closer to each other. The wind speed in upper level of the troposphere increases.
In this image the formation of the cloud head can be observed, clearly separated from the higher cloudiness on its southern side. The small dark area between the cloud head and the frontal cloud band hints at the position of the jet. This will be further documented in the chapter dealing with isotachs at 300 hPa.
The cloud head appears in greyish colours. The cloud tops are much lower than the frontal band to the South as already seen in the IR channel. The configuration is classical and fits the conceptual model of a rapid cyclogenesis marking the initial stage of the development.
At this time step the intrusion of dry air between the cloud head and the frontal band becomes visible. The evolution of this dry intrusion can be followed nicely in the following WV images.
The dark zone is broadening, indicating the dissipation of cloudiness. The advected air of the dry intrusion originates from lower levels of the stratosphere (see chapter Airmass).
The flow of downward-protruding dry stratospheric air is usually characterized by high values of potential vorticity. This association will be documented in the chapter dealing with derived meteorological parameters.
The dark area keeps growing and is strongly influenced by a strong upper air stream. The NW direction of upper troposheric winds is to be identified in the WV image as well as in IR imagery.
Upper air stream still dominates at this time step advecting dry upper air farther to the South. The dark area keeps growing and the higher cloudiness is separated sharply on its northern side from the dry air. At this time step the surface cold front is currently situated between Great Britain and France. However, this cannot be seen in WV images at this time, while in IR imagery this split-front character was well represented. The overshooting of the dry air, obviously driven by high upper wind speeds, is remarkable.
At this time step the surface cold front is getting recognizable in the Water Vapour image. However, the localisation of the front is difficult with WV imagery. It can be identified by the beginning formation of a small dry slot on the northern edge of the cold front.
The dark stripe becomes more clearly visible but will get very obvious only three hours later.
At this time step the dry slot is clearly seen as a narrow region of dark pixel values. This dry slot reaches far into the cloud head and is situated on the northern edge of the frontal cloud band. The storm over the High Tatras takes place in the West of the northeastern most part of the dry slot.
The dry slot can still be seen well with a larger dark area over southern Poland. On its western side high northern winds lead to the devasting storm on lee side of the High Tatra Mountains.
The dry slot is getting less clear. However, the separation of the cloud head from the frontal cloud band by the dark area can still be seen.
Typical for this development was the deepening of potential vorticity coinciding with the position of the dry slot which will be shown in the chapter dealing with potential vorticity.
The dry slot still reaches far into the cyclonically curved cloud head.
The system moves to the North. The entire development will be documented in the next chapter by the Airmass RGB which can be even more helpful for analysing the downward protrusion of dry stratospheric and upper tropospheric air.